Market Overview
| Study Period | 2020 - 2031 |
|---|---|
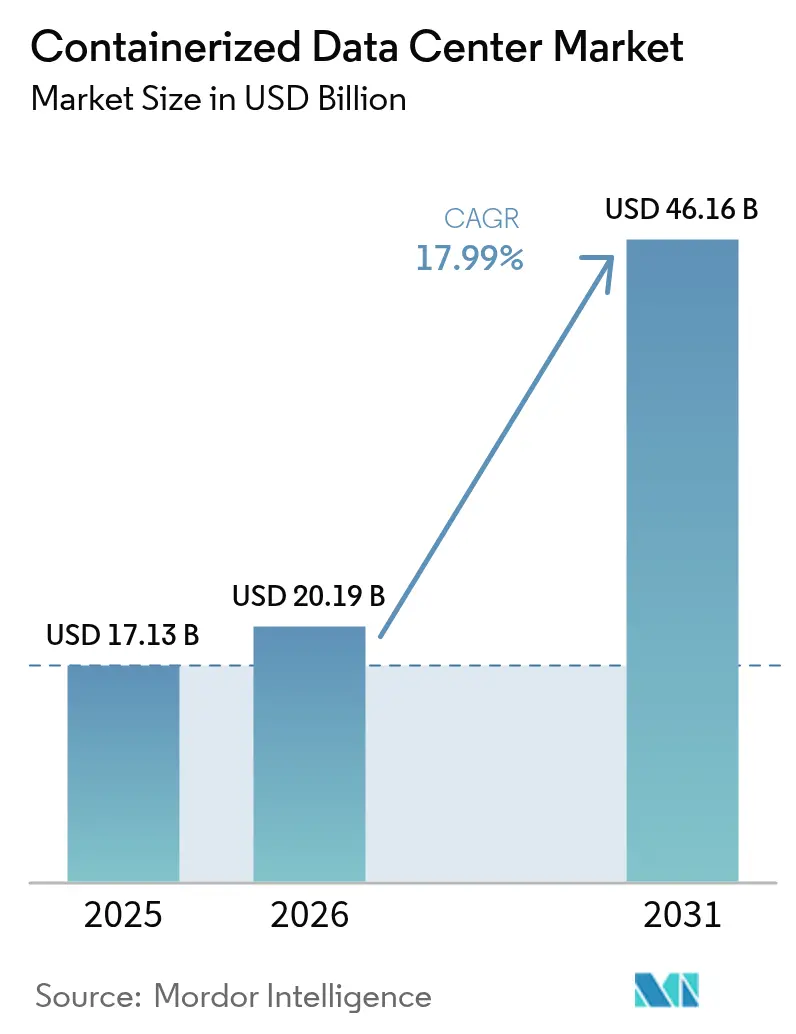
| Market Size (2026) | USD 20.19 Billion |
| Market Size (2031) | USD 46.16 Billion |
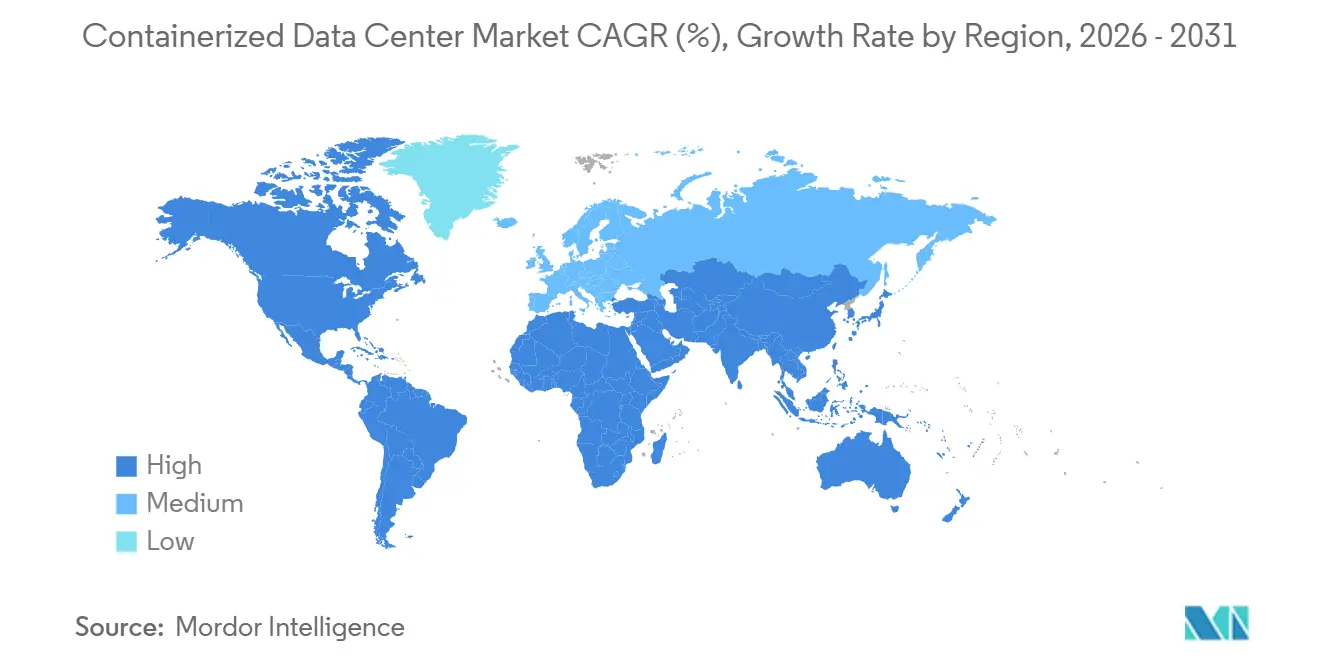
| Growth Rate (2026 - 2031) | 17.99% CAGR |
| Fastest Growing Market | Asia Pacific |
| Largest Market | North America |
| Market Concentration | Low |
Major Players *Disclaimer: Major Players sorted in no particular order Image © Mordor Intelligence. Reuse requires attribution under CC BY 4.0. | |
Containerized Data Center Market Analysis by Mordor Intelligence
The containerized data center market size is expected to increase from USD 17.13 billion in 2025 to USD 20.19 billion in 2026 and reach USD 46.16 billion by 2031, growing at a CAGR of 17.99% over 2026-2031. A decisive shift toward prefabricated, ISO-standard modules is shrinking deployment cycles to under twelve weeks and allowing operators to monetize capacity before utility interconnection is finalized. Tier-1 hubs facing power and land constraints are absorbing containers at record speed, while thousands of emerging edge micro-sites tied to 5G rollouts require form factors that traditional construction cannot serve economically. The containerized data center market continues to benefit from regulatory pressure for energy efficiency, with factory-assembled units routinely beating the PUE benchmarks of legacy builds.
Key Report Takeaways
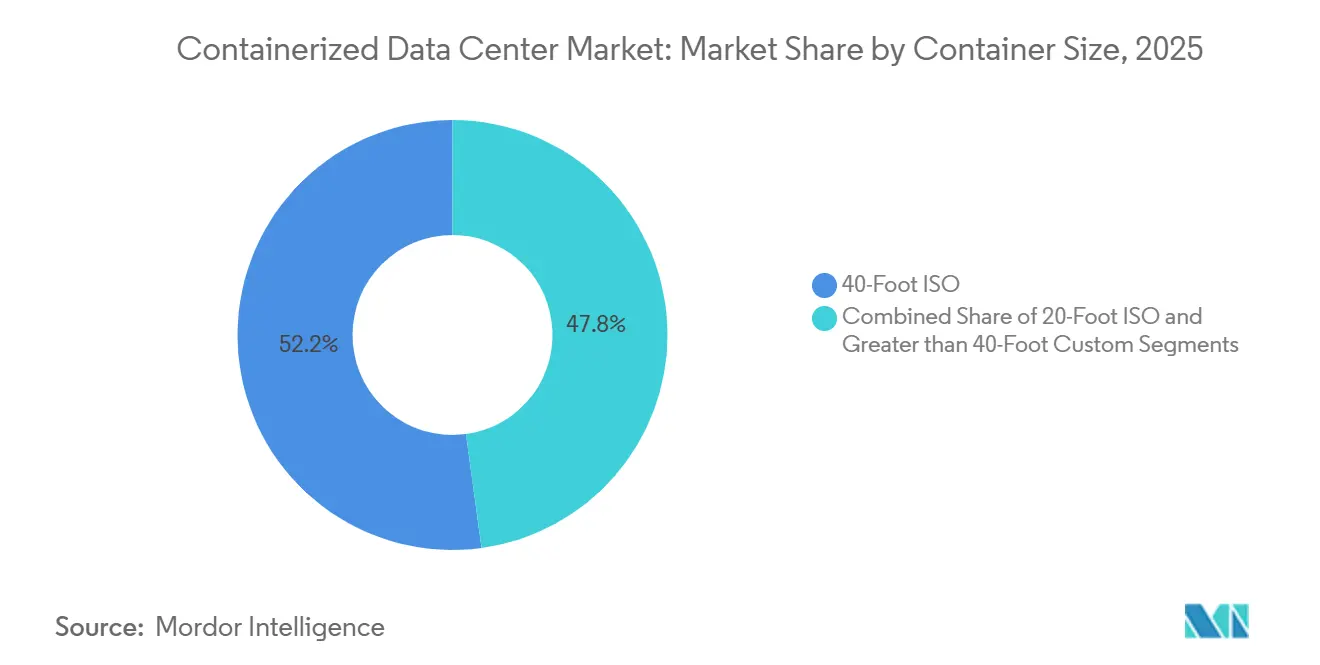
- By container size, 40-foot ISO units led with 52.16% of the containerized data center market share in 2025; 20-foot modules are forecast to expand at an 18.43% CAGR through 2031.
- By component, IT modules held 41.47% share of the containerized data center market size in 2025, while power modules are advancing at an 18.35% CAGR to 2031.
- By tier type, Tier 3 installations accounted for 51.62% of the containerized data center market in 2025 and Tier 4 is projected to grow at an 18.85% CAGR over 2026-2031.
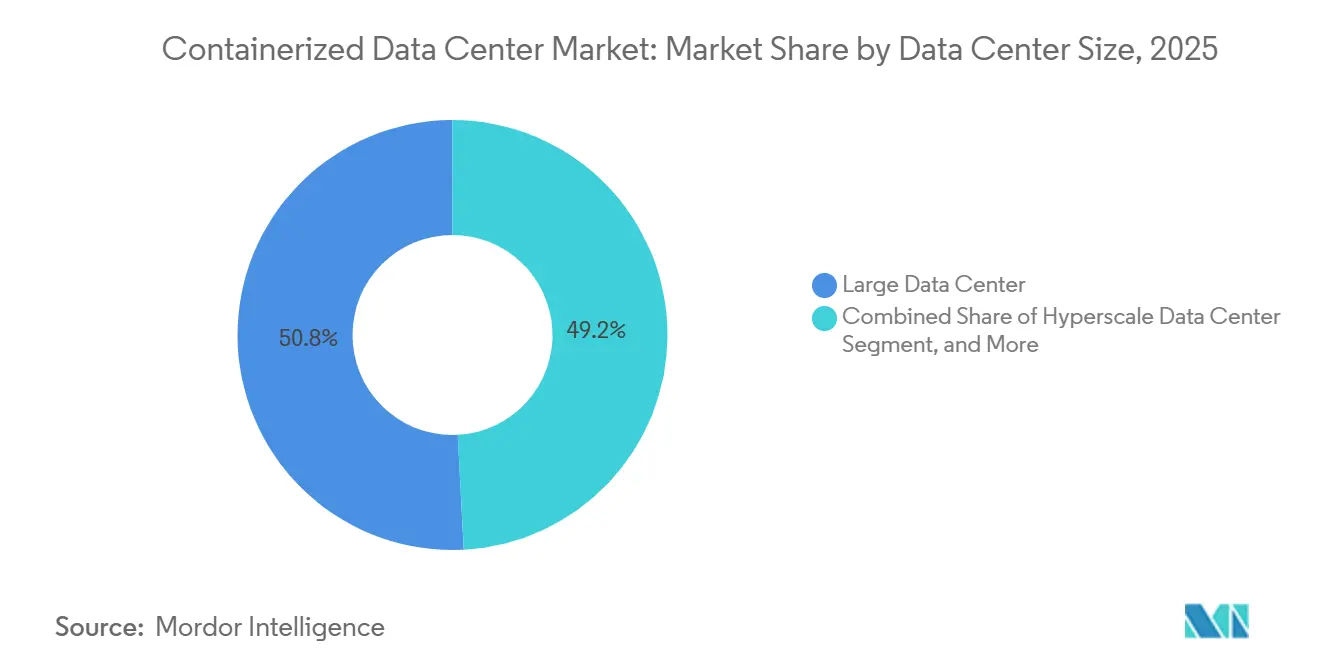
- By facility size, large data centers captured 50.84% of the market share in 2025; hyperscale nodes are the fastest-growing at an 18.57% CAGR.
- By data center type, colocation providers led with 53.77% share in 2025, whereas hyperscalers are set to log an 18.72% CAGR through 2031.
- By geography, North America commanded 40.93% of the market share in 2025, yet Asia-Pacific is on track for the highest regional CAGR of 18.91% to 2031.
Note: Market size and forecast figures in this report are generated using Mordor Intelligence’s proprietary estimation framework, updated with the latest available data and insights as of 2026.
Global Containerized Data Center Market Trends and Insights
Drivers Impact Analysis*
| Driver | (~) % Impact on CAGR Forecast | Geographic Relevance | Impact Timeline |
|---|---|---|---|
| Portability and Rapid Deployment | +3.2% | Global, early gains in Northern Virginia, Frankfurt, Singapore | Short term (≤ 2 years) |
| Edge and 5G Build-Outs Accelerate Micro-Sites | +3.8% | Asia-Pacific core, spill-over to North America and Europe | Medium term (2-4 years) |
| Data-Center Capacity Shortages in Tier-1 Hubs | +3.5% | North America and EU Tier-1 cities | Short term (≤ 2 years) |
| Energy-Efficient Prefabrication Lowers TCO | +2.9% | Global, under EU energy-efficiency influence | Medium term (2-4 years) |
| SMR-Powered Micro-Grids Enable Off-Grid DCs | +2.1% | North America, Middle East, Australia | Long term (≥ 4 years) |
| Crypto-to-AI Site Conversions Unlock Power | +2.4% | North America, Nordic region, select Asia-Pacific markets | Short term (≤ 2 years) |
| Source: Mordor Intelligence | |||
Portability and Rapid Deployment
Containerized modules cut the journey from purchase order to usable capacity from more than a year to just a few weeks, letting operators sign revenue-generating contracts well ahead of utility approval. Equinix activated 18 MW of capacity in 2025 by dropping forty-two 40-foot units into existing campuses, a play that sidestepped labor shortages common to stick-built projects.[1]Equinix, “IBX Expansion with Modular Deployments,” equinix.com The ability to relocate under-utilized containers reduces stranded capital and supports dynamic asset-management strategies. Factory acceptance testing eliminates most on-site commissioning faults, trimming mean time to revenue by nearly half.[2]Schneider Electric, “EcoStruxure Modular Data Center,” se.com Compliance with ISO 9001 and IEC 62040 further reassures risk-averse verticals that modular builds can match traditional facilities for safety and uptime.
Edge and 5G Build-Outs Accelerate Micro-Sites
Standalone 5G networks and multi-access edge computing are forcing data-center footprints to fragment into sub-500 kW nodes near population centers. ZTE shipped over 1,200 AI-optimized containers in 2025 so telecom carriers could keep compute within 20 km of radio towers, fulfilling latency targets for AR streaming and vehicle autonomy.[3]ZTE Corporation, “Containerized AI Data Centers,” zte.com.cn Singapore’s industrial landlord specified 20-foot modules to stay within strict height limits while delivering GPU-rich clusters for semiconductor quality control. Turnkey offerings that bundle small-cell radios, edge compute, and battery backup simplify rooftop and parking-lot deployment. Local environmental and EMC rules shape designs because edge sites often adjoin mixed-use neighborhoods.
Data-Center Capacity Shortages in Tier-1 Hubs
Northern Virginia, Frankfurt, and London face multi-year grid waitlists for new 10 MW connections, a bottleneck that containers partially bypass by using available substation headroom. One Frankfurt provider went live with 6 MW of containerized capacity on a brownfield site in late 2025, winning enterprise migrations from older facilities lacking liquid cooling. Amsterdam’s moratorium on fresh permits redirects demand to neighboring towns where plug-and-play modules can start operations without lengthy environmental reviews. Similar dynamics surface in Asian megacities where land scarcity and seismic codes make modular footprints economically compelling.
Energy-Efficient Prefabrication Lowers TCO
Factory-assembled containers routinely post PUE values between 1.15 and 1.25, outclassing typical warehouse retrofits that hover near 1.60. Schneider Electric’s study of a 2 MW German site recorded a 22% lifetime cost saving versus comparable stick-built capacity, attributable to reduced commissioning labor and optimized airflow. Single-source procurement locks in component pricing and caps supply-chain exposure. EU energy policy and ISO 50001 certifications push operators toward modular designs that integrate heat-recovery loops, letting them monetize waste heat through local district-energy schemes.
Restraints Impact Analysis*
| Restraint | (~) % Impact on CAGR Forecast | Geographic Relevance | Impact Timeline |
|---|---|---|---|
| Limited Rack and Compute Density vs Hyperscale | -2.7% | Global, acute in North American hyperscale hubs | Medium term (2-4 years) |
| Integration Complexity with Legacy Estates | -1.9% | North America and EU enterprise segments | Short term (≤ 2 years) |
| ISO-Container Supply-Chain Bottlenecks | -1.4% | Global, concentrated in Asia-Pacific manufacturing | Short term (≤ 2 years) |
| Liquid-Cooling Retrofits Raise CAPEX | -2.1% | Global, under energy-efficiency mandates | Medium term (2-4 years) |
| Source: Mordor Intelligence | |||
Limited Rack and Compute Density vs Hyperscale Needs
Standard 40-foot units top out at roughly 16 racks, each running 10-15 kW, far below the 50-100 kW racks needed for modern AI training clusters. Retrofitting with immersion cooling raises capacity but adds USD 800-1,200 per kW in capital cost and layers operational complexity on distributed edge fleets. Custom 60-foot footprints now in pilot at Microsoft overcome density limits, yet they dilute the interoperability advantages that underpin the containerized value proposition. Operators must also validate compliance with ASHRAE thermal envelopes and IEC cooling standards across extreme ambient-temperature swings, adding design headwinds.
Integration Complexity with Legacy DC Estates
Hybrid enterprises struggle to mesh turnkey containers with proprietary power chains and aging building-management systems. A New York financial institution shelved a planned module expansion after learning its legacy BMS required an extra USD 1.2 million middleware layer and six-month integration timeline. Pre-wired leaf-spine fabrics bundled in containers often conflict with entrenched three-tier networks, forcing costly rewiring or manual bridging. Data-residency rules such as GDPR compound the friction by limiting workload mobility across jurisdictional boundaries. Collectively, these hurdles temper enterprise conversion rates even as technology matures.
*Our forecasts treat driver/restraint impacts as directional, not additive. The impact forecasts reflect baseline growth, mix effects, and variable interactions.
Segment Analysis
By Container Size: Urban Demand Favors Compact Footprints
The 40-foot class retained 52.16% share of the containerized data center market in 2025, reflecting buyer preference for higher rack counts that drive unit economics at colocation campuses. Typical 14-16 rack layouts deliver up to 200 kW of IT load, making them a plug-and-play substitute for greenfield halls. Growth momentum is shifting toward 20-foot models that log an 18.43% CAGR, particularly in telecom and edge deployments where zoning codes constrain height and floor area. Singapore’s industrial master-planner has already mandated 20-foot form factors across new edge nodes located inside dense manufacturing estates.
Demand for bespoke modules above 40 feet remains experimental but illustrates how the containerized data center market adapts to workloads exceeding 100 kW per rack. Microsoft’s 60-foot immersion-cooled pilot in Arizona demonstrates the envelope can stretch without abandoning ISO framing altogether. However, over-dimensional loads trigger road-transport permits that inflate delivery cost by up to 50%, an offset many buyers weigh against density gains. Global adherence to ISO 668 freight standards keeps the supply chain fluid, letting buyers source modules in Asia and deploy them in North America with minimal re-certification delays.


By Component Module: Power Leads the Next Upgrade Cycle
IT modules commanded 41.47% of the market share in 2025, underscoring a compute-first procurement mindset. Yet power infrastructure is the fastest growing piece of the containerized data center market, advancing at an 18.35% CAGR as operators chase grid independence and resilience. Oklo’s micro-reactor supplying a 15 MW Idaho site shows how small modular reactors sidestep utility curtailments while slashing peak-demand charges. Parallel traction in liquid-cooling lines is lifting dedicated cooling-module sales, with Vertiv’s immersion system hitting a 1.03 PUE in Sweden and trimming annual energy spend by USD 420,000.
Monitoring and management skus, while a smaller pool, carry strategic weight because ISO 50001 energy-management and IEC 62443 cybersecurity frameworks oblige real-time telemetry and secure access. Vendors that package these controls within the shipping envelope reduce integration risk and win preference in regulated verticals. The shift from compute-centric to infrastructure-centric buying reinforces supplier investments in power and cooling, critical for sustaining the containerized data center market size trajectory over the forecast horizon.
By Tier Type: Mission-Critical Loads Drive Tier 4 Uptake
Tier 3 balanced 99.982% uptime with capital prudence and held 51.62% of the market share in 2025. Colocation and cloud providers leaned on this tier to satisfy general workload needs while keeping redundant feeds moderate. Financial services, healthcare, and government bodies, however, are accelerating Tier 4 adoption, propelling an 18.85% CAGR. A European bank’s six-module Tier 4 build in Frankfurt showcased dual utility lines plus N+1 generator layers to meet millisecond trading SLAs.
Tier 1 and Tier 2 installations stay relevant for dev-test and disaster recovery where downtime risk is tolerable, yet their share continues to erode. Strict adherence to NFPA 70 and Uptime Institute certification adds four-to-six weeks of engineering validation to Tier 4 projects, but operators accept the premium in exchange for audit-ready documentation. As AI inference migrates into regulated industries, Tier 4 is poised to weigh more heavily in the containerized data center market mix.
By Data Center Size: Hyperscalers Extend Footprints at the Edge
Large facilities between 10,000 sq ft and 100,000 sq ft delivered 50.84% of the market share in 2025, with colocation brands favoring modular blocks to align capex release with sell-out velocity. Hyperscale nodes are the fastest riser at 18.57% CAGR, reflecting the cloud majors’ move to distribute compute closer to devices without replicating full-scale campuses. Amazon Web Services commissioned containerized edge nodes across twelve metros to feed Outposts customers inside telecom exchanges and customer premises.
Small and mid-size footprints still matter for enterprises navigating hybrid cloud mandates that mix on-prem with regional edge. Power-density leaps to 100 kW per rack are forcing re-architectures, stimulating vendor R&D in high-efficiency cooling packages. These shifts signal continued growth for the containerized data center market as density demands rise.
By Data Center Type: Colocation Dominates, Hyperscalers Accelerate
Colocation retained 53.77% share in 2025 because operators repurposed crypto-mining sites into AI-ready capacity, monetizing stranded power faster than grid planners could reallocate loads. Crusoe’s 84 MW flip of 14 mining farms illustrated how containers can redeploy energy infrastructure that would otherwise sit idle. Hyperscalers, expanding at 18.72% CAGR, embed 20-foot or 40-foot pods into edge points-of-presence to hit <10 ms latency for autonomous vehicles and real-time analytics.
Enterprises use modular units to enforce data sovereignty and latency control. Siemens-operated factories leveraged on-site edge compute to trim unplanned downtime by 28%. Strict adherence to GDPR, HIPAA, and PCI-DSS influences design choices, pushing vendors to pre-certify security and compliance frameworks inside the shipping envelope.
Geography Analysis
North America captured 40.93% of the market share in 2025, anchored by Northern Virginia where containerized modules help bypass multi-year grid queues while tapping existing substations. Digital Realty brought 18 MW online across three campuses during 2025 by using brownfield parcels, a playbook now extending into Texas and Ohio. Hyperscalers also planted modular edge nodes in Toronto, Montreal, and Mexico City to satisfy in-country data rules without sacrificing latency. State-level incentives, including sales-tax rebates on IT equipment, trim effective capex and reinforce regional leadership.
Asia-Pacific is the fastest-growing geography, advancing at an 18.91% CAGR through 2031. Singapore’s sovereign-AI push and land scarcity led JTC to contract twelve containerized edge nodes in industrial estates, each pairing two 20-foot GPU pods with liquid cooling for semiconductor quality control. India’s Tier-2 cities such as Pune and Chennai saw Yotta deploy 12 MW of modular capacity aimed at domestic cloud demand. China’s tier-1 permitting freeze is redirecting investments to interior provinces that offer cheap land and renewable energy, accelerating container uptake. Australia’s co-location of pods with solar and wind farms signals a path toward grid-independent green compute.
Europe ended 2025 with roughly 28% global share as Germany, France, and the Netherlands juggled strict energy directives and land constraints. Frankfurt’s and Amsterdam’s permit freezes channeled deployments into adjacent municipalities where pre-zoned industrial parcels welcome plug-and-play modules. The United Kingdom’s focus on smart-city digital twins is spawning 20-foot pod deployments tucked into streetside cabinets and utility easements. South America, the Middle East, and Africa remain nascent yet promising: Brazil’s data-sovereignty law, Saudi Arabia’s NEOM megaproject, and South Africa’s unreliable grid jointly open doors for off-grid modular builds powered by renewables and batteries. Uniform enforcement of IEC 61000 and local environmental norms shapes container design choices across all continents.

Competitive Landscape
The containerized data center market is fragmented with players such as Vertiv, Schneider Electric, Huawei and others. Leaders differentiate through vertical integration, bundling IT, power, cooling, and monitoring into turnkey contracts that shorten procurement cycles and reduce multi-vendor risk. Schneider’s EcoStruxure platform illustrates the trend, offering factory acceptance, remote monitoring, and predictive analytics that drop commissioning errors by 63%.
White-space opportunities center on AI training clusters with rack power exceeding 100 kW. Vertiv, Stulz, and Rittal are racing to commercialize immersion-cooled containers capable of supporting such density at sub-500 kW scale, fetching premium margins from hyperscalers. Disruptors like Crusoe Energy convert stranded crypto-mining power into modular AI capacity, an arbitrage that added 84 MW of supply in 2025. Partnerships with small modular reactor firms such as Oklo aim to power data centers entirely off the grid, delivering resilience and bypassing permitting chokepoints.
Regulatory certification has emerged as a competitive moat. Vendors now routinely pursue Uptime Institute Tier, ISO 50001 energy-management, and IEC 62443 cybersecurity validations to qualify for enterprise and government tenders. Those unable to produce third-party attestations risk disqualification, reinforcing the importance of compliance engineering in product roadmaps. Continuous innovation and region-specific customization ensure that the containerized data center market remains dynamic, with new entrants able to carve niches even as incumbents scale.
Containerized Data Center Industry Leaders
Vertiv Holdings Co
Schneider Electric SE
Huawei Technologies Co Ltd
Dell Technologies Inc
Hewlett Packard Enterprise Co
- *Disclaimer: Major Players sorted in no particular order


Recent Industry Developments
- February 2026: Schneider Electric delivered fifty EcoStruxure Modular Data Center units across North America and Europe, each supporting 30 kW per rack liquid-cooled densities.
- January 2026: Microsoft began pilot operations of 60-foot immersion-cooled containers at its Arizona campus targeting 100 kW per rack.
- December 2025: Oklo completed commissioning of its Aurora microreactor in Idaho to power a containerized data center serving AI workloads.
- November 2025: Digital Realty activated 18 MW of containerized capacity in Northern Virginia using forty-two 40-foot modules.


Global Containerized Data Center Market Report Scope
A containerized data center is primarily defined as a modular data center incorporated into a standard shipping container or similar type of container. The containers are then fabricated with all the necessary components used in a data center, including cooling, power, and racks. The report covers the emerging trends in containerized data center market segmented by type, and end-user across different regions studied.
The Containerized Data Center Market Report is Segmented by Container Size (20-Foot ISO, 40-Foot ISO, and Greater than 40-Foot Custom), Component Module (IT Module, Power Module, Cooling Module, and Monitoring and Management Module), Tier Type (Tier 1 and 2, Tier 3, and Tier 4), Data Center Size (Small Data Center, Medium Data Center, Large Data Center, and Hyperscale Data Center), Data Center Type (Colocation Data Center, Hyperscalers Data Center/CSPs, and Enterprise and Edge Data Center), and Geography (North America, South America, Europe, Asia-Pacific, and Middle East and Africa). The Market Forecasts are Provided in Terms of Value (USD).
By Container Size
| 20-Foot ISO |
| 40-Foot ISO |
| Greater than 40-Foot Custom |
By Component Module
| IT Module |
| Power Module |
| Cooling Module |
| Monitoring and Management Module |
By Tier Type
| Tier 1 and 2 |
| Tier 3 |
| Tier 4 |
By Data Center Size
| Small Data Center |
| Medium Data Center |
| Large Data Center |
| Hyperscale Data Center |
By Data Center Type
| Colocation Data Center |
| Hyperscalers Data Center/CSPs |
| Enterprise and Edge Data Center |
By Geography
| North America | United States | |
| Canada | ||
| Mexico | ||
| South America | Brazil | |
| Argentina | ||
| Chile | ||
| Rest of South America | ||
| Europe | United Kingdom | |
| Germany | ||
| France | ||
| Spain | ||
| Italy | ||
| Rest of Europe | ||
| Asia-Pacific | China | |
| India | ||
| Japan | ||
| Australia | ||
| South Korea | ||
| Rest of Asia-Pacific | ||
| Middle East and Africa | Middle East | Saudi Arabia |
| United Arab Emirates | ||
| Turkey | ||
| Rest of Middle East | ||
| Africa | South Africa | |
| Nigeria | ||
| Egypt | ||
| Rest of Africa | ||
| By Container Size | 20-Foot ISO | ||
| 40-Foot ISO | |||
| Greater than 40-Foot Custom | |||
| By Component Module | IT Module | ||
| Power Module | |||
| Cooling Module | |||
| Monitoring and Management Module | |||
| By Tier Type | Tier 1 and 2 | ||
| Tier 3 | |||
| Tier 4 | |||
| By Data Center Size | Small Data Center | ||
| Medium Data Center | |||
| Large Data Center | |||
| Hyperscale Data Center | |||
| By Data Center Type | Colocation Data Center | ||
| Hyperscalers Data Center/CSPs | |||
| Enterprise and Edge Data Center | |||
| By Geography | North America | United States | |
| Canada | |||
| Mexico | |||
| South America | Brazil | ||
| Argentina | |||
| Chile | |||
| Rest of South America | |||
| Europe | United Kingdom | ||
| Germany | |||
| France | |||
| Spain | |||
| Italy | |||
| Rest of Europe | |||
| Asia-Pacific | China | ||
| India | |||
| Japan | |||
| Australia | |||
| South Korea | |||
| Rest of Asia-Pacific | |||
| Middle East and Africa | Middle East | Saudi Arabia | |
| United Arab Emirates | |||
| Turkey | |||
| Rest of Middle East | |||
| Africa | South Africa | ||
| Nigeria | |||
| Egypt | |||
| Rest of Africa | |||


Key Questions Answered in the Report
How fast is the containerized data center market expected to grow over 2026-2031?
The market is forecast to register a 17.99% CAGR between 2026 and 2031, expanding from USD 20.19 billion in 2026 to USD 46.16 billion by 2031.
Which region will see the highest growth in containerized deployments?
Asia-Pacific leads with an expected 18.91% CAGR to 2031, propelled by sovereign-AI mandates, telecom edge rollouts, and hyperscale expansion across India, Singapore, and Japan.
What is driving adoption among hyperscalers?
Hyperscale cloud providers integrate containers at edge points-of-presence to hit sub-10 ms latency targets while avoiding long construction timelines and grid interconnection delays.
Why are power modules the fastest-growing component segment?
Operators seek grid independence and higher energy efficiency, spurring demand for power modules that integrate battery storage or small modular reactors, growing at an 18.35% CAGR.
How do containerized data centers improve energy efficiency?
Factory-built modules achieve PUE values as low as 1.15 by optimizing airflow and integrating high-efficiency cooling, lowering seven-year total cost of ownership by roughly 22% versus legacy builds.
What limits wider deployment in legacy enterprise estates?
Integration hurdles with older power chains and building-management systems, plus compliance with data-residency rules, can add significant cost and time, tempering short-term enterprise adoption.
Page last updated on:


