Quy mô thị trường dầu nhờn Nhật Bản
|
|
Giai Đoạn Nghiên Cứu | 2015 - 2026 |
|
|
Thể Tích Thị Trường (2024) | 1.93 Tỷ lít |
|
|
Thể Tích Thị Trường (2026) | 1.81 Tỷ lít |
|
|
Thị phần lớn nhất theo người dùng cuối | ô tô |
|
|
CAGR (2024 - 2026) | 1.97 % |
|
|
Tăng trưởng nhanh nhất theo người dùng cuối | Sản xuất điện |
|
|
Tập Trung Thị Trường | Cao |
Các bên chính |
||
|
|
||
|
* Tuyên bố miễn trừ trách nhiệm: Các Công Ty Thành Công và Quan Trọng được sắp xếp không theo yêu cầu cụ thể nào |
Phân tích thị trường dầu nhớt Nhật Bản
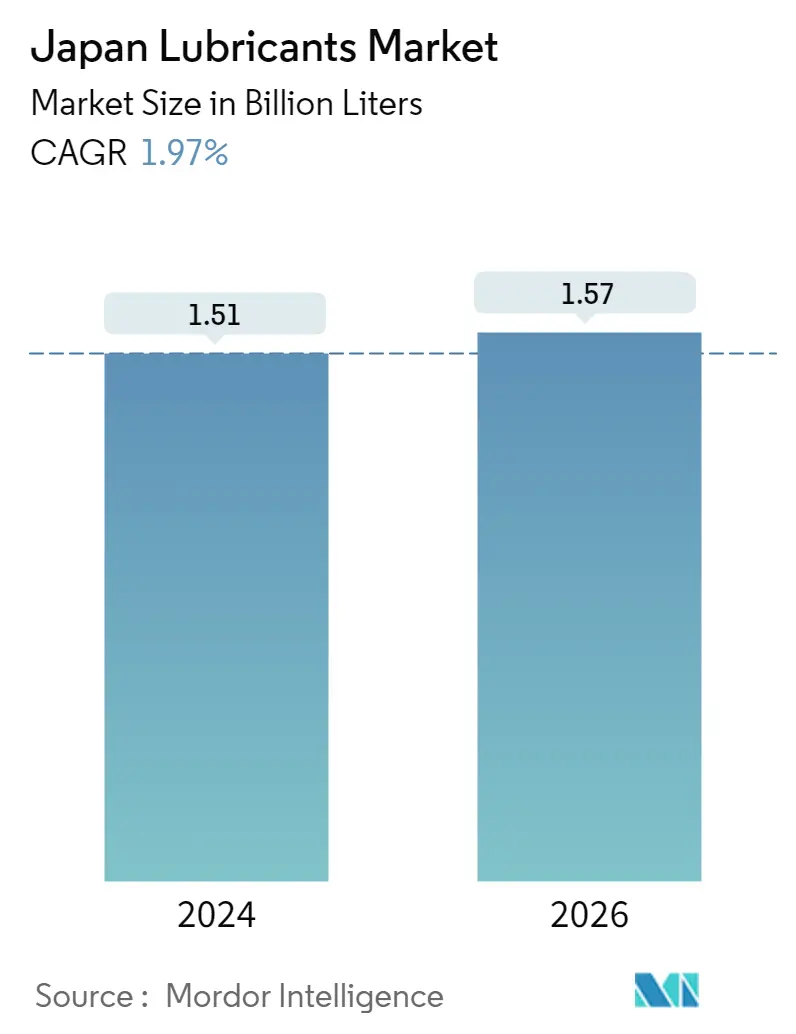
Quy mô Thị trường Dầu nhờn Nhật Bản ước tính là 1,51 tỷ Lít vào năm 2024 và dự kiến sẽ đạt 1,57 tỷ Lít vào năm 2026, tăng trưởng với tốc độ CAGR là 1,97% trong giai đoạn dự báo (2024-2026).
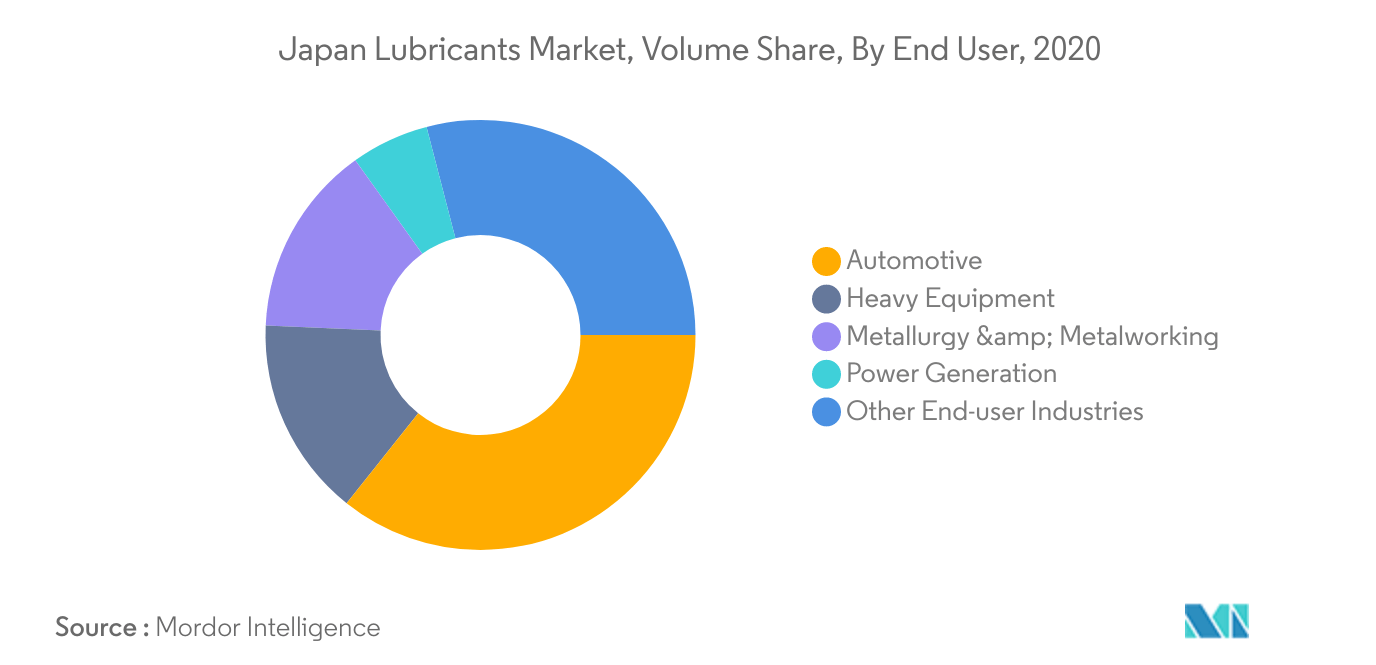
- Phân khúc lớn nhất theo ngành người dùng cuối - Ô tô Trong số các phân khúc sử dụng cuối cùng, ô tô là phân khúc lớn nhất do tỷ lệ sử dụng dầu động cơ và hộp số trong xe cơ giới cao so với các ứng dụng công nghiệp khác.
- Phân khúc nhanh nhất theo ngành của người dùng cuối - Sản xuất điện Sản xuất điện có thể là ngành sử dụng dầu bôi trơn cuối cùng tăng trưởng nhanh nhất ở Nhật Bản do việc sử dụng các lò phản ứng khí tự nhiên và tua-bin gió để sản xuất năng lượng ngày càng tăng.
- Phân khúc lớn nhất theo loại sản phẩm - Dầu động cơ Do kích thước động cơ của ô tô, xe tải và xe buýt khác nhau cũng như tần suất thay dầu cao, dầu động cơ là loại sản phẩm được sử dụng rộng rãi nhất ở Nhật Bản.
- Phân khúc nhanh nhất theo loại sản phẩm - Dầu thủy lực Dầu thủy lực được sử dụng trong xây dựng, khai thác mỏ, thép, hàng hải hàng không và mức tiêu thụ chúng được dự đoán sẽ tăng nhanh hơn khi các hoạt động gia tăng trong các lĩnh vực này.
Phân khúc lớn nhất theo người dùng cuối Ô tô
- Năm 2020, thị trường dầu nhớt Nhật Bản do ngành công nghiệp ô tô thống trị, chiếm khoảng 36% tổng lượng dầu nhớt tiêu thụ. Trong giai đoạn 2015-2019, mức tiêu thụ dầu nhờn trong ngành ô tô giảm khoảng 10% do sản lượng xe và tỷ lệ sử dụng trì trệ.
- Vào năm 2020, các hạn chế liên quan đến COVID-19 đã khiến yêu cầu bảo trì của một số ngành bị giảm sút. Tác động lớn nhất được quan sát thấy ở ngành công nghiệp ô tô, với mức giảm 12,6%, tiếp theo là thiết bị nặng (10,1%).
- Sản xuất điện có thể là ngành công nghiệp dành cho người dùng cuối tăng trưởng nhanh nhất trên thị trường được nghiên cứu, với tốc độ CAGR là 3,92% trong giai đoạn 2021-2026, tiếp theo là luyện kim và gia công kim loại (2,09%). Công suất phát điện ngày càng tăng trong nước có thể sẽ thúc đẩy việc tiêu thụ chất bôi trơn trong công suất phát điện.
Tổng quan về ngành dầu nhớt Nhật Bản
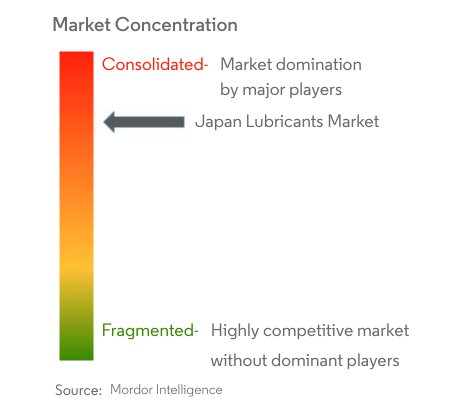
Thị trường Dầu nhờn Nhật Bản khá hợp nhất, với 5 công ty hàng đầu chiếm 83,34%. Các công ty lớn trong thị trường này là Cosmo Energy Holdings Co. Ltd, ENEOS Corporation, ExxonMobil Corporation, Idemitsu Kosan Co. Ltd và Royal Dutch Shell Plc (được sắp xếp theo thứ tự bảng chữ cái).
Dẫn đầu thị trường dầu nhớt Nhật Bản
Cosmo Energy Holdings Co. Ltd
ENEOS Corporation
ExxonMobil Corporation
Idemitsu Kosan Co. Ltd
Royal Dutch Shell Plc
* Tuyên bố miễn trừ trách nhiệm: Các Công Ty Thành Công và Quan Trọng được sắp xếp không theo yêu cầu cụ thể nào
Tin tức thị trường dầu nhớt Nhật Bản
- Tháng 3 năm 2022 Công ty ExxonMobil Corporation đã bổ nhiệm Jay Hooley làm giám đốc điều hành chính của công ty.
- Tháng 1 năm 2022 Có hiệu lực từ ngày 1 tháng 4, Tập đoàn ExxonMobil được tổ chức theo ba ngành nghề kinh doanh - Công ty thượng nguồn ExxonMobil, Giải pháp sản phẩm ExxonMobil và Giải pháp cácbon thấp ExxonMobil.
- Tháng 1 năm 2022 Có hiệu lực từ ngày 21 tháng 1 năm 2022, Royal Dutch Shell plc đổi tên thành Shell plc.
Báo cáo thị trường dầu nhớt Nhật Bản - Mục lục
1. Tóm tắt điều hành & những phát hiện chính
2. Giới thiệu
- 2.1 Giả định nghiên cứu & Định nghĩa thị trường
- 2.2 Phạm vi nghiên cứu
- 2.3 Phương pháp nghiên cứu
3. Xu hướng ngành chính
- 3.1 Xu hướng công nghiệp ô tô
- 3.2 Xu hướng ngành sản xuất
- 3.3 Xu hướng ngành phát điện
- 3.4 Khung pháp lý
- 3.5 Phân tích chuỗi giá trị và kênh phân phối
4. Phân khúc thị trường
-
4.1 Bởi người dùng cuối
- 4.1.1 ô tô
- 4.1.2 Thiết bị nặng
- 4.1.3 Luyện kim & Gia công kim loại
- 4.1.4 Sản xuất điện
- 4.1.5 Các ngành người dùng cuối khác
-
4.2 Theo loại sản phẩm
- 4.2.1 Dầu động cơ
- 4.2.2 Mỡ
- 4.2.3 Chất lỏng thủy lực
- 4.2.4 Chất lỏng gia công kim loại
- 4.2.5 Dầu hộp số & hộp số
- 4.2.6 Các loại sản phẩm khác
5. Bối cảnh cạnh tranh
- 5.1 Những bước đi chiến lược quan trọng
- 5.2 Phân tích thị phần
-
5.3 Hồ sơ công ty
- 5.3.1 BP Plc (Castrol)
- 5.3.2 Cosmo Energy Holdings Co. Ltd
- 5.3.3 ENEOS Corporation
- 5.3.4 ExxonMobil Corporation
- 5.3.5 FUCHS
- 5.3.6 Idemitsu Kosan Co. Ltd
- 5.3.7 Japan Sun Oil Company Ltd (SUNOCO Inc.)
- 5.3.8 MITASU OIL CORPORATION
- 5.3.9 Royal Dutch Shell Plc
- 5.3.10 Yushiro Chemical Industry Co. Ltd
6. ruột thừa
- 6.1 Phụ lục-1 Tài liệu tham khảo
- 6.2 Phụ lục-2 Danh sách bảng và hình
7. Các câu hỏi chiến lược quan trọng dành cho CEO ngành dầu nhờn
Phân khúc ngành dầu nhớt Nhật Bản
| ô tô |
| Thiết bị nặng |
| Luyện kim & Gia công kim loại |
| Sản xuất điện |
| Các ngành người dùng cuối khác |
| Dầu động cơ |
| Mỡ |
| Chất lỏng thủy lực |
| Chất lỏng gia công kim loại |
| Dầu hộp số & hộp số |
| Các loại sản phẩm khác |
| Bởi người dùng cuối | ô tô |
| Thiết bị nặng | |
| Luyện kim & Gia công kim loại | |
| Sản xuất điện | |
| Các ngành người dùng cuối khác | |
| Theo loại sản phẩm | Dầu động cơ |
| Mỡ | |
| Chất lỏng thủy lực | |
| Chất lỏng gia công kim loại | |
| Dầu hộp số & hộp số | |
| Các loại sản phẩm khác |
Định nghĩa thị trường
- Các loại phương tiện và thiết bị công nghiệp - Ô tô (Phương tiện chở khách, Xe thương mại và Xe máy), Sản xuất điện, Thiết bị nặng, Luyện kim Gia công kim loại và các ngành công nghiệp người dùng cuối khác (Hàng hải, Hàng không, v.v.) được xem xét trong thị trường dầu nhờn.
- Loại sản phẩm - Với mục đích của nghiên cứu này, các sản phẩm bôi trơn như dầu động cơ, dầu truyền động và bánh răng, chất lỏng thủy lực, chất lỏng gia công kim loại và mỡ bôi trơn đều được xem xét.
- Nạp tiền dịch vụ - Theo nghiên cứu, việc bổ sung dịch vụ/bảo trì được xem xét khi tính toán mức tiêu thụ dầu nhờn cho từng phương tiện và thiết bị.
- Nhà máy điền - Nghiên cứu này đang xem xét việc bổ sung chất bôi trơn đầu tiên cho các phương tiện và thiết bị công nghiệp mới sản xuất.
Phương Pháp Nghiên Cứu
Mordor Intelligence tuân theo một phương pháp bốn bước trong tất cả các báo cáo của chúng tôi.
- Bước 1: Xác định Biến Khóa: Các biến khóa có thể đo lường (ngành công nghiệp và ngoài) liên quan đến phân đoạn sản phẩm cụ thể và quốc gia được chọn từ một nhóm các biến và yếu tố liên quan dựa trên nghiên cứu bàn và đánh giá văn học; cùng với các đầu vào chuyên gia chính. Những biến này được xác nhận thêm thông qua mô hình hồi quy (nếu cần).
- Bước 2: Xây dựng Mô hình Thị trường: Để xây dựng một phương pháp dự báo mạnh mẽ, các biến và yếu tố được xác định trong Bước 1 được kiểm tra đối với các con số thị trường lịch sử có sẵn. Thông qua một quá trình lặp lại, các biến cần thiết cho dự báo thị trường được đặt và mô hình được xây dựng dựa trên các biến này.
- Bước 3: Xác nhận và Hoàn thành: Trong bước quan trọng này, tất cả các con số thị trường, biến số và cuộc gọi của các nhà phân tích được xác nhận thông qua một mạng lưới rộng lớn các chuyên gia nghiên cứu chính thống từ thị trường nghiên cứu. Các người tham gia được chọn trên các cấp độ và chức năng để tạo ra một bức tranh toàn diện về thị trường nghiên cứu.
- Bước 4: Đầu ra Nghiên cứu: Báo cáo hợp tác, Nhiệm vụ Tư vấn Tùy chỉnh, Cơ sở dữ liệu & Nền tảng Đăng ký.


