
Market Overview
| Study Period | 2020 - 2031 |
|---|---|
| Market Volume (2026) | 23.61 Billion liters |
| Market Volume (2031) | 27.95 Billion liters |
| Growth Rate (2026 - 2031) | 3.44 % |
| Fastest Growing Market | Asia Pacific |
| Largest Market | Asia Pacific |
| Market Concentration | Medium |
Major Players *Disclaimer: Major Players sorted in no particular order Image © Mordor Intelligence. Reuse requires attribution under CC BY 4.0. | |
Industrial Lubricants Market Analysis by Mordor Intelligence
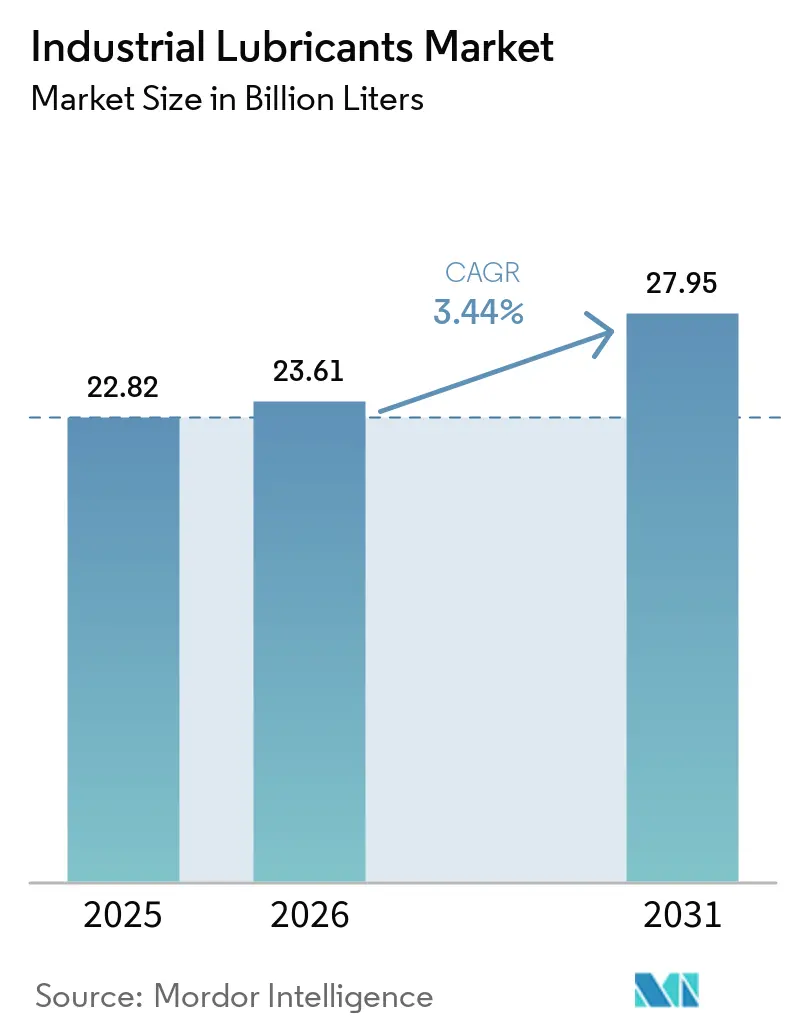
The Industrial Lubricants Market size market is expected to grow from 22.82 billion liters in 2025 to 23.61 billion liters in 2026 and is forecast to reach 27.95 billion liters by 2031 at 3.44% CAGR over 2026-2031. This steady trajectory shows the sector’s shift from bulk commodity sales to tailor-made fluids that maximize equipment uptime and energy efficiency. Rapid wind-turbine installations and Industry 4.0 upgrades are expanding lubricant performance requirements beyond legacy specifications, spurring demand for synthetic and bio-based chemistries. Asia-Pacific dominates current consumption thanks to large-scale manufacturing investments and integrated refinery-petrochemical complexes that capture higher-value lubricant margins. Producers worldwide are also channeling R&D toward PFAS-free additives and condition-monitoring-ready fluids in response to tightening environmental rules and predictive-maintenance adoption.
Key Report Takeaways
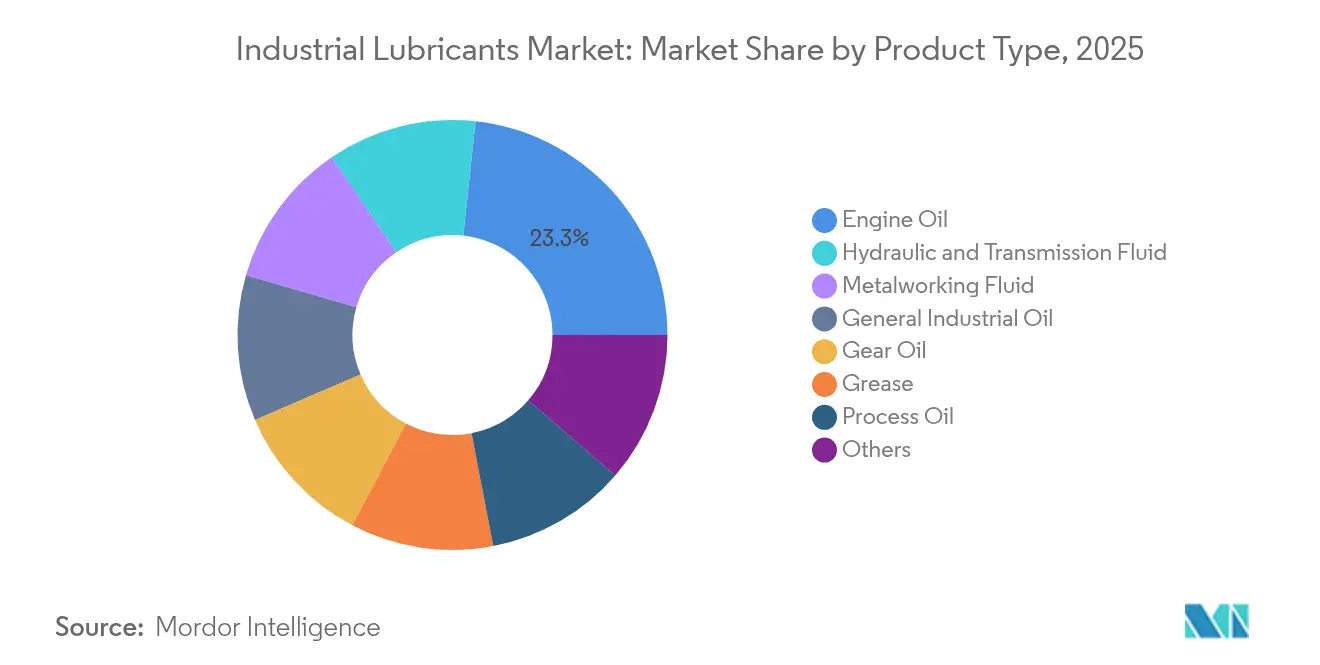
- By product type, engine oil led with 23.29% of the industrial lubricants market share in 2025; hydraulic and transmission fluid is projected to advance at a 3.92% CAGR through 2031.
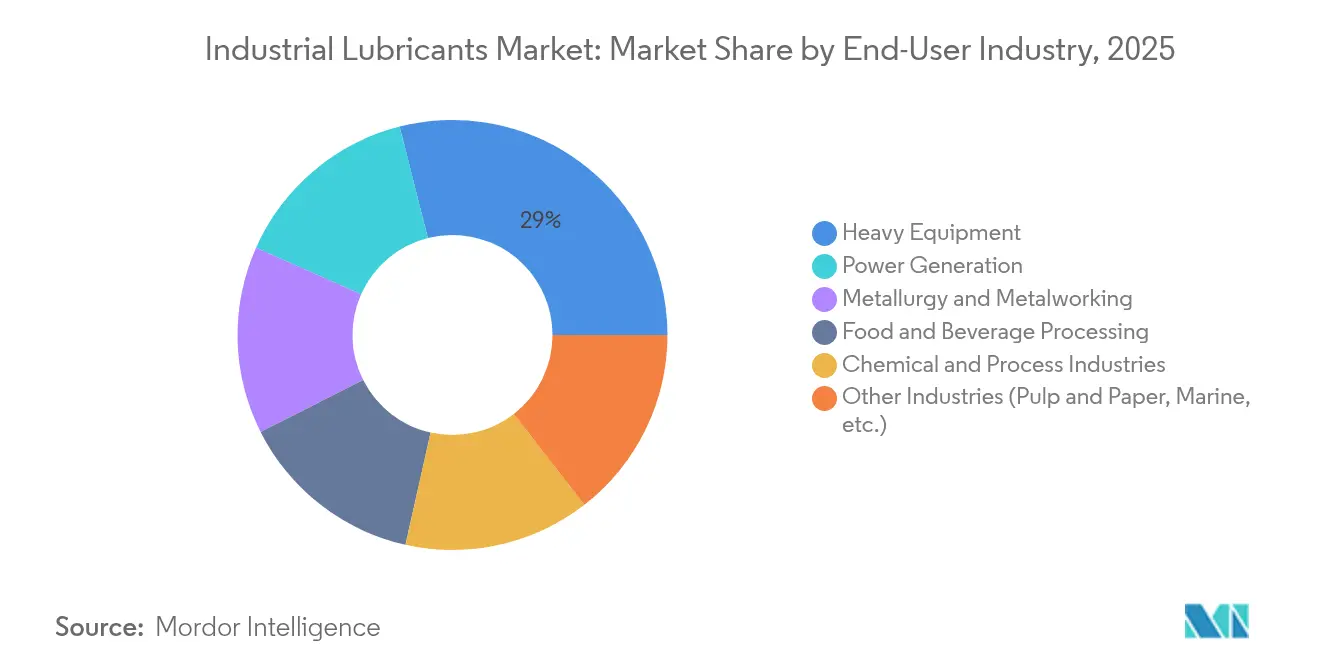
- By end-user industry, heavy equipment accounted for a 28.96% share of the industrial lubricants market size in 2025; power generation is forecast to expand at a 4.27% CAGR through 2031.
- By geography, Asia-Pacific commanded a 46.88% share in 2025 and delivered the fastest regional growth at a 3.61% CAGR to 2031.
Note: Market size and forecast figures in this report are generated using Mordor Intelligence’s proprietary estimation framework, updated with the latest available data and insights as of 2026.
Global Industrial Lubricants Market Trends and Insights
Drivers Impact Analysis*
| Drivers | (~) % Impact on CAGR Forecast | Geographic Relevance | Impact Timeline |
|---|---|---|---|
| Surging wind-turbine gearbox lubricant demand | +0.8% | Global, concentrated in APAC and Europe | Medium term (2-4 years) |
| Industrial automation and Industry 4.0 lubrication intensity | +0.6% | North America & EU, expanding to APAC | Long term (≥ 4 years) |
| Shift toward synthetic and semi-synthetic long-drain oils | +0.5% | Global, led by developed markets | Medium term (2-4 years) |
| Expansion of mining and construction equipment fleets | +0.4% | APAC core, spill-over to MEA and South America | Short term (≤ 2 years) |
| Carbon-pricing pull for ultra-low-friction bio-lubricants | +0.3% | EU & North America, pilot programs in APAC | Long term (≥ 4 years) |
| Source: Mordor Intelligence | |||


Surging Wind-Turbine Gearbox Lubricant Demand
Global wind-power build-outs are multiplying specialized gearbox-oil requirements that standard fluids cannot satisfy. China’s installed wind capacity reached 440 GW by December 2023, with many turbine failures traced to lubrication shortcomings. Synthetic oils fortified with anti-wear and corrosion inhibitors extend service intervals from 6 months to 3 years, trimming offshore maintenance costs. Robust water-separation properties are essential because remote turbines must minimize helicopter-based servicing. Developers increasingly specify ISO VG 320-460 PAO blends that preserve viscosity across wide temperature swings, protecting multi-megawatt gearsets during harsh gust events. Each 15-MW offshore turbine can consume over 800 liters per service cycle, so the industrial lubricants market sees a direct volume lift from larger unit ratings.
Industrial Automation and Industry 4.0 Lubrication Intensity
Smart factories deploy precision equipment that runs hotter and faster, demanding fluids with narrow viscosity tolerances and negligible sensor interference. Automated lubrication systems meter doses based on real-time analytics, cutting consumption 30%-40% while boosting uptime. Fluids must keep tribological stability when exposed to magnetic-plug or infrared debris monitoring, so additive solubility and metal-ion content are tightly specified. Artificial-intelligence platforms now adjust formulation recommendations by reading vibration and temperature feeds, pushing suppliers to create modular additive packages for on-site customization. These developments anchor a long-term upward mix shift within the industrial lubricants market toward premium synthetic and hybrid products.
Shift Toward Synthetic and Semi-Synthetic Long-Drain Oils
Industrial maintenance teams facing labor shortages favor oils that last 8,000-12,000 hours compared with 2,000-4,000 hours for mineral grades. Group III and PAO bases deliver oxidation stability that suppresses sludge even at 120 °C sump temperatures. Semi-synthetic industrial oils balance cost and performance, gaining traction in price-sensitive operations such as cement mills and textile plants. Extended drain intervals shrink waste oil volumes by up to 70%, aligning with waste-reduction policies and lowering disposal fees. This transition dovetails with corporate net-zero pledges, further cementing synthetic uptake in the industrial lubricants market.
Expansion of Mining and Construction Equipment Fleets
Infrastructure packages across India, Indonesia, and Gulf states are deploying high-horsepower excavators and haul trucks that operate in abrasive dust and fluctuating climates. OEMs specify zinc-free hydraulic fluids with boosted film strength to comply with Tier 4F emission systems. In open-pit mining, biodegradable greases formulated with calcium sulfonate complexes protect bucket pins that endure 300-ton static loads. Service intervals of 1,000 hours are becoming standard to reduce downtime in remote sites. These heavy-duty demands translate into sustained volume growth for viscosity-grade 46-68 fluids within the industrial lubricants market.
Restraints Impact Analysis*
| Restraints | (~) % Impact on CAGR Forecast | Geographic Relevance | Impact Timeline |
|---|---|---|---|
| Stricter waste-oil and spill regulations | -0.4% | Global, strictest in EU and North America | Short term (≤ 2 years) |
| Crude-derived base-oil price volatility | -0.3% | Global, most impactful in price-sensitive markets | Short term (≤ 2 years) |
| Dry-drive electric motors reducing oil demand | -0.2% | North America & EU, expanding to APAC | Medium term (2-4 years) |
| Source: Mordor Intelligence | |||
Stricter Waste-Oil and Spill Regulations
PFAS-phaseout mandates in the EU and several U.S. states force formulators to redesign long-standing products[1]Ready-Market Online Corp., “The Connection Between PFAS and Industrial Oils: Exploring Sustainable Alternatives,” hai-lu-oil.com. Certification of alternative chemistries slows time-to-market and inflates R&D budgets. At the user level, collection systems must now document cradle-to-grave traceability, lifting disposal costs and capital outlays for containment. Spill-prevention directives require double-walled tanks and real-time leak alarms, raising infrastructure costs for small workshops. While these hurdles dampen short-term demand, they also open niches for compliant, higher-margin formulations within the industrial lubricants market.
Crude-Derived Base-Oil Price Volatility
Group II and Group III base-stock prices swing with refinery outages and geopolitical shocks, compressing blender margins. Buyers resist quarterly price adjustments, prompting suppliers to hedge inventory or renegotiate contracts monthly. Volatility steers some users toward lower-spec fluids, risking premature equipment wear and undercutting lifecycle savings from synthetics. Integrated oil majors counteract volatility by upgrading resid streams, as seen in ExxonMobil’s Singapore project that added 20,000 barrels per day of premium stocks[2]ExxonMobil, “Preparing for 2025: Singapore Refinery’s Latest Milestones,” exxonmobil.com. However, independents without upstream assets face higher working-capital needs.
*Our forecasts treat driver/restraint impacts as directional, not additive. The impact forecasts reflect baseline growth, mix effects, and variable interactions.
Segment Analysis
By Product Type: Engine-Oil Leadership Sustains, Hydraulic Fluids Accelerate
Engine oil contributed 23.29% of 2025 sales, safeguarding critical generators and stationary compressors across heavy industries. This share underscores deep-rooted maintenance routines that favor monograde SAE 40 and 15W-40 multigrades compatible with legacy engines. Yet demand plateaus as OEMs pivot to gas engines with longer drain specifications. Hydraulic and transmission fluids, in contrast, are set to grow at a 3.92% CAGR as robotics, injection-molding machines, and wind-turbine pitch systems expand. Metalworking fluids benefit from Asia-Pacific machine-tool investments, and ionic-liquid cutting oils deliver longer tool life than mineral benchmarks.
Synthetic grease blends incorporating molybdenum disulfide and graphite are grabbing share in extreme-pressure bearings exposed to 200 °C kiln outlets. Meanwhile, demand for process oils ties directly to petrochemical debottlenecking in China, India, and the U.S. Up-and-coming electric-motor cooling oils illustrate how evolving machinery profiles continuously reshape the industrial lubricants market.


By End-User Industry: Heavy Equipment Leads, Power Generation Gains Pace
Heavy equipment retained 28.96% of volumes in 2025, serving construction loaders, surface-mining trucks, and agriculture harvesters that operate in abrasive dust and high-shock cycles. These machines require high-dispersion engine oils and zinc-free hydraulic fluids capable of sustaining 5,000 psi pressures. Power generation ranks as the fastest-growing consumer with a 4.27% CAGR to 2031, spurred by wind-turbine rollouts and gas-engine peaker plants that backstop renewables. Food and beverage processors adopt NSF-H1 fluids that can cost 30% more but mitigate contamination risk, while metal-forming shops keep metal-removal fluids in steady demand. Overall, equipment-longevity goals and grid-expansion projects ensure balanced growth patterns within the industrial lubricants market.
Geography Analysis
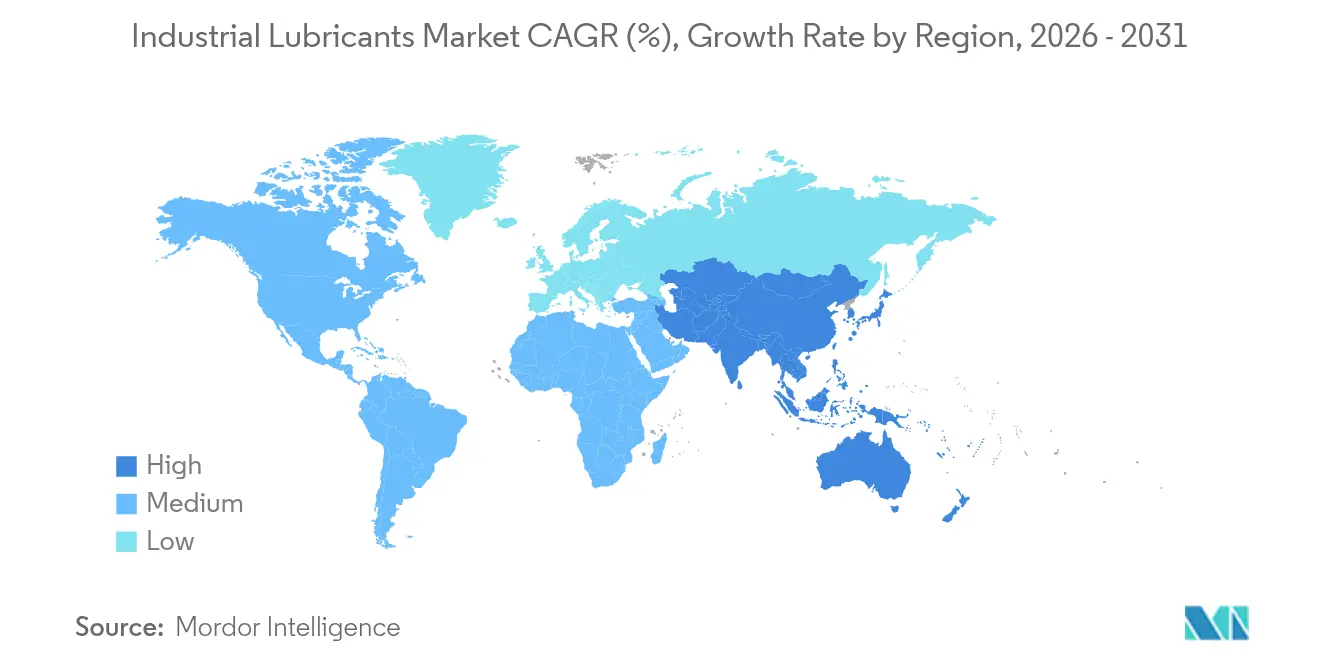
Asia-Pacific accounted for 46.88% of 2025 volumes and is tracking a 3.61% CAGR through 2031, where Chinese refiners integrate chemicals to lift lubricant margins. India draws heavy foreign investment, with Lubrizol earmarking USD 200 million for a new Aurangabad plant that will be its second-largest worldwide. Southeast Asian countries welcome factory relocations and renewable-energy projects, driving hydraulic and gear oil uptake. Japan and South Korea sustain above-average synthetic penetration due to precision manufacturing and stringent energy-saving targets.
North America and Europe concentrate on PFAS-free formulations and carbon-linked efficiency gains. The U.S. leverages shale-derived feedstocks, yet EV adoption gradually curbs traditional engine oil demand. Europe leads the policy push that elevates bio-lubricants, compelling rapid formulation shifts. Canada’s oil-sands mining keeps high-temperature lubricant requirements active, whereas Mexico’s automotive investments broaden local demand.
The Middle-East and Africa rely on hydrocarbon extraction projects that underpin base oil supply and diversify into chemicals. A new additive plant from the Richful–Farabi venture in Saudi Arabia will shorten supply lines for regional blenders. South Africa’s deep-level mining and Nigeria’s refining upgrades contribute niche opportunities. South America shows pockets of high growth around Brazilian petrochemical debottlenecking and Chilean copper expansions, cementing its role as an important albeit smaller outlet for industrial lubricants market suppliers.

Regulatory Landscape
Industrial lubricants are increasingly shaped by chemicals-management and emissions-to-water rules that target persistent substances and require more granular product disclosure. In the European Union, the European Chemicals Agency (ECHA) is evaluating a universal PFAS restriction proposal under REACH, with a stated aim to complete its scientific evaluation by the end of 2026, which gives formulators using fluorinated chemistries in industrial and metalworking applications a clearer compliance planning horizon. Separately, REACH Annex XVII includes the microplastics restriction (Entry 78), which has been in force since 2023 and drives label and safety data sheet information obligations for synthetic polymer microparticles that can appear in some lubricant systems.
Beyond ingredient restrictions, data transparency requirements are moving closer to product-level traceability. Under the EU Ecodesign for Sustainable Products Regulation (ESPR), the European Commission has communicated its intent to establish an online Digital Product Passport (DPP) registry by 19 July 2026, pushing lubricant supply chains toward standardized data capture even where lubricant-specific delegated acts arrive in later waves. In the United States, EPA actions around PFAS are tightening the perimeter for industrial fluids through expanded reporting under the Toxics Release Inventory (TRI) and continued focus on PFAS in water and effluent policy. This is increasing pressure on manufacturers to document substances, manage wastewater interfaces, and accelerate substitution programs where feasible.
Value Chain Analysis
The industrial lubricants value chain runs from crude oil refining and base oil production (Group I/II/III and synthetics) through additive manufacturing, blending, and finished lubricant production, packaging, and multi-tier distribution via direct sales to OEMs and industrial sites, distributors, and service workshops. Base oils typically make up 75% to 98% of a formulation, so supply availability and feedstock economics set the cost and continuity backdrop for blenders. Additives are sourced from a relatively concentrated set of specialized chemical suppliers and can become the limiting input for performance grades.
Recent supply-chain stress has reinforced the need for resilience and formulation flexibility. Industry communications in 2026 highlighted a shortage dynamic in which customer allocation programs and alternative sourcing became more common, with the constraint cited as around 30% of global Group III capacity being offline due to physical damage at facilities in Bahrain, Qatar, and the United Arab Emirates. Refinery optimization that favors diesel and jet fuel over base oil output can also tighten availability, increasing the strategic value of vertical integration and diversified regional sourcing. Large integrated suppliers have responded by adjusting base oil production mix and procuring alternative feedstocks, including ExxonMobil communications in June 2026, while distributors and jobbers increasingly manage substitution, inventory buffering, and last-mile service to keep critical end users supplied.
Competitive Landscape
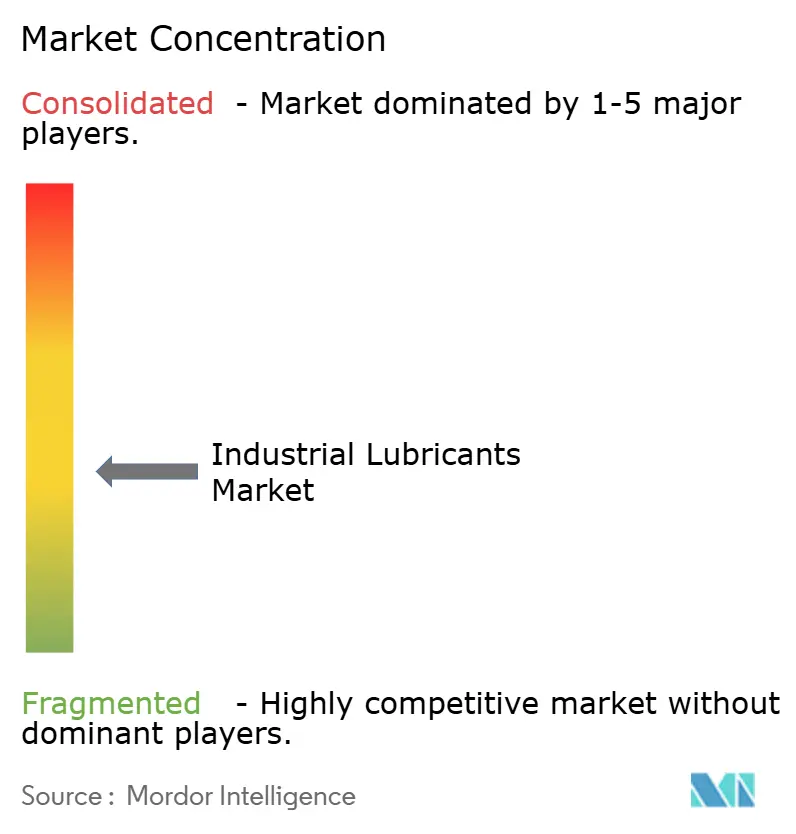
Global leadership remains moderately fragmented. Regional independents capture share through custom formulations and agile technical service, particularly in Asia-Pacific, where proximity reduces lead times. IoT-compatible lubricants and AI-driven blending represent emerging differentiators as users seek lifecycle cost cuts. PFAS-free, biodegradable, and e-mobility thermal fluids form key white-space arenas where newcomers can leapfrog legacy products. Mergers and acquisitions momentum continues, exemplified by Valvoline acquiring Oil Changers for USD 630 million to reinforce downstream channel reach.
Industrial Lubricants Industry Leaders
Shell plc
Exxon Mobil Corporation
BP p.l.c. (Castrol)
Chevron Corporation
TotalEnergies SE
- *Disclaimer: Major Players sorted in no particular order

Market Opportunities and Future Outlook
Opportunities are clustering where suppliers can meet performance demands (long drain, higher temperatures, sensor compatibility) while also addressing compliance pressure, including PFAS scrutiny, microplastics disclosure, and lifecycle data traceability. Industrial buyers implementing Industry 4.0 maintenance practices are creating space for condition-monitoring-ready fluids and modular additive systems that preserve tribological performance without interfering with debris monitoring or sensor diagnostics. In regulated markets, reformulation programs to remove PFAS and reduce reliance on conventional sulfur- and phosphorus-based antiwear packages are pairing with higher documentation needs, making differentiated technical service and compliant product data a competitive lever.
On the supply side, localization of additive and specialty manufacturing, along with premium base stock investments, provides concrete routes to capture higher-margin demand segments. LANXESS inaugurated a lubricant additives blending plant at its Jhagadia, Gujarat site in April 2026, supporting local-for-local supply in one of the fastest-growing consumption regions. DuPont held a groundbreaking in November 2025 for a MOLYKOTE manufacturing plant in Zhangjiagang, China, reinforcing capacity close to Asian industrial end users. Longer-cycle base stock moves, such as Shell's final investment decision to convert the Wesseling (Germany) refinery to Group III base oil production (announced January 2024, targeted for 2028 completion) and ExxonMobil's Group III expansion work at Baytown (Texas), align with an industry pivot toward higher-tier base oils that enable synthetic and long-drain industrial formulations. At the same time, 2026 pricing volatility has re-emphasized procurement strategy as a differentiator.
Recent Industry Developments
- June 2026: Shell renewed its long-standing partnership with BMW M Motorsport at Le Mans 2026 and highlighted R&D work on more sustainable fluid technologies, including a racing lubricant formulated with re-refined base oil. The initiative points to deeper integration of circular base-stock pathways into high-performance formulations, which can support broader credibility for re-refined content across premium lubricant applications.
- July 2025: Shell acquired 100% equity in Raj Petro Specialities Pvt. Ltd. from Brenntag Group, adding specialty oils and waxes such as transformer oils, white oils, petroleum jellies, and waxes to its portfolio. The deal strengthens Shell's position in higher-value specialty segments that serve power transmission, pharmaceuticals, and personal care, improving mix and widening cross-sell opportunities through its lubricants channels.
- January 2024: Shell Lubricants completed the acquisition of the MIDEL and MIVOLT product lines from M&I Materials Ltd in the United Kingdom. Bringing ester-based dielectric fluids into Shell's lubricants portfolio broadens exposure to power and electrification-linked applications where fire-safety and biodegradability attributes are increasingly specified.


Research Methodology Framework and Report Scope
Market Definition and Coverage
For this study, the industrial lubricants market covers lubricants consumed in industrial equipment and processes, and it is sized in liters based on apparent demand across end-use industries and geographies.
Scope exclusions: This sizing excludes automotive-focused finished lubricants and purely captive, non-commercial internal transfers that are not reflected in market sales.
Segmentation Overview
- By Product Type
- Engine Oil
- Hydraulic and Transmission Fluid
- Metalworking Fluid
- General Industrial Oil
- Gear Oil
- Grease
- Process Oil
- Others
- By End-user Industry
- Power Generation
- Heavy Equipment
- Food and Beverage Processing
- Metallurgy and Metalworking
- Chemical and Process Industries
- Other Industries (Pulp and Paper, Marine, etc.)
- By Geography
- Asia-Pacific
- China
- India
- Japan
- South Korea
- Indonesia
- Thailand
- Vietnam
- Malaysia
- Rest of Asia-Pacific
- North America
- United States
- Canada
- Mexico
- Europe
- Germany
- United Kingdom
- France
- Italy
- Spain
- Russia
- Rest of Europe
- South America
- Brazil
- Argentina
- Colombia
- Rest of South America
- Middle-East and Africa
- Saudi Arabia
- United Arab Emirates
- South Africa
- Egypt
- Rest of Middle-East and Africa
- Asia-Pacific
Data Sources, Market Sizing, and Validation
Desk Research
Desk work was used to set the framework for volume demand and to keep assumptions realistic before we moved to modeling. Public and official sources were reviewed for industrial activity and trade signals, such as UN Comtrade for lubricant-related trade flows, World Bank and IMF macro series for manufacturing output indicators, and IEA publications for power and industrial energy context. We also referred to sources such as USGS and national statistical offices where relevant, since heavy industry and metals output can explain swings in metalworking and hydraulic fluid usage.
On the market side, we used company annual reports, investor presentations, and technical literature to understand product families, typical changeout intervals, and where synthetics are gaining share in critical applications. Patent databases helped us track additive and formulation directions that can influence drain intervals and consumption intensity over time. A paid subscription focused on lubricants-specific market information was used selectively to cross-check product taxonomy and to sanity-check regional volume splits. These desk sources are illustrative and not exhaustive, and many other public references were also used for data collection, validation, and clarification.
Primary Interviews and Surveys
Primary work focused on validating how volume moves through key end-use industries, and where reported consumption differs from nameplate capacity or production. We spoke with stakeholders across lubricant supply, distribution, and industrial consumption roles, and we tested assumptions on drain intervals, maintenance practices, and substitution between lubricant types in major regions so gaps from desk findings could be closed with real-world checks.
Distribution of primary research fieldwork respondents
| Company type | Respondent position | Region |
|---|---|---|
| Top tier: 27% | CXOs: 12% | APAC: 47% |
| Mid tier: 53% | Functional/Unit leaders: 31% | EMEA: 34% |
| Smaller Players: 20% | Managers: 57% | Americas: 19% |
Market-Sizing & Forecasting
Sizing started with a top-down reconstruction of lubricant consumption in liters by linking industrial activity to usage intensity, and then rolling it up across regions and end-use industries. Inputs that were treated as key drivers included manufacturing output trends, metal production and metalworking activity, installed base and utilization patterns for heavy equipment, power generation operating profiles that influence turbine and hydraulic oils, and the pace of maintenance interval extension (which changes liters consumed per unit of output).
After the main build, results were corroborated with selective bottom-up approximations, including sampled volume run-rates from distributors, channel checks on product mix, and spot checks using typical changeout volumes and intervals for major equipment types. Where country-level data was thin, gaps were handled through proxy indicators like industrial production indexes and trade flows, followed by adjustments based on expert feedback so the totals stayed consistent with what the market can plausibly absorb.
For forecasting, we leaned on multivariate regression so demand could move with the same macro and industrial variables used in the base year, and then we stress-tested it with scenario analysis around industrial cycles and maintenance behavior shifts. Final growth rates were aligned to consensus expectations gathered from industry respondents, which helped prevent over-reacting to one-off events in any single indicator.
Data Validation & Update Cycle
Validation was done through multiple checks so the final volumes did not rely on one data series or one assumption. We compared modeled totals against independent signals like trade directionality, industrial output movement, and region-level industrial activity patterns, and then large variances were reviewed and reworked before sign-off.
Outliers were flagged for deeper review, and follow-up outreach was triggered when a change in one driver created an unrealistic shift in implied liters per unit of industrial output. Each report is refreshed annually, and interim updates are made when material events occur that can move industrial activity or lubricant usage behavior. Before delivery, we run a fresh pass on the model so clients receive the latest updated view.
Mordor Intelligence's Industrial Lubricants Market Size Measured Against Other Published Estimates
It is normal to see different market sizes for industrial lubricants because publishers do not always measure the same thing in the same unit or for the same end uses. Differences usually come from whether the estimate is value-based or volume-based, the product families included, and how assumptions like drain interval changes are applied over the forecast years.
Some published figures present a revenue number that can also include adjacent lubricant categories and price inflation effects that are not easy to separate. For Mordor Intelligence, this study stays in liters and keeps the count tied to industrial consumption across defined product types and end-use industries, and it is then checked against industrial activity signals and interview-based usage intensity ranges.
Benchmark comparison
| Source | Market Size | Gaps in Research Methodology |
|---|---|---|
| Mordor Intelligence | USD 23.61 B (2026) | |
| Global Consultancy A | USD 58.12 B (2025) | Reported in USD revenue, so the total can move with price assumptions and currency timing, and it may capture a wider set of industrial lubricant revenues beyond a strict liters-based consumption build. |
| Industry Publisher B | USD 76.81 B (2025) | Uses a revenue lens and a longer forecast window, which can embed different inflation and application coverage assumptions, and it does not clearly tie totals back to liters-throughput checks by end-use activity. |
The spread in the table mainly comes from unit choice and scope treatment, since value-based studies can rise even when physical consumption is steady. By keeping the model anchored on observable industrial demand drivers and then confirming the implied consumption intensity through primary checks, our estimate stays traceable to practical variables that can be reviewed and repeated each update cycle.


Key Questions Answered in the Report
How large is the industrial lubricants market in 2026?
Sales reached 23.61 billion liters in 2026, and the industrial lubricants market size is projected to rise to 27.95 billion liters by 2031 at a 3.44% CAGR.
Which region buys the most industrial lubricants?
Asia-Pacific leads with 46.88% of 2025 volume and is still the fastest-growing region.
Which product category grows the quickest?
Hydraulic and transmission fluids will expand at a 3.92% CAGR through 2031 as automation and wind-turbine fleets expand.
Why are synthetic oils gaining share?
They allow 8,000-12,000-hour drain intervals, cut waste oil by up to 70%, and support Industry 4.0 condition monitoring.
How are green policies affecting lubricant demand?
Carbon pricing and PFAS bans encourage bio-based, ultra-low-friction, and PFAS-free formulations, shifting demand toward premium chemistries.
Page last updated on:


 Your data is secure and never sold or shared.


