
Market Overview
| Study Period | 2022 - 2031 |
|---|---|
| Forecast Data Period | 2026 - 2031 |
| Base Year Market Size (2025) | USD 78.49 Billion |
| Market Size (2026) | USD 83.36 Billion |
| Market Size (2031) | USD 112.54 Billion |
| Growth Rate (2026 - 2031) | 6.20 % |
| Market Concentration | Medium |
Major Players
*Disclaimer: Major Players sorted in no particular order Image © Mordor Intelligence. Reuse requires attribution under CC BY 4.0. |
|
Europe Bottled Water Market Analysis by Mordor Intelligence
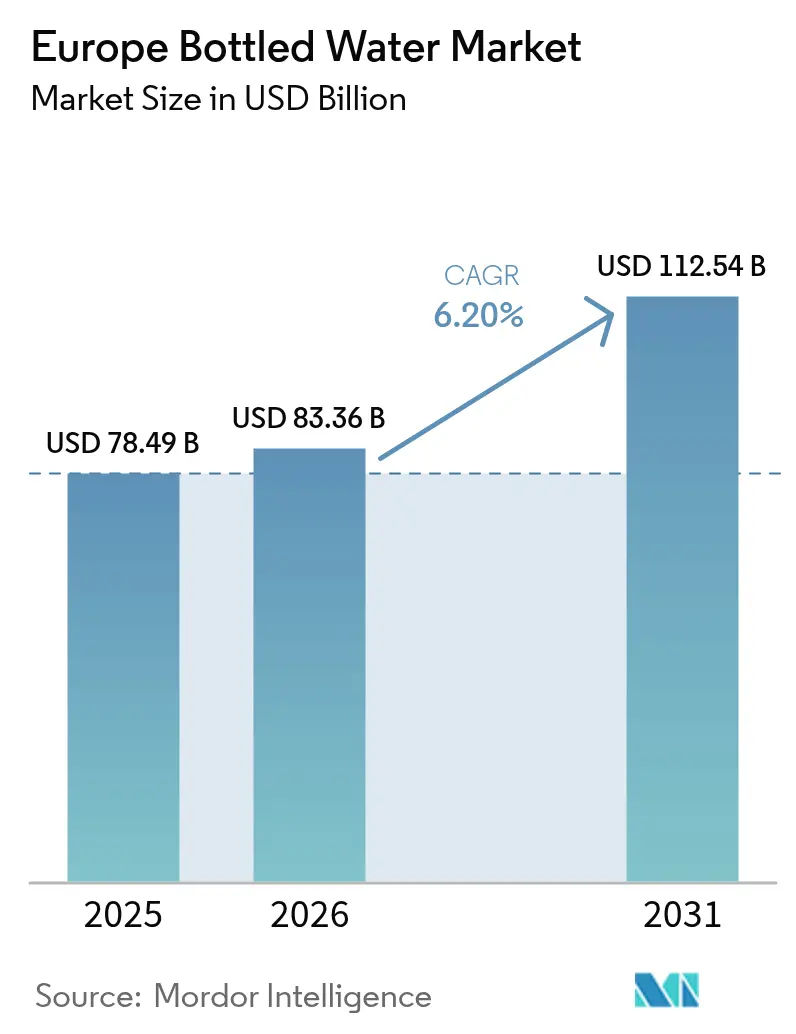
Europe bottled water market size in 2026 is estimated at USD 83.36 billion, growing from 2025 value of USD 78.49 billion with 2031 projections showing USD 112.54 billion, growing at 6.20% CAGR over 2026-2031. Growth reflects a pronounced shift away from sugary beverages toward functional hydration solutions, reinforced by the European Commission’s revised Drinking Water Directive and stronger corporate ESG mandates. Demand concentrates around mineral-rich and electrolyte-enhanced waters, while the EU Single-Use Plastics Directive accelerates rPET adoption and tethered-cap innovation. Deposit-return schemes slated for 2029 reshape collection economics, and smart-packaging technologies such as QR-enabled closures deepen consumer engagement. Competition remains moderate as global majors leverage scale and B-Corp-certified regional players promote provenance and sustainability to differentiate.
Key Report Takeaways
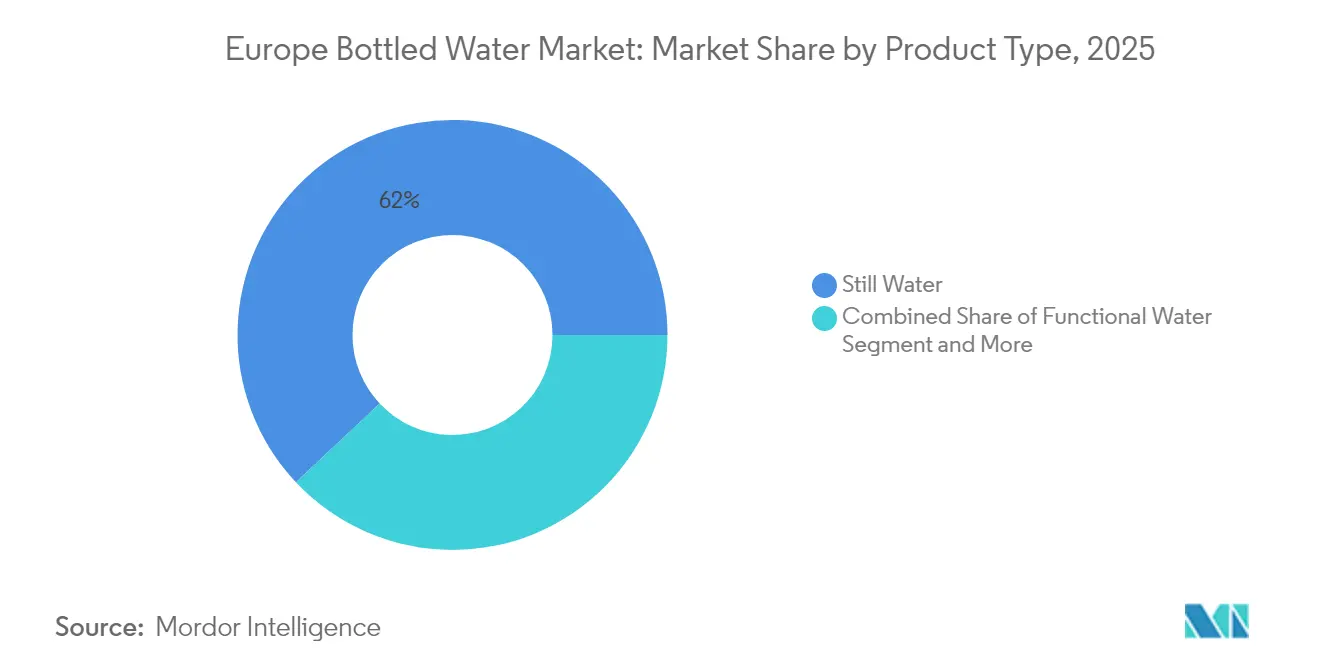
- By product type, Still Water led with 62.02% of the Europe bottled water market share in 2025, whereas Functional Water is advancing at an 8.28% CAGR through 2031.
- By distribution channel, Off-Trade commanded 72.56% share of the Europe bottled water market size in 2025, while On-Trade is recovering at a 6.18% CAGR as hospitality and corporate offices resume full operations.
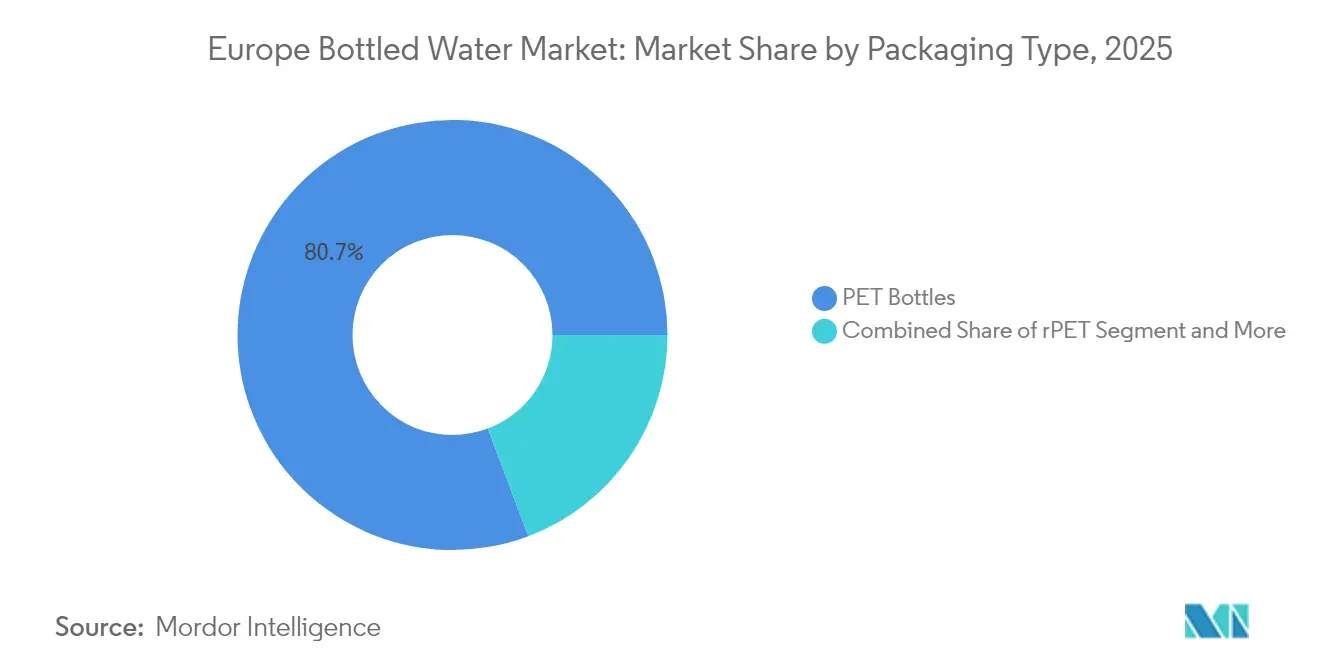
- By packaging material, PET bottles dominated with an 80.74% revenue share in 2025; rPET packaging is projected to grow at a 5.80% CAGR to 2031 under the recycled-content mandates of the EU Single-Use Plastics Directive.
Note: Market size and forecast figures in this report are generated using Mordor Intelligence’s proprietary estimation framework, updated with the latest available data and insights as of 2026.
Europe Bottled Water Market Trends and Insights
Drivers Impact Analysis*
| Driver | ( ~ ) % Impact on CAGR Forecast | Geographic Relevance | Impact Timeline |
|---|---|---|---|
| Health-and-wellness shift from sugary drinks | +1.2% | Nordic states and Germany | Medium term (2-4 years) |
| EU Single-Use Plastics Directive | +0.8% | EU-27, slower in Eastern Europe | Short term (≤ 2 years) |
| Premium mineral & electrolyte waters | +1.5% | Western Europe, expanding Central Europe | Long term (≥ 4 years) |
| Carbon-neutral corporate procurement | +0.9% | London, Paris, Frankfurt, Amsterdam | Medium term (2-4 years) |
| QR/NFC smart packaging | +0.4% | Netherlands, Denmark, Sweden | Long term (≥ 4 years) |
| Gen-Z functional & adaptogenic water | +1.1% | Urban Western and Central Europe | Medium term (2-4 years) |
| Source: Mordor Intelligence | |||


Health-and-Wellness Shift from Sugary Beverages
European dietary guidelines increasingly emphasize water as the primary beverage choice, with the European Commission's Food-Based Dietary Guidelines recommending 1-1.5 liters daily across member states, explicitly favoring water over sugary alternatives. This regulatory endorsement coincides with WHO Europe's 2025 Health Report, highlighting that 1 in 6 people die before age 70 from non-communicable diseases[1]"From cradle to cane: WHO's new European Health Report warns of lifelong health crises across the Region." February 25, 2025. https://www.who.int/europe/news/item/25-02-2025-from-cradle-to-cane--who-s-new-european-health-report-warns-of-lifelong-health-crises-across-the-region, with cardiovascular conditions and cancer as leading causes, driving consumer behavior toward preventive nutrition choices. The shift manifests in corporate wellness programs, with companies like Pernod Ricard launching "Drink More Water" campaigns reaching over 400 million people online and 9 million through events across 60 countries, demonstrating how beverage companies themselves are pivoting toward hydration advocacy. This transition creates sustained demand for premium bottled water, positioning it as a health-forward alternative to traditional soft drinks. Germany's per capita mineral water consumption reached 124.3 liters in 2023, though declining 4.7% from the previous year, indicating market maturation requiring innovation to maintain growth momentum.
EU Single-Use Plastic Directive Accelerating rPET
The EU's Single-Use Plastics Directive mandates 25% recycled content in PET beverage bottles by 2025, escalating to 30% by 2030, with the new Packaging and Packaging Waste Regulation effective February 11, 2025, harmonizing requirements across member states[2]"The New EU Packaging and Packaging Waste Regulation – Highlights and Challenges Ahead." January 23, 2025. https://www.packaginglaw.com/special-focus/new-eu-packaging-and-packaging-waste-regulation-highlights-and-challenges-ahead. Compliance mechanisms vary significantly across member states, with some categorizing requirements per bottle, per producer, or per national output, creating implementation complexity but driving substantial rPET demand. EFSA's updated guidance for post-consumer mechanical PET recycling processes ensures food safety standards while enabling circular economy transitions, with specific contamination level methodologies maintaining bottled water quality integrity. The directive's tethered caps requirement, effective July 2024, initially opposed by major beverage companies, has driven innovation in cap design, including hinged tops and lasso closures, with expectations to prevent 10% of plastic waste on European beaches. Market dynamics show fluctuating rPET demand influenced by economic factors, yet compliance enforcement will create sustained premium pricing for recycled content, fundamentally altering packaging cost structures across the industry.
Premiumization via Mineral-Rich & Electrolyte-Enhanced Waters
EFSA's health claims regulation framework requires scientific substantiation for any nutritional or health claims on bottled water labels, creating barriers to entry while enabling premium positioning for validated formulations[3]"Health claims." July 4, 2024. https://www.efsa.europa.eu/en/topics/topic/health-claims. The regulatory environment supports mineral-rich positioning through natural source differentiation, with companies like Spadel achieving B Corp certification while emphasizing locally-sourced mineral waters within 500 kilometers of source locations. Functional water innovations target specific demographic segments, with EFSA's novel food guidance enabling the introduction of ingredients like glucosyl hesperidin for functional drinks, approved for the general population, including children from 1 year onwards at a maximum of 5.9 mg/kg body weight daily. Premium positioning strategies leverage geographical origin storytelling, with Nestlé's S.Pellegrino and Acqua Panna achieving double-digit growth through strategic investments in demand generation and premium pricing strategies. The premiumization trend aligns with corporate procurement preferences for branded solutions offering comprehensive sustainability documentation, enabling price premiums of 15-25% over commodity bottled water offerings.
Corporate ESG Procurement of Carbon-Neutral Office Water
Corporate sustainability commitments increasingly encompass office water procurement, with companies like Schneider Electric targeting 800 million tonnes of CO2 emissions savings by 2025 through comprehensive supply chain optimization, including beverage procurement decisions. The trend accelerates as organizations pursue Science-Based Targets initiative compliance, requiring measurable emission reductions across scope 3 categories, including purchased goods and services. Hermès' 2023 sustainability report demonstrates local sourcing preferences, with 74% of materials purchased in France and 98% in Europe, indicating regional procurement strategies that favor European bottled water producers over global alternatives. DuPont's water stewardship initiatives, aiming for holistic water strategies at high-risk sites by 2030, illustrate how industrial companies integrate water procurement into broader environmental commitments. This procurement evolution creates opportunities for bottled water producers offering carbon-neutral certification, local sourcing documentation, and comprehensive environmental impact reporting, enabling premium pricing for B2B channels.
Restraints Impact Analysis*
| Restraint | % Impact on CAGR Forecast | Geographic Relevance | Impact Timeline |
|---|---|---|---|
| Environmental Backlash & Refill Culture | -1.8% | Northern Europe leading, spreading to Western Europe | Short term (≤ 2 years) |
| Municipal Tap & Filter Tech Improving Quality Perception | -1.1% | Urban centers with advanced water infrastructure | Medium term (2-4 years) |
| Freight Cost Inflation from EU Carbon Border Adjustment | -0.7% | Import-dependent markets in Eastern and Southern Europe | Short term (≤ 2 years) |
| Subscription Filter Pitchers Cannibalizing Home Consumption | -0.9% | High-income households in Western Europe | Medium term (2-4 years) |
| Source: Mordor Intelligence | |||
Environmental Backlash & Refill Culture
The European Environment Agency's circular economy monitoring reveals only a 11.8% circularity rate in 2023 despite rising environmental awareness, with plastic consumption projected to continue increasing and negatively impacting climate change. Consumer behavior shifts toward refillable alternatives gain momentum through municipal initiatives and environmental campaigns, with the European Commission's "Less Plastic Waste Means Cleaner Beaches" campaign highlighting single-use plastic reduction as a priority environmental objective. The deposit return system mandate for single-use plastic bottles by 2029, requiring 90% collection rates, fundamentally alters consumer convenience calculations by adding return logistics to purchase decisions. Eau de Paris's complaint against PFAS producers demonstrates municipal water authorities' proactive stance on water quality, with PFAS detected in 96% of tested municipalities, creating consumer awareness of tap water contamination issues while simultaneously driving demand for certified pure bottled alternatives. The environmental backlash creates market segmentation between sustainability-conscious consumers who favor refillable solutions, and quality-focused consumers who prioritize purity and convenience, requiring differentiated positioning strategies across demographic segments.
Municipal Tap & Filter Tech Improving Quality Perception
The revised Urban Wastewater Treatment Directive, effective January 1, 2024, mandates stricter nutrient removal and micropollutant monitoring, including microplastics and PFAS, with secondary treatment required for all urban wastewater by 2035 and quaternary treatment for micro-pollutants by 2045. These infrastructure improvements enhance tap water quality perception, particularly in urban centers with advanced treatment facilities, creating competitive pressure on bottled water positioning. The European Commission's new hygiene standards for materials in contact with drinking water, effective December 31, 2026, ensure consistent quality across municipal systems while reducing harmful substance leaching. Nordic countries' implementation of the 2020 EU Drinking Water Directive demonstrates advanced regulatory frameworks, building citizen confidence in municipal water quality, with comprehensive monitoring and compliance reporting systems. However, the PFAS contamination challenge, with detection in 96% of tested municipalities, including Paris, creates ongoing quality perception issues that bottled water producers can leverage through certified purity messaging and comprehensive contamination testing documentation.
*Our forecasts treat driver/restraint impacts as directional, not additive. The impact forecasts reflect baseline growth, mix effects, and variable interactions.
Segment Analysis
By Product Type: Functional Innovation Drives Premium Growth
Still Water generated the highest sales, capturing 62.02% of 2025 revenue as the category of everyday hydration. The Europe bottled water market size for Still Water continues to benefit from entrenched consumption habits, national dietary endorsements, and efficient distribution. Yet saturation in mature economies triggers margin pressure, pushing brands toward flavor extensions and light carbonation variants.
Functional Water, expanding at an 8.28% CAGR through 2031, exemplifies where value migrates. The segment monetizes Gen-Z’s wellness mindset via electrolytes, botanicals, and adaptogens such as ashwagandha. EFSA-approved novel ingredients open regulatory doors, and Pernod Ricard’s global hydration campaign underscores mainstreaming appeal. With most offerings priced at 1.5–2 times plain still water, the Europe bottled water market captures an outsized share of category profit from this niche.


By Distribution Channel: On-Trade Recovery Accelerates
Off-Trade outlets—supermarkets, convenience, and e-commerce—retained 72.56% share in 2025, reflecting price hunting and bulk purchase behavior. The channel's strength reflects European retail consolidation trends and e-commerce penetration, with major retailers leveraging private-label bottled water offerings to capture margin while providing consumer value positioning. Major grocers advance private-label waters, intensifying price competition but maintaining shelf dominance. Subscription e-commerce services boost repeat purchases, especially for 5-liter multi-packs.
The On-Trade channel, forecast at a 6.18% CAGR, rebounds as corporate campuses and hospitality venues reopen. ESG-focused procurement, favoring rPET and local sourcing, reshapes tender criteria. The channel benefits from premium positioning opportunities, as businesses prioritize branded solutions offering comprehensive sustainability documentation and local sourcing credentials. Coca-Cola’s 3% unit-case gain in European water attests to this resurgence. Higher per-liter margins in cafés, hotels, and offices offset lower volumes, providing producers with diversified revenue streams.
By Packaging Material: rPET Transition Gains Momentum
PET bottles dominated with an 80.74% share in 2025 due to manufacturing scale and consumer familiarity. Deposit-refund schemes promise higher recovery rates, safeguarding feedstock and supporting closed-loop ambitions. Major producers invest in PET bottle lightweighting and design optimization to reduce material usage while maintaining structural integrity and brand differentiation capabilities. The European Environment Agency's recycling quality assessment emphasizes closed-loop systems like deposit-refund schemes, yielding the highest recycling quality for PET bottles, supporting continued material preference despite environmental concerns
rPET’s 5.80% CAGR trajectory underscores structural policy support. EFSA contamination-removal metrics give brand owners confidence in using high-post-consumer recycled blends. Early movers such as Spadel already bottle flagship brands in 100% rPET, extracting marketing advantage. As recyclate premiums remain, forward-integration into recycling facilities gains strategic urgency.
Geography Analysis
In 2025, Germany, buoyed by its mineral water traditions and a robust retail network, accounted for 19.27% of the market's value. However, a dip in per-capita consumption signals market maturity. Concerns over water-resource stress, driven by agricultural nitrates and regional overuse, are pushing consumers towards bottled alternatives. Brands emphasizing provenance storytelling and boasting carbon-neutral bottling sites are effectively addressing both quality and climate issues. France, Italy, and Spain, bolstered by tourism and a deep-rooted sparkling-water culture, form a significant cluster in the market. Starting February 2025, harmonized EU packaging regulations will introduce a standardized compliance benchmark, streamlining operations across multiple countries.
Poland, with a projected CAGR of 7.14%, is emblematic of Central Europe's rapid ascent. As disposable incomes rise and retail logistics modernize, premium water is gaining traction. This momentum in Poland is a contributing factor to Coca-Cola HBC's double-digit growth in emerging markets. With EU-aligned packaging regulations in place, local fillers are swiftly scaling their rPET lines. In terms of value, the Netherlands, Switzerland, and Nordic countries stand out, driven by high per-capita spending and a focus on sustainability. The allure of carbon-neutral certification and smart-packaging cues is palpable. With deposit-return systems achieving collection rates exceeding 90%, there's a plentiful supply of high-grade rPET feedstock. Markets on the eastern and southern fringes grapple with freight cost challenges and a lagging infrastructure rollout. However, impending carbon-border adjustments could tilt the scales, making near-shore sourcing more appealing. This shift might prompt multinationals to establish capacities in these regions, seeking relief from tariffs.
Regulatory Landscape
Europe bottled water operates under a layered EU framework that covers source authorization, compositional limits, labeling, and packaging sustainability. Natural mineral water is regulated under Directive 2009/54/EC, with compositional thresholds and permitted treatments (including conditions around ozone-enriched air treatment) set out in Commission Directive 2003/40/EC, which affects how producers substantiate and communicate mineral profiles and purity attributes.
Packaging compliance has become the most time-sensitive regulatory lever. Under the Single-Use Plastics Directive (EU) 2019/904, PET beverage bottles must contain at least 25% recycled content from 2025, alongside the tethered-caps requirement effective July 2024. In June 2026, the European Commission adopted Commission Implementing Decision (EU) 2026/1425, updating the calculation, verification, and reporting methodologies for recycled plastic content, including mass-balance approaches for non-mechanical recycling. This increases the importance of auditable recycled-content accounting and Member State verification for producers and importers.
Value Chain Analysis
The Europe bottled water value chain begins with protected underground sources and permitting, then moves through extraction, on-site bottling, and packaging procurement (preforms, caps, labels) before distribution into off-trade retail (supermarkets, convenience, e-commerce) and on-trade channels (HoReCa, offices). A key structural constraint is that natural mineral water must be bottled at source and is prohibited from chemical disinfection, concentrating manufacturing around springs and increasing the role of source stewardship, quality monitoring, and local logistics.
Downstream, packaging and circularity requirements are increasingly shaping sourcing and costs. Regulation (EU) 2025/40 (Packaging and Packaging Waste Regulation), which entered into force in February 2025 and applies from August 12, 2026, tightens design-for-recycling and extended producer responsibility expectations. Complementing this, Commission Implementing Decision (EU) 2026/1425 (June 2026) standardizes how recycled content is calculated and verified, pushing producers to integrate certified recycled-material procurement, chain-of-custody documentation, and deposit-return scheme interfaces to secure reliable rPET feedstock and compliant reporting.
Competitive Landscape
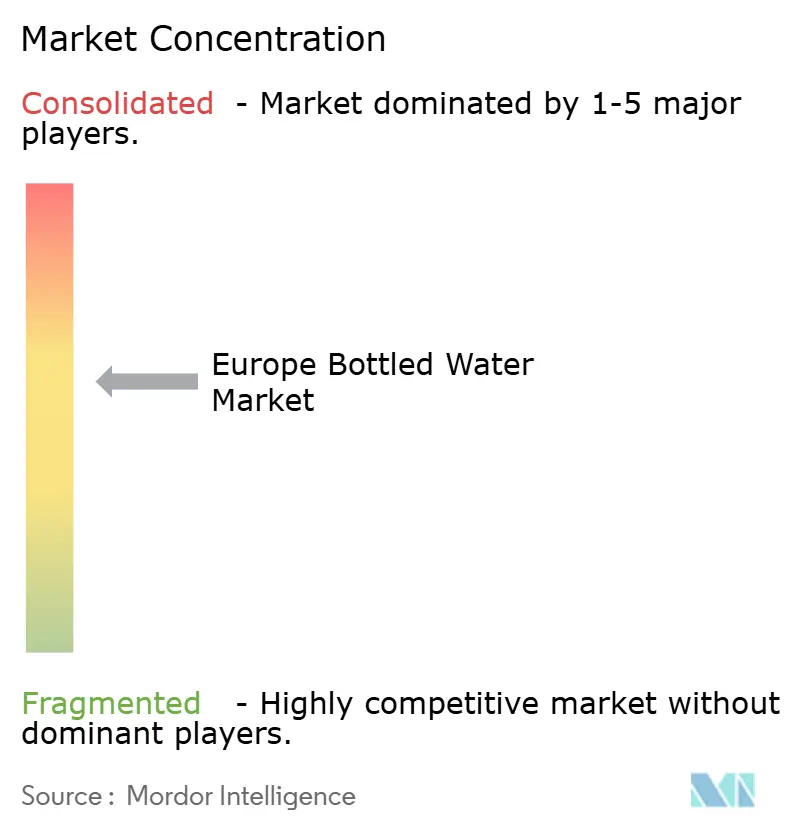
Europe's bottled water market rates a 6 out of 10 on the concentration scale. While Nestlé Waters, Danone, Coca-Cola, PepsiCo, and Spadel dominate the top tier, regional players like Gerolsteiner and Highland Spring carve out loyalty with their unique terroir stories. Danone's Waters division reported Q1 2025 sales of EUR1.16 billion, marking a 4.1% like-for-like growth, underscoring a successful portfolio revamp. Meanwhile, Nestlé benefited from a 3.3% organic growth in Europe in 2024, largely driven by the premium push of S.Pellegrino. Sustainability emerges as the key competitive edge. Spadel, marking a milestone by reaching the billion-liter mark, proudly retains its B-Corp status, a pioneering feat among family-owned bottlers. Investments in technology, like Domino Printing's QR-coded closures, not only authenticate products but also lighten packaging weight. Retail chains' push for private-label expansion intensifies price competition, urging brand owners to either enhance value or validate their low-carbon claims to justify premium pricing.
M&A discussions are buzzing around upstream rPET capacities and local spring acquisitions, a strategic move to secure resources as water-extraction permits tighten. Meanwhile, start-ups tapping into direct-to-consumer avenues and promoting aluminum refill packs hint at a persistent fragmentation trend at the edges of the category.
Europe Bottled Water Industry Leaders
-
Nestle SA
-
The Coca-Cola Company
-
Danone SA
-
PepsiCo, Inc.
-
Spadel SA
- *Disclaimer: Major Players sorted in no particular order

Market Opportunities and Future Outlook
A key opportunity is scaling credible nature and water-stewardship programs at source locations, particularly as scrutiny grows around extraction practices and biodiversity impacts. In March 2026, Natural Mineral Waters Europe (NMWE) launched the Sources for Nature project to pilot IUCN biodiversity recommendations across 17 locations in 10 countries over a two-year period through 2028, giving producers a more structured basis to differentiate around measurable source protection and to reinforce license-to-operate narratives with retailers and corporate buyers.
Packaging compliance and circularity execution also create room across rPET sourcing, verified recycled-content claims, and refill and reuse formats. The Packaging and Packaging Waste Regulation (EU) 2025/40 introduces harmonized recyclability performance grading and reuse or refill targets for beverage distributors (10% by 2030, rising to 40% by 2040). The June 2026 Implementing Decision (EU) 2026/1425 expands accepted recycled-content accounting approaches, including mass balance for non-mechanical recycling. Together, these changes lift demand for traceability investments, food-grade recycled supply partnerships, and packaging redesigns that support deposit-return operations and retailer sustainability scorecards while preserving premium brand cues.
Recent Industry Developments
- May 2026: Coca-Cola HBC announced a EUR 31 million investment to build a new logistics center in Attica, Greece, with completion planned by 2028. The project expands regional warehousing and distribution capacity for high-frequency beverage categories, including packaged water, while improving service levels and transport efficiency.
- April 2026: Danone announced a multi-year investment of more than EUR 20 million to modernize its evian bottling site in France. The upgrade is aimed at reinforcing capacity and operational performance at a flagship natural mineral water asset as packaging and sustainability requirements tighten across European retail and on-trade channels.
- May 2025: Coca-Cola Europacific Partners began a EUR 146 million investment at its Grigny, France, bottling facility, with full operational completion indicated for 2026. The expansion adds high-speed, more flexible production capabilities and supports packaging innovation efforts, influencing competitive intensity in core Western European markets.


Research Methodology Framework and Report Scope
Market Definition and Coverage
For this study, the market covers the value of packaged drinking water sold in bottles across Europe, counted at the point where it is sold through retail and foodservice channels to end consumers.
Scope exclusions: This sizing excludes home and office water delivery in large returnable containers and on-premise filtration or tap-water dispensing systems.
Segmentation Overview
-
By Type
- Still Water
- Sparkling/Carbonated Water
- Flavored Water
- Functional Water
- Others
-
By Distribution Channel
-
Off-trade
- Supermarkets/Hypermarkets
- Convenience Stores
- Online Retail Stores
- Pharmacies & Health Stores
- Others (Vending machines, discounters)
-
On-trade
- Hotels, Restaurants and Cafes (HoReCa)
- Offices & Institutional
- Sports & Leisure Venues
-
Off-trade
-
By Packaging Material
- PET Bottles
- rPET Bottles
- Glass Bottles
- Aluminum Cans & Bottles
- Carton (Tetra Pak)
- Others (Bio-based Plastics)
-
Geography
- United Kingdom
- Germany
- France
- Italy
- Spain
- Russia
- Netherlands
- Poland
- Switzerland
- Sweden
- Norway
- Rest of Europe
Data Sources, Market Sizing, and Validation
Desk Research
Desk work started by aligning what is counted as bottled water across Europe, and then mapping the demand and supply signals that can be tracked year after year. We used public sources such as Eurostat for household spend and price indexes, UN Comtrade for trade flows where relevant, and national statistical offices for consumption and retail indicators.
To keep assumptions realistic, we also reviewed association and regulator publications (such as packaging and recycling compliance updates, deposit-return scheme timelines, and food safety guidance), plus peer reviewed research on hydration and consumer behavior. Company annual reports, investor presentations, and credible press were used to sanity-check mix shifts across still and sparkling formats and packaging materials. A paid subscription for company financials and another for shipment-level trade checks were used selectively to fill gaps where public disclosures were thin. These are illustrative examples only, and many other sources were consulted for data collection, validation, and clarification.
Primary Interviews and Surveys
Primary work focused on cross-checking the model inputs with people who see the market in daily operations, including brand owners, bottlers, packaging suppliers, distributors, and retail channel specialists. We also spoke with category managers and logistics-facing roles to validate pricing moves, promotion intensity, and country-level demand differences, and then used that feedback to adjust assumptions that could not be reliably observed in public datasets.
Distribution of primary research fieldwork respondents
| Company type | Respondent position |
|---|---|
| Top tier: 38% | CXOs: 14% |
| Mid tier: 40% | Functional/Unit leaders: 39% |
| Smaller Players: 22% | Managers: 47% |
Market-Sizing & Forecasting
The core build uses a top-down approach where country consumption and spend indicators are reconstructed into bottled-water value, and then rolled up to the Europe total after aligning definitions and currency timing. To keep that total grounded, we corroborated it with selective bottom-up approximations, such as sampled price per liter by channel, packaging mix checks, and a limited roll-up of visible supplier revenues where disclosures allow.
A few practical inputs that shaped the model include per-capita bottled water consumption trends, share of still versus sparkling, observed price per liter movement, shift toward functional or flavored variants, and packaging changes such as PET versus rPET adoption tied to policy timelines. For forecasting, scenario analysis was used so the outlook reflects different paths for pricing, consumer trading behavior, and regulatory-led packaging cost changes. Where country data series were missing or broken, gaps were handled by using nearby-country proxies and then rechecked in interviews before the final number was locked.
Data Validation & Update Cycle
Before sign-off, totals are checked against independent signals such as beverage category value trends, import-export directionality, and retail price movement so results do not drift away from what the market is showing. Outliers are flagged, the drivers are reviewed, and assumptions are revisited until the variance can be explained in plain terms.
The work is reviewed in multiple steps by different analysts, and re-contact is triggered when a key input changes sharply, such as an unexpected price jump, a large packaging policy change, or a demand break in a major country. Reports are refreshed annually, and interim updates are made when material events occur, followed by a final pre-delivery pass so clients receive the latest updated view.
Mordor Intelligence's Europe Bottled Water Market Size Versus Other Published Estimates
It is normal to see different market sizes for bottled water in Europe, even when everyone looks at the same countries. The spread usually comes from what is counted as bottled water, which year is treated as the current estimate, and how pricing and mix changes are handled.
Some publishers anchor the value using a different time window or bring in adjacent packaged-water categories that sit close to bottled water in retail shelves. Mordor Intelligence counts bottled water across still, sparkling, and flavored or functional variants in Europe for 2026, and it keeps the total tied to price-per-liter and channel sell-through checks instead of extending the scope into bulk water delivery or in-home systems.
Benchmark comparison
| Source | Market Size | Gaps in Research Methodology |
|---|---|---|
| Mordor Intelligence | USD 83.36 B (2026) | |
| Industry Publisher A | USD 75.74 B (2025) | Uses a different base year and often reflects a broader bottled-water grouping in country splits, which can shift the total when premium and functional pricing is treated differently. |
| Consultancy B | USD 72.82 B (2024) | Anchors the estimate two years earlier and applies a slower value progression, which tends to understate the effect of recent price-per-liter increases and mix movement toward higher priced variants. |
Taken together, the gap is mainly explained by year selection and how value is carried forward through price and mix, not by a disagreement that bottled water demand exists across the region. By keeping scope tight to bottled water and by using repeatable checks like country consumption direction and channel pricing, the final estimate stays transparent and easier to reproduce.


Key Questions Answered in the Report
How big is Europe’s bottled water segment today and how fast is it growing?
Sales reached USD 83.36 billion in 2026 and are projected to increase at a 6.20% CAGR to USD 112.54 billion by 2031.
Which type of bottled water is expanding the quickest across Europe?
Functional water, enriched with electrolytes and adaptogens, is advancing at an 8.28% CAGR through 2031, outpacing all other categories.
What share does Germany hold in continental bottled water sales?
Germany accounted for 19.27% of 2025 value, the highest share among individual European countries.
How are EU recycled-content rules affecting packaging choices?
The Single-Use Plastics Directive requires 25% rPET in bottles by 2025 and 30% by 2030, pushing producers to ramp up rPET supply and redesign bottles.
What is driving the recovery of on-premise bottled water sales?
Reopened offices and hospitality venues are adopting carbon-neutral hydration programs, helping the on-trade channel grow at a 6.18% CAGR.
Page last updated on:




