
Biopharmaceuticals Market Size and Share
Market Overview
| Study Period | 2020 - 2031 |
|---|---|
| Market Size (2026) | USD 462.55 Billion |
| Market Size (2031) | USD 652.72 Billion |
| Growth Rate (2026 - 2031) | 7.12% CAGR |
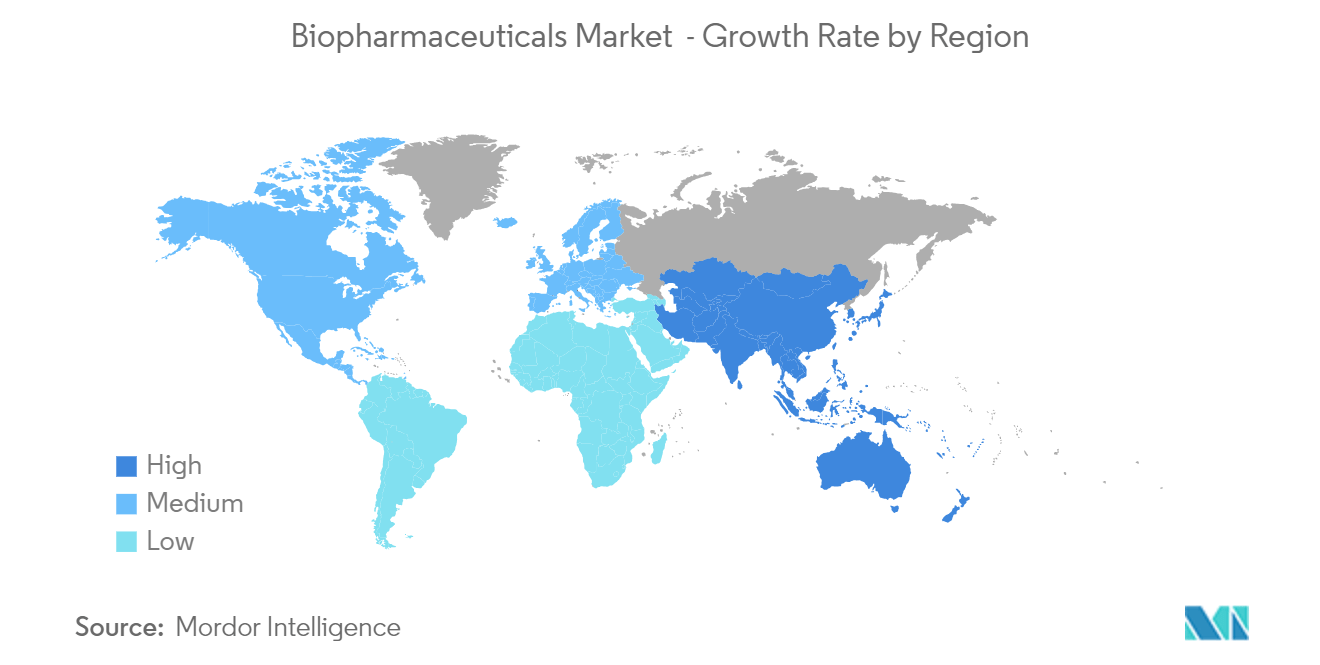
| Fastest Growing Market | Asia Pacific |
| Largest Market | North America |
| Market Concentration | High |
Major Players *Disclaimer: Major Players sorted in no particular order Image © Mordor Intelligence. Reuse requires attribution under CC BY 4.0. | |
Biopharmaceuticals Market Analysis by Mordor Intelligence
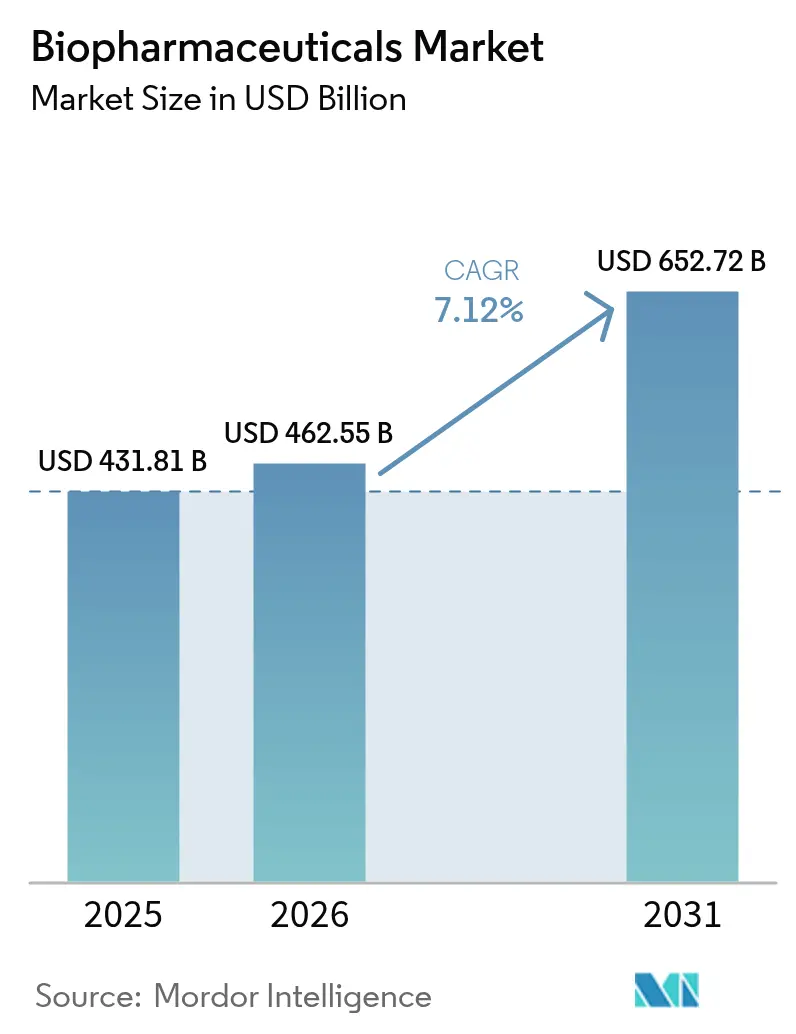
The Biopharmaceuticals Market size was valued at USD 431.81 billion in 2025 and estimated to grow from USD 462.55 billion in 2026 to reach USD 652.72 billion by 2031, at a CAGR of 7.12% during the forecast period (2026-2031).
The COVID-19 pandemic had a significant impact on the Biopharmaceutical industry. Thus, Biopharma Industry Trends shifted to most Biopharmaceutical companies striving extensively to develop vaccines against the SARS-CoV-2 virus. For instance, in June 2022, Pfizer announced a USD 120 million investment for its Kalamazoo (Michigan) facility, enabling United States-based production for its COVID-19 oral treatment, PAXLOVID (nirmatrelvir tablets and ritonavir tablets). The increased interest in manufacturing COVID-19 vaccines significantly added to the growth of the Biopharmaceutical industry during the COVID-19 pandemic. Following the stabilization from COVID-19, the increasing prevalence of chronic diseases is expected to further shift the Biopharma Industry Trends toward developing solutions for chronic diseases, driving the growth of the biopharmaceutical market.
Factors like rising chronic disease prevalence and increasing acceptance and demand for Biopharmaceuticals owing to their ability to treat previously untreatable diseases are driving the market's growth. For instance, in September 2022, a report by the WHO stated that about 55 million people worldwide are living with dementia, and nearly 10 million cases are reported annually. The WHO also highlighted that Alzheimer's is the most common form of dementia and constitutes about 60-70% of the total cases of dementia. As per the same source, most people who develop Alzheimer's dementia are 65 years and above. Such a high disease prevalence is likely to facilitate the demand for effective treatment, which in turn will bolster Biopharma Market Growth over the coming years.
The Biopharmaceutical Products' ability to address previously untreatable conditions has paved the way for introducing innovative drugs in the market. For instance, in September 2022, the Center for Biologics Evaluation and Research (CBER) approved Bluebird Bio, Inc.'s SKYSONA (elivaldogene autotemcel), a Gene Therapy indicated to slow the progression of neurologic dysfunction in boys 4-17 years of age with early, active cerebral adrenoleukodystrophy (CALD). Similarly, in June 2022, CBER approved GlaxoSmithKline's PRIORIX, a live vaccine for measles, mumps, and rubella. Thus, such product approvals increase the availability of novel drugs in the market, which is expected to boost the biopharmaceutical market Growth over the forecast period.
Furthermore, in February 2022, Johnson & Johnson, one of the Largest Biopharmaceutical Companies, and its China-focused partner company Legend Biotech Corp. developed a therapy to treat a type of white blood cell cancer approved by the United States Food and Drug Administration (FDA). Thus, the development of new therapies that aid in treating oncologic disorders is anticipated to have a positive impact on the growth of the biopharmaceutical market over the forecast period.
Thus, factors such as rising chronic disease prevalence, product launches, and approvals over the forecast period are likely to facilitate market growth over the forecast period. However, high-end manufacturing and complicated and cumbersome regulatory requirements will hinder Biopharmaceuticals Market Growth over the forecast period.
Note: Market size and forecast figures in this report are generated using Mordor Intelligence’s proprietary estimation framework, updated with the latest available data and insights as of 2026.
Global Biopharmaceuticals Market Trends and Insights
Anti-cancer Monoclonal Antibodies are Expected to Witness Significant Growth Over the Forecast Period in the Biopharmaceutical Market
Anti-cancer Monoclonal Antibodies (also called moAbs or mAbs) are a class of Biologics made in laboratories that act like antibodies and treat cancer. They work in different ways to kill cancer cells or inhibit their growth further. The rising usage of monoclonal antibodies and antibody derivatives in therapeutics to treat cancer is a key driver for the rapid growth of the Monoclonal Antibodies Market.
Growing approvals, clinical trials, and increasing research expenditure are major factors contributing to this segment's growth. For instance, in October 2022, PT217, a bispecific anti-Delta-like ligand 3 (DLL3)/anti-Cluster of Differentiation 47 (CD47) antibody, developed by Phanes Therapeutics, Inc., received Phase 1 clearance from the United States Food and Drug Administration (FDA). Phanes Therapeutics, Inc. is a clinical-stage Biopharmaceutical Research Company focused on oncology for patients with small cell lung cancer (SCLC) and other neuroendocrine cancers.
Additionally, the growing number of FDA approvals and new product launches for various indications will drive the segment. For instance, in January 2022, the FDA approved Kimmtrak for treating HLA-A-positive adult patients with unresectable or metastatic uveal melanoma, a rare type of cancer that originates in the eye. Similarly, in May 2022, Roche Pharma launched Phesgo, a combination of Monoclonal Antibodies, Perjeta (pertuzumab) and Herceptin (trastuzumab) with hyaluronidase, for the treatment of patients with breast cancer.
Thus, the Monoclonal Antibodies Market segment is likely to witness significant growth over the forecast period due to the above-mentioned factors.


North America is Expected to Hold a Significant Share of the Market Over the Forecast Period
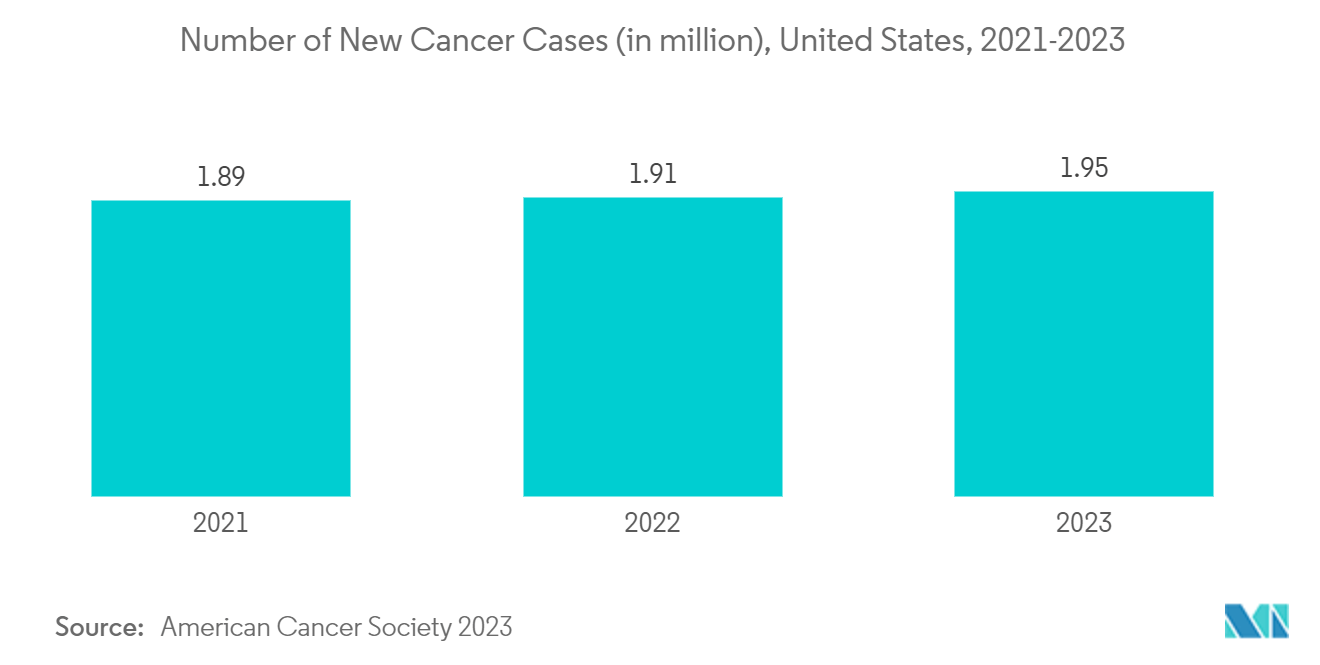
As per Biopharmaceutical Analysis, the growing burden of chronic diseases, the rising geriatric population, and increasing investments in research and development activities in the region are the major factors driving the Biopharmaceuticals Market in North America. In addition, the presence of well-established Biopharmaceutical Companies and new product launches are also expected to boost market growth in the region.
The rising prevalence of chronic diseases in the United States is likely to facilitate market growth in the region. For instance, the Centers for Disease Control and Prevention's (CDC) data updated in July 2022 briefed that coronary heart disease is the most common type of heart disease, and approximately 20.1 million adults aged 20 and older suffer from the ailment in the United States. Additionally, per the CDC data, every 40 seconds, someone suffers from a heart attack, and nearly 805,000 people in the United States have a heart attack annually. Thus, the high burden of cardiovascular diseases demands the availability of advanced drugs for treatment, which is likely to boost the Biopharma Market Growth.
Furthermore, an increase in the incidences of chronic diseases among the Canadian population, as well as the comorbidities associated with the diseases, is expected to positively impact the growth of the Biopharmaceuticals Market over the forecast period. For instance, according to Statistics Canada, as of July 2022, almost one in five Canadians (18.8% of the population; 7,329,910 people) were at least 65 years of age. As the geriatric population is more prone to chronic diseases, the rising elderly population is likely to raise the demand for effective drugs for their treatment hence, expected to drive the market growth over the forecast period.
Furthermore, strategic activities such as acquisitions and rising investments by key market players to expand their footprint in the Biopharmaceuticals Industry are also expected to propel market growth. For instance, in May 2022, Eli Lilly and Company announced an investment of USD 2.1 billion to expand its manufacturing footprint in Indiana, United States. Similarly, in May 2022, LOTTE acquired Bristol Myers Squibb's manufacturing facility in East Syracuse, New York. The East Syracuse site will serve as the LOTTE Center for North America Operations for LOTTE's new Biologics contract development and manufacturing organization (CDMO) business in the United States.
Thus, due to the factors mentioned above, such as rising chronic disease prevalence and the company's investment and acquisition strategy, the studied market is expected to grow significantly in North America over the forecast period.

Regulatory Landscape
The global biopharmaceuticals regulatory environment continues to tighten around evidence standards and manufacturing controls, while it clarifies pathways for complex biologics and biosimilars. In March 2026, the US FDA issued updated draft Q&As for biosimilar development under the BPCI Act section 351(k) pathway, reinforcing current expectations on demonstrating biosimilarity and the evidence package needed for abbreviated licensure. In the EU, the European Medicines Agency (EMA) adopted a March 2026 reflection paper on a tailored clinical approach for biosimilars, supporting development strategies that rely more heavily on analytical characterization and, where justified, reduced comparative clinical efficacy studies.
Manufacturing and lifecycle change control remain central compliance themes for both originator biologics and biosimilars. The EMA implemented a revised stability testing guideline for marketing authorization variations effective January 15, 2026, and its GMP/GDP Inspectors Working Group advanced a concept paper in January 2026 to revise Annex 15 (qualification and validation) aligned to ICH Q9(R1) quality risk management. In China, the State Council implemented new rules effective May 1, 2026 governing clinical research and translational application of new biomedical technologies, alongside revised Drug Administration Law implementation regulations effective May 15, 2026 that emphasize coordinated oversight of supply resilience and essential medicine management, adding another compliance layer for global companies operating across regions.
Competitive Landscape
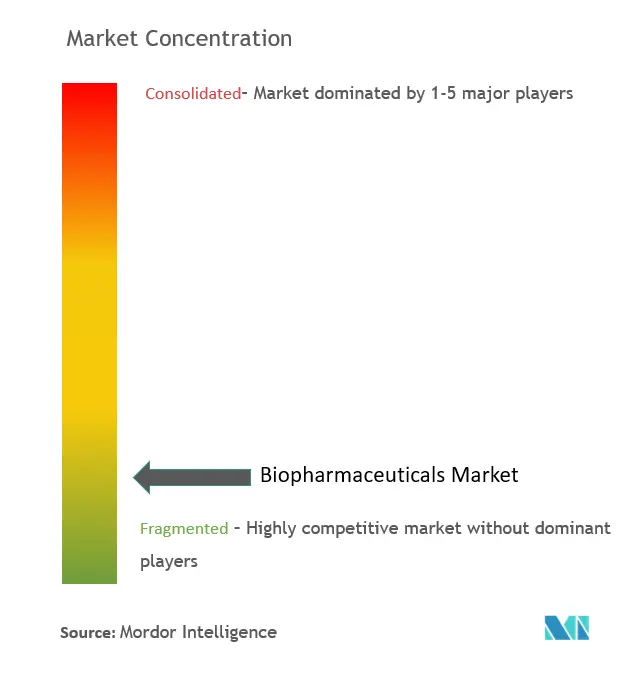
The biopharmaceutical market is fragmented in nature due to the presence of several companies operating globally. The competitive landscape includes analyzing a few well-known international and local companies, including some of the Largest Biopharmaceutical Companies that hold market shares. Furthermore, companies adopt various strategic measures such as acquisitions, partnerships, collaborations, and new product launches to expand in the market and enhance their Biopharmaceutical Marketing strategies. Some of the Largest Biopharmaceutical Companies in the industry include Amgen Inc., Eli Lilly and Company, Johnson and Johnson, Abbvie Inc., and Bristol-Myers Squibb Company, among others.
Biopharmaceuticals Industry Leaders
Amgen Inc.
Abbvie Inc.
Bristol-Myers Squibb Company
Eli Lilly and Company
Johnson & Johnson
- *Disclaimer: Major Players sorted in no particular order

Market Opportunities and Future Outlook
Manufacturing scale-up and outsourcing capacity are expanding across drug substance and sterile fill-finish, creating room for CDMOs and suppliers that can meet biologics quality and tech-transfer demands. In June 2026, Recipharm announced a multi-million-dollar investment to expand US sterile fill-and-finish capabilities for biologics and advanced therapies, and in July 2026 Bora Biologics added a commercial manufacturing site in Rockville, Maryland, lifting installed US single-use bioreactor capacity to 20,000 liters (scalable to 30,000 liters). Lonza also announced an expansion of antibody-drug conjugate (ADC) manufacturing at its Visp, Switzerland, hub, adding payload-linker production and purification capacity, planned to become operational in 2028. The focus on higher-complexity biologics modalities is continuing to pull through in capacity and capability investments.
Process modernization and data-driven development are a near-term execution area for firms looking to standardize data, validation, and lifecycle governance in line with regulator expectations. BioPhorum published its Technology Strategy Maturity Matrix (TSMM) in April 2026 to guide large-scale biomanufacturing organizations in adopting digitally enabled manufacturing and AI- and machine-learning-augmented process design. Separately, the FDA and EMA jointly published guiding principles for Good AI Practice in Drug Development (January 2026), which clarifies how companies may frame compliance when deploying AI across the drug lifecycle, from development through manufacturing and post-approval change management.
Recent Industry Developments
- July 2026: AbbVie announced European Commission approval for TEPKINLY (epcoritamab) in combination with lenalidomide and rituximab for relapsed or refractory follicular lymphoma. The decision expands an oncology biologics franchise into an additional EU setting and supports broader regimen adoption through combination use in hematologic malignancies.
- June 2026: AbbVie entered a definitive agreement to acquire Apogee Therapeutics for approximately USD 10.9 billion in cash to deepen its immunology pipeline. The transaction concentrates investment into biologic candidates for inflammatory diseases and reinforces the role of M&A in advancing next-generation biologics portfolios.
- May 2026: Bristol Myers Squibb and Hengrui Pharma announced global strategic collaboration and license agreements to advance a portfolio of 13 early-stage programs spanning oncology, hematology, and immunology, with total potential value up to approximately USD 15.2 billion. The deal broadens access to a multi-asset pipeline and diversifies R&D sourcing for biologics and other innovative modalities across major therapy areas.


Research Methodology Framework and Report Scope
Market Definition and Coverage
This market covers revenues generated from biopharmaceutical products that are biologically produced and used to prevent, treat, or manage diseases. It includes biologics made using cell-based and recombinant methods, sold for clinical use globally.
Scope exclusions: We exclude small-molecule chemical drugs and non-therapeutic research reagents that are not sold as approved or clinically used biopharmaceutical products.
Segmentation Overview
- By Product Type
- Monoclonal Antibodies
- Anti-cancer Monoclonal Antibodies
- Anti-inflammatory Monoclonal Antibodies
- Other Monoclonal Antibodies
- Recombinant Growth Factors
- Erythropoietin
- Granulocyte Colony Stimulating Factor
- Purified Proteins
- Leukemia Inhibitory Factor (LIF)
- P53 Protein
- P38 Protein
- Other Purified Proteins
- Recombinant Proteins
- Serum Albumin
- Amyloid Protein
- Defensin
- Transferrin
- Recombinant Hormones
- Recombinant Human Growth Hormones
- Recombinant Insulin
- Other Recombinant Hormones
- Vaccines
- Recombinant Vaccines
- Cancer Vaccine
- Malaria Vaccine
- Ebola Vaccine
- Hepatitis-B Vaccine
- Tetanus Vaccine
- Diptheria Vaccine
- Cholera Vaccine
- Other Recombinant Vaccines
- Conventional Vaccines
- Polio Vaccine
- Pox Vaccine
- Other Conventional Vaccines
- Recombinant Vaccines
- Recombinant Enzymes
- Enterokinase
- Cyclase
- Caspase
- Cathepsin
- Cell and Gene Therapies
- Allogenic Products
- Autologous Products
- Acellular Products
- Cytokines, Interferons, and Interleukins
- Other Product Types
- Blood Factors
- Other Product Types
- Monoclonal Antibodies
- By Therapeutic Application
- Oncology
- Inflammatory and Infectious Diseases
- Autoimmune Disorders
- Metabolic Disorders
- Hormonal Disorders
- Cardiovascular Diseases
- Neurological Diseases
- Other Therapeutic Applications
- Geography
- North America
- United States
- Canada
- Mexico
- Europe
- Germany
- United Kingdom
- France
- Italy
- Spain
- Rest of Europe
- Asia-Pacific
- China
- Japan
- India
- Australia
- South Korea
- Rest of Asia-Pacific
- Middle East and Africa
- GCC
- South Africa
- Rest of Middle East and Africa
- South America
- Brazil
- Argentina
- Rest of South America
- North America
Data Sources, Market Sizing, and Validation
Desk Research
Desk research was used to set the boundaries of what counts as a biopharmaceutical product, then to build the first version of the demand and supply picture by region. We relied on public and official references such as FDA, EMA, WHO, and OECD health statistics, and then supported it with sources including World Bank macro indicators and UN Comtrade trade statistics for relevant pharma and biotech flows where classification allows.
To make assumptions realistic, we reviewed company annual reports, investor presentations, product press releases, and filings where sales by therapy area or the share of biologics were discussed. In parallel, we used paid subscriptions focused on company financials and intelligence, plus patent databases, to cross-check product activity, launch timing, and pipeline maturity signals that influence adoption and pricing direction. These desk sources are illustrative only, and additional public materials were used during data collection, validation, and clarification.
Primary Interviews and Surveys
Primary interviews and surveys were run with a mix of manufacturers, CDMO-facing executives, commercial leaders, regulatory and quality professionals, and therapy-area specialists, so that assumptions could be stress-tested from different angles. For a global market, our coverage emphasized APAC, EMEA, and the Americas to check differences in launch sequencing, biosimilar uptake, and pricing corridor behavior, then to close gaps left by desk inputs.
Distribution of primary research fieldwork respondents
| Company type | Respondent position | Region |
|---|---|---|
| Top tier: 30% | CXOs: 19% | APAC: 41% |
| Mid tier: 51% | Functional/Unit leaders: 30% | EMEA: 36% |
| Smaller Players: 19% | Managers: 51% | Americas: 23% |
Market-Sizing & Forecasting
Market sizing starts from a top-down build where disease burden and treated-patient pools are translated into therapy demand, then scaled by biologics penetration to reconstruct revenue by region and major therapy areas. Once the first totals are formed, they are corroborated with selective bottom-up checks, including sampled product revenues from public financial disclosures, channel and launch checks, and ASP times volume approximations in high-visibility categories. Where mismatches show up, totals are adjusted.
Key inputs used in the model include therapy-level prevalence and incidence trends, biologics and biosimilar adoption rates, launch and loss-of-exclusivity timing, and dosage form and route-of-administration mix that affects utilization. We also use observable price corridors, including discounting patterns for biosimilars. Forecasting uses scenario analysis anchored on expert expectations for pipeline conversion, regulatory timelines, and payer behavior, with assumptions refreshed by region where pricing and access dynamics vary. Where bottom-up visibility is weak for smaller products or fragmented geographies, gaps are handled through calibrated share-of-therapy spending and cross-checked using multiple independent signals rather than a single proxy.
Data Validation & Update Cycle
Validation is done through stepwise triangulation across model outputs, desk indicators, and primary feedback, before results move to analyst review and final sign-off. Outliers are flagged using variance checks across regions and therapy areas, then revisited through assumption reviews and selective re-contacts when the deviation cannot be explained by known launch, access, or pricing events.
The report is refreshed annually, and interim updates are triggered when material events occur, such as major approvals, pricing policy changes, or step changes in biosimilar uptake. Before delivery, a final pass is completed so the latest currency conversions, pricing updates, and key market signals are reflected in the numbers clients receive.
Mordor Intelligence's Global Biopharmaceuticals Market Market Size Compared With Other Published Estimates
Published market sizes for biopharmaceuticals can differ even when the topic label looks the same, mainly because the counted product set, the pricing basis, and the timing of currency conversion are not aligned across studies. Differences also show up when one estimate leans on optimistic pipeline conversion, while another relies more on historical run-rate spending patterns.
In refresh-led reviews, the spread usually comes from how quickly price and mix are updated after major events, including biosimilar entry, plus whether conventional vaccines, cell and gene therapies, and adjacent biologics definitions are fully included. By keeping ASP logic tied to observable price corridors and converting currencies on a consistent timing basis during annual refreshes, Mordor Intelligence limits drift that can happen when older price points or inconsistent FX snapshots are carried forward.
Benchmark comparison
| Source | Market Size | Gaps in Research Methodology |
|---|---|---|
| Mordor Intelligence | USD 431.81 B (2025) | |
| Global Consultancy A | USD 666.41 B (2025) | Uses a broader counted set and faster price growth assumptions, which can lift totals when distribution-channel revenues and wider type definitions are rolled in together. |
| Industry Publisher B | USD 484.38 B (2025) | Reports figures on a different scale and segmentation basis, suggesting a scope or unit mismatch that can understate the market when compared to full product-revenue definitions. |
The table shows that most of the gap is explained by definitional breadth and how quickly pricing, mix, and currency timing are updated after market events. When scope is kept consistent and assumptions are refreshed in a repeatable way, the resulting size becomes easier to reconcile with real demand signals and to reuse for planning.


Key Questions Answered in the Report
How big is the Biopharmaceuticals Market?
The Biopharmaceuticals Market size is expected to reach USD 462.55 billion in 2026 and grow at a CAGR of 7.12% to reach USD 652.72 billion by 2031.
What is the current Biopharmaceuticals Market size?
In 2026, the Biopharmaceuticals Market size is expected to reach USD 462.55 billion.
Who are the key players in Biopharmaceuticals Market?
Amgen Inc., Abbvie Inc., Bristol-Myers Squibb Company, Eli Lilly and Company and Johnson & Johnson are the major companies operating in the Biopharmaceuticals Market.
Which is the fastest growing region in Biopharmaceuticals Market?
Asia Pacific is estimated to grow at the highest CAGR over the forecast period (2026-2031).
Which region has the biggest share in Biopharmaceuticals Market?
In 2026, the North America accounts for the largest market share in Biopharmaceuticals Market.
What years does this Biopharmaceuticals Market cover, and what was the market size in 2025?
In 2025, the Biopharmaceuticals Market size was estimated at USD 431.81 billion. The report covers the Biopharmaceuticals Market historical market size for years: 2020, 2021, 2022, 2023, 2024 and 2025. The report also forecasts the Biopharmaceuticals Market size for years: 2026, 2027, 2028, 2029, 2030 and 2031.
Page last updated on:




