Fill Finish Manufacturing Market Size and Share
Market Overview
| Study Period | 2020 - 2031 |
|---|---|
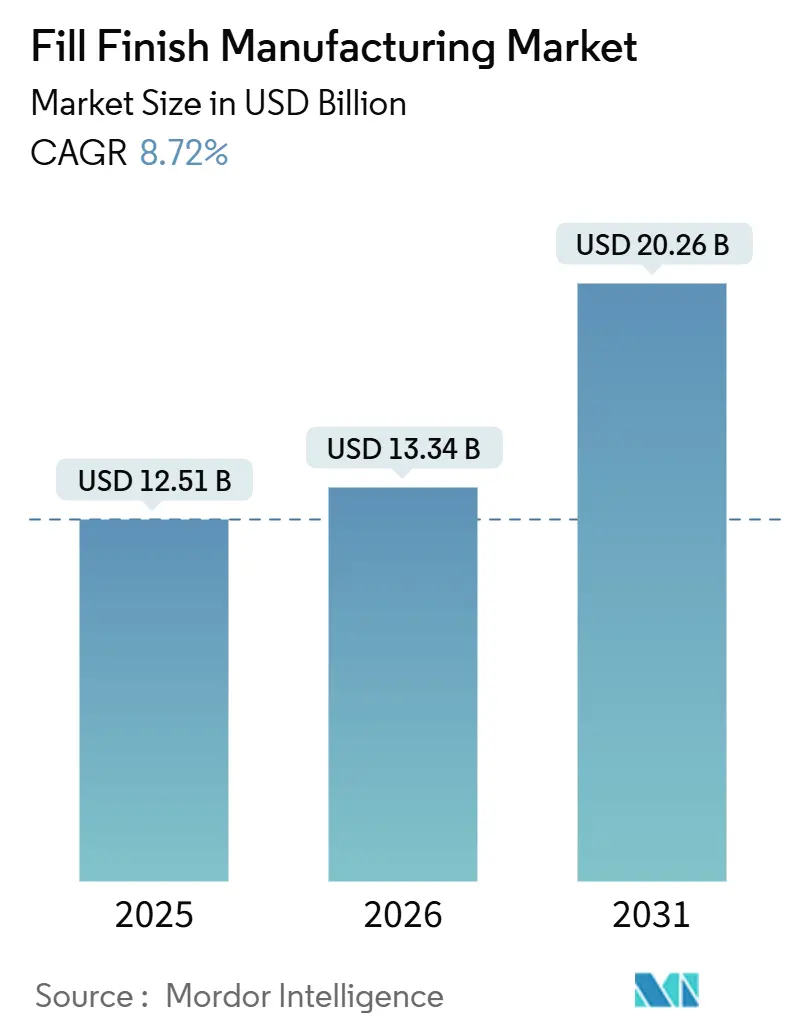
| Market Size (2026) | USD 13.34 Billion |
| Market Size (2031) | USD 20.26 Billion |
| Growth Rate (2026 - 2031) | 8.72% CAGR |
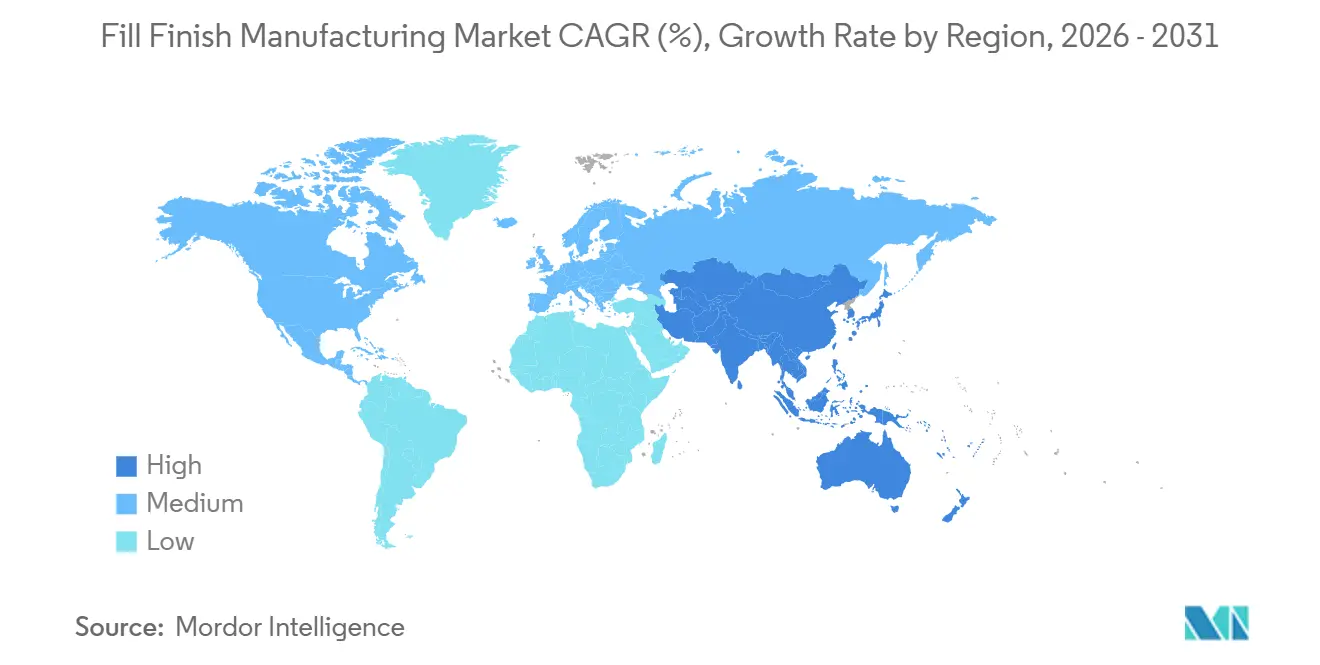
| Fastest Growing Market | Asia Pacific |
| Largest Market | North America |
| Market Concentration | Medium |
Major Players *Disclaimer: Major Players sorted in no particular order Image © Mordor Intelligence. Reuse requires attribution under CC BY 4.0. | |
Fill Finish Manufacturing Market Analysis by Mordor Intelligence
The Fill Finish Manufacturing Market size is expected to grow from USD 12.51 billion in 2025 to USD 13.34 billion in 2026 and is forecast to reach USD 20.26 billion by 2031 at 8.72% CAGR over 2026-2031.
Rapid growth of biologics and cell therapies is steering manufacturers away from legacy oral-solid dosage infrastructure toward highly automated aseptic lines that can handle fragile, high-value injectables. Glass containers still dominate today’s market, yet polymer formats, ready-to-use (RTU) components, and modular micro-batch isolators are redefining equipment specifications as well as procurement strategies. Rising adoption of AI-based predictive maintenance, coupled with sustainability mandates that favor recyclable cyclic-olefin polymers, is reshaping both capital-investment priorities and supplier selection criteria. Strategic outsourcing to contract development and manufacturing organizations (CDMOs) is intensifying, because innovators prefer flexible capacity to USD 50 million-plus green-field suites when pipelines are early stage.
Key Report Takeaways
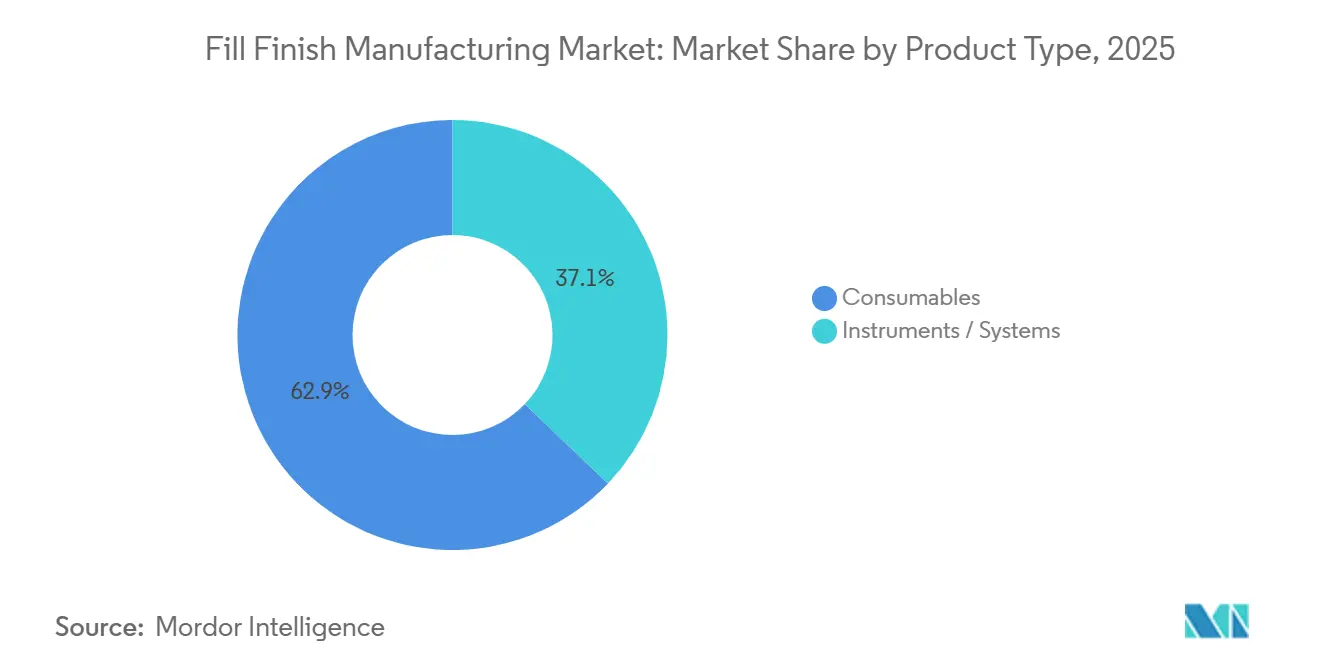
- By product type, consumables led with 62.81% of Fill-Finish Manufacturing market share in 2025, while instruments and systems post the fastest 9.50% CAGR to 2031.
- By end user, pharmaceutical and biotechnology firms held 53.35% revenue share in 2025; contract manufacturing organizations are advancing at a 9.21% CAGR through 2031.
- By container material, glass accounted for 60.08% share of the Fill-Finish Manufacturing market size in 2025 but polymer formats are expanding at a 9.48% CAGR to 2031.
- By geography, North America captured 37.44% of revenue in 2025, whereas Asia-Pacific is projected to grow at an 9.82% CAGR between 2026 and 2031.
Note: Market size and forecast figures in this report are generated using Mordor Intelligence’s proprietary estimation framework, updated with the latest available data and insights as of January 2026.
Global Fill Finish Manufacturing Market Trends and Insights
Drivers Impact Analysis*
| Driver | (~) % Impact on CAGR Forecast | Geographic Relevance | Impact Timeline |
|---|---|---|---|
| Technological advances in RTU syringes & cartridges | +1.8% | Global, with concentration in North America & Europe | Medium term (2-4 years) |
| Rising outsourcing to CDMOs / CMOs | +2.3% | Global, APAC core with spill-over to North America | Long term (≥ 4 years) |
| Expanding biologics & injectable pipeline | +2.1% | North America & EU lead, APAC accelerating | Long term (≥ 4 years) |
| Sustainability push for recyclable polymer components | +1.2% | EU primary, North America secondary | Medium term (2-4 years) |
| Modular micro-batch isolator systems | +0.9% | North America & EU, early adoption in Japan | Medium term (2-4 years) |
| AI-driven predictive maintenance | +0.5% | Global, led by large CDMOs in North America & APAC | Short term (≤ 2 years) |
| Source: Mordor Intelligence | |||
Technological Advances in RTU Syringes & Cartridges
RTU formats eliminate washing and depyrogenation, trimming two to three days from production lead time and safeguarding biologics with narrow stability windows. SCHOTT’s syriQ BioPure, launched in 2024, ships pre-sterilized glass barrels that cut visible-particulate rejects by 40% compared with bulk-washed components. West Pharmaceutical’s expansion of Daikyo Crystal Zenith polymer cartridges in 2025 is solving silicone-oil migration challenges for single-dose GLP-1 pens. Equipment suppliers support the shift: Syntegon’s ALAsys integrates RTU nest handling and reduces changeovers to under 90 minutes, enabling multi-product flexibility without serial sterilization cycles. As the Fill-Finish Manufacturing market tightens regulatory focus, the FDA and EMA now consider RTU containers a best-practice mitigation for Annex 1 contamination-control expectations, accelerating adoption by both CDMOs and captive plants.
Rising Outsourcing to CDMOs / CMOs
Capital intensity discourages innovators from building sterile suites; a single high-speed line can exceed USD 100 million in all-in costs. Samsung Biologics added four fill-finish lines during its USD 740 million Incheon expansion in 2025 to capture demand from biosimilar and mRNA vaccine sponsors[1]Samsung Biologics, “Incheon Campus Expansion Announcement,” samsungbiologics.com. WuXi Biologics secured global contracts for adalimumab and rituximab biosimilars after upgrading its Suzhou site to 12 aseptic lines. Lonza’s USD 400 million Portsmouth project introduced twin syringe lines rated at 400 units per minute, a scale that mid-sized biotech firms cannot replicate. These investments help the Fill-Finish Manufacturing market absorb surging volumes from clinical pipelines while spreading regulatory risk across specialized providers.
Expanding Biologics & Injectable Pipeline
Regulatory approvals for biologics remained strong, with the FDA clearing 30 products across 2024-2025 and the EMA authorizing 24 in the same period. Each new monoclonal antibody, fusion protein, or gene therapy requires sterile filling, lifting baseline demand in the Fill-Finish Manufacturing market. Novo Nordisk’s semaglutide franchise alone generated USD 21.1 billion during 2025, demanding over 1 billion prefilled pen assemblies annually. AstraZeneca allocated USD 1.5 billion for syringe capacity in Singapore and Ireland to support oncology launches. Even autologous CAR-T therapies, approved six times in 2024-2025, require micro-batch filling under Grade-A conditions, creating new niches for agile equipment and isolator suppliers.
Sustainability Push for Recyclable Polymer Components
EU waste regulations now stipulate recyclability for single-use medical plastics, influencing procurement throughout the Fill-Finish Manufacturing market. SCHOTT’s EVERIC pure cyclic-olefin vial and Gerresheimer’s ClearJect syringe with 30% recycled resin both arrived to help drug owners meet extended-producer-responsibility thresholds by 2027. West Pharmaceutical and Eastman Chemical are piloting molecular recycling loops for Crystal Zenith cartridges that satisfy USP <661> extractables limits while advancing corporate climate commitments. Because glass is inherently recyclable, polymer suppliers must deliver comparable circularity or pay rising EU fees, creating a design race that extends beyond barrier performance to end-of-life logistics.
Restraints Impact Analysis*
| Restraint | (~) % Impact on CAGR Forecast | Geographic Relevance | Impact Timeline |
|---|---|---|---|
| Stringent global GMP & validation costs | -1.4% | Global, acute in emerging markets | Long term (≥ 4 years) |
| High CAPEX for aseptic fill-finish lines | -1.1% | Global, constrains small & mid-size firms | Medium term (2-4 years) |
| EU plastics-waste regulation on disposables | -0.6% | EU primary, indirect impact on global suppliers | Medium term (2-4 years) |
| Talent shortage for advanced-therapy operations | -0.7% | North America & EU, emerging in APAC | Short term (≤ 2 years) |
| Source: Mordor Intelligence | |||
Stringent Global GMP & Validation Costs
Modern revisions mandate continuous environmental monitoring, three successful media fills, and annual requalification—regimens that cost USD 2 million to USD 5 million per line each year[2]European Medicines Agency, “EU Guidelines for Good Manufacturing Practice, Annex 1,” ema.europa.eu. FDA updates in 2024 added real-time particle trending, pushing firms to retrofit isolators with automated sampling nodes. China’s NMPA aligned domestic GMP with ICH Q7, compelling small CDMOs to buy differential-pressure alarms and self-cleaning isolators they can scarcely afford. Validation delays lengthen time-to-market; any contaminated unit during media fills resets the 18-month qualification calendar, dampening Fill-Finish Manufacturing market momentum in resource-constrained regions.
High CAPEX for Aseptic Fill-Finish Lines
All-in investment for a 400-unit-per-minute suite frequently tops USD 100 million once HVAC, lyophilizers, and inspection modules are included. Thermo Fisher’s Greenville expansion equates to roughly USD 95 million per line on a fully allocated basis. Biotech start-ups would rather deploy scarce capital toward pivotal trials than bricks and mortar, sending more demand to CDMOs yet concentrating supply risk among a shrinking set of mega providers. For micro-batch gene-therapy work, each modular isolator costs USD 2 million, and a six-unit layout still approaches USD 20 million, stalling commercialization for cash-limited developers.
*Our forecasts treat driver/restraint impacts as directional, not additive. The impact forecasts reflect baseline growth, mix effects, and variable interactions.
Segment Analysis
By Product Type: Automation Pulls Investment Toward Systems
Consumables anchored 62.81% of 2025 revenue because every batch consumes fresh vials, stoppers, cartridges, and prefilled syringes. Yet the Fill-Finish Manufacturing market size for instruments and systems is expanding faster, clocking a 9.50% CAGR that reflects industry fixation on throughput and compliance. Automated monoblocs integrate filling, stoppering, capping, and 100% vision inspection in one housing, curbing operator intervention and data-integrity risks. Syntegon’s ALAsys and IMA’s Adapta lines clock 400-plus units per minute while maintaining ±1% fill accuracy; CDMOs invest here to assure slot reservations from big pharma sponsors. Semi-automated equipment lingers in low-income geographies where labor costs undercut robotics, but incoming ICH-aligned GMP rules in India and China will nudge buyers toward full automation.
Consumables nonetheless remain indispensable and recession-resistant within the Fill-Finish Manufacturing market. Prefilled syringes are gaining share as GLP-1 injectables migrate from vials, while cartridge usage is ballooning on the back of pen devices for chronic diseases. Suppliers secure multi-year contracts bundling barrels, elastomer plungers, and needle shields, effectively locking customers into proprietary ecosystems. New RTU nests simplify line changeovers; SCHOTT’s NxT packaging reduces component prep time by 50%, an intangible yet important benefit as line-utilization targets creep past 80%. Sustainability considerations now influence bill-of-materials: polymer suppliers offering closed-loop recycling enjoy preferred-supplier status with procurement teams under ESG scorecard pressure.


By End User: Outsourcing Wave Reshapes Capacity Planning
Pharmaceutical and biotechnology firms controlled 53.35% of 2025 billings, with titans like Pfizer operating eight in-house aseptic lines to protect supply security for blockbuster franchises. Yet CDMOs are growing noticeably faster, with a 9.21% CAGR that dwarfs internal investments. The Fill-Finish Manufacturing market size contracted inside many mid-cap drug developers once Catalent became part of Novo Nordisk, because alternate vendors quickly filled available slots, driving up day rates. Samsung Biologics and WuXi Biologics collectively added nine lines over 2024-2025, staking claims on biosimilar pipelines requiring multi-regulatory filings.
Academic centers and public-sector vaccine institutes form the “Others” category. Their Fill-Finish Manufacturing market share is minor yet strategically significant for pandemic readiness. Government tenders frequently stipulate local fill-finish, spurring university hospitals to purchase tabletop fillers capable of 5,000 doses per day. Technology-transfer alliances with big manufacturers help these small sites achieve GMP compliance quickly without owning the full suite of analytical labs.
By Container Material: Polymer Closes Performance Gap With Glass
Glass captured 60.08% of 2025 revenue, a figure long rooted in inertness and regulatory familiarity. The Fill-Finish Manufacturing market is unlikely to witness glass displacement in lyophilized or terminal-sterilized products because borosilicate tolerates thermal excursions that cyclic-olefin polymers cannot. Yet polymer has found its calling in high-value biologics exposed to silicon leachates. Daikyo’s Crystal Zenith syringe reports sub-1 ppm silicon release, compared with up to 15 ppm for lubricated glass counterparts[3]Daikyo Seiko, “Silicon Release Study in Crystal Zenith Syringes,” jpharmsci.org. SCHOTT’s EVERIC pure vial withstands 1.5-meter drop tests, important for point-of-care supply chains in low-income regions.
Polymer acceptance accelerates whenever sustainability metrics align. The Fill-Finish Manufacturing market share captured by polymer is projected to widen as European buyers face recyclable-content quotas. However, retrofits require new nests, grippers, and inspection algorithms, representing USD 2 million in extra line-level spending, so adoption curves differ by corporate margin tolerance. Glass manufacturers counter by offering RTU formats and improved break-resistant coatings, slowing polymer inroads and preserving blended portfolios for risk-averse pharma clients.

Geography Analysis
North America retained 37.44% of global billings in 2025 thanks to its dense cluster of innovators, marquee CDMOs, and a robust FDA inspection framework. The region hosts an estimated 180 commercial aseptic lines, many embedded in vertically integrated big-pharma campuses that demand 95% runtime reliability. Mexico is building syringe capacity in Juarez to serve U.S. near-shoring strategies, trimming customs delays and tariff risk. Canada’s growth is modest but focused on biosimilars; two new lines at Apotex and Pharmascience will collectively deliver 120 million prefilled devices per year by 2027.
Europe combines world-class container suppliers with complex regulatory dynamics. Post-Brexit divergence forces dual MHRA and EMA validations, nudging multinational CDMOs to favor continental hubs in Germany and Italy. The EU waste directive increases operating expenses for polymer-heavy operations, yet Gerresheimer, SCHOTT, and Stevanato Group leverage in-house R&D to pioneer recyclable platforms that square GMP sterility with environmental targets. Eastern European nations position themselves as lower-cost fill-finish nodes, yet many still lack the inspection history demanded by U.S. buyers, stalling cross-Atlantic contracts.
Asia-Pacific is the clear growth engine, advancing at an 9.82% CAGR and gradually disrupting established trade routes in the Fill-Finish Manufacturing market. China’s NMPA cleared 23 biosimilars over 2024-2025, catalyzing USD 200 million-plus expansions at WuXi Biologics and Fosun Pharma. India’s Serum Institute readied six lines capable of 1.5 billion doses annually, anchoring GAVI procurement for polio and HPV. South Korea funnels public incentives into Samsung Biologics and SK Bioscience, both of which embed local robotics expertise for lights-out syringe packaging. Japan’s demographic focus on aging spurs in-country capacity for long-acting injectables, though its stringent PMDA validation extends lead times relative to Korea and Singapore.

Competitive Landscape
The Fill-Finish Manufacturing market centers around a top-ten roster where integrated CDMOs, equipment OEMs, and container specialists cross-license and occasionally acquire to secure supply. Novo Nordisk’s USD 16.5 billion take-over of Catalent removed North America’s largest independent CDMO, hiking slot prices for mid-cap innovators. Samsung Biologics responded by pledging a fifth Incheon “super-plant,” reinforcing its claim as the world’s largest single-site fill-finish complex. WuXi Biologics scaled an end-to-end digital QA platform, allowing simultaneous FDA, EMA, and NMPA review of batch records, a service differentiator in audit-heavy therapeutic areas.
On the equipment front, Syntegon’s MindSphere integration delivers batch-level e-signatures and predictive maintenance metrics, while OPTIMA’s sensor orchestration feeds electronic-batch-record systems, aligning with FDA 21 CFR Part 11. ABB and KUKA collaborative robots now pick RTU nests under Grade A laminar flow, easing operator fatigue and freeing technicians for deviation resolution. Container suppliers embrace vertical integration: West Pharmaceutical bought Corning’s pharmaceutical glass tubing assets in 2024 to secure raw materials and bundle closures with vials for five-year take-or-pay contracts.
White-space innovation targets micro-batch gene therapy. IPS and Comecer advance plug-and-play isolators that can install in refurbished suites without invasive floor drains or external CIP skids. Stevanato Group’s EZ-fill with inline near-infrared spectroscopy removes destructive testing, a boon for drugs with lot sizes under 1,000 units. Such specialized solutions diversify revenue away from commodity vials and broaden strategic arsenals as pipeline heterogeneity increases.
Fill Finish Manufacturing Industry Leaders
Becton, Dickinson and Company
West Pharmaceutical Services, Inc
IMA S.P.A
Syntegon Technology GmbH
Stevanato Group
- *Disclaimer: Major Players sorted in no particular order

Recent Industry Developments
- October 2025: Jubilant HollisterStier launched a third sterile fill-finish line at Spokane, Washington, adding 250 million dose capacity and 25 new SKUs to its CDMO offering.
- October 2025: Aenova installed an additional fill-finish line at its Latina, Italy site, raising biologics throughput for late-stage clinical and commercial customers by 200 million units annually.


Research Methodology Framework and Report Scope
Market Definitions and Key Coverage
Our study defines the fill-finish manufacturing market as every aseptic operation that transfers a drug substance into primary containers, vials, cartridges, pre-filled syringes, and related closure systems, followed by sealing, visual inspection, and labeling carried out in pharmaceutical or contract service facilities. The 2025 baseline value that Mordor Intelligence assigns to this global market is USD 12.26 billion, with scope spanning 17 major countries and both in-house and outsourced activities.
Scope exclusion: Bulk drug production, secondary packaging, and mechanical maintenance services are kept outside the boundary to keep the value chain focus tight.
Segmentation Overview
- By Product Type
- Consumables
- Prefilled Syringes
- Cartridges
- Vials
- Others
- Instruments / Systems
- Stand-Alone Systems
- Integrated Lines
- Automated Machines
- Semi-Automated / Manual Machines
- Consumables
- By End User
- Contract Manufacturing Organizations
- Pharmaceutical & Biotechnology Firms
- Others
- By Container Material
- Glass
- Polymer (COP/COC & other plastics)
- By Geography
- North America
- United States
- Canada
- Mexico
- Europe
- Germany
- United Kingdom
- France
- Italy
- Spain
- Rest of Europe
- Asia-Pacific
- China
- India
- Japan
- Australia
- South Korea
- Rest of Asia-Pacific
- Middle East and Africa
- GCC
- South Africa
- Rest of Middle East and Africa
- South America
- Brazil
- Argentina
- Rest of South America
- North America
Detailed Research Methodology and Data Validation
Primary Research
Analysts then interview fill-finish engineers, regulatory consultants, CDMO commercial leads, and procurement managers across North America, Europe, and Asia-Pacific. Conversations clarify average batch sizes, ready-to-use component uptake, and line utilization patterns, letting us adjust secondary estimates and stress-test demand inflection points.
Desk Research
We gather foundational statistics from tier-1 public repositories such as the US FDA's Biological License Application database, the European Medicines Agency's EudraGMDP, Eurostat's manufacture of pharmaceuticals series, and UN Comtrade shipment codes for HS-3002 and HS-9021. Company 10-Ks, investor decks, and industry association portals (e.g., ISPE, PDA) complement official datasets, while paid access to D&B Hoovers and Dow Jones Factiva supplies hard numbers on plant capacities and investment announcements. These inputs map injectable pipeline breadth, installed isolator lines, and regional export flows, which our team uses as starting anchors. The list above is illustrative; analysts draw on many other open and subscription sources as questions arise.
Market-Sizing & Forecasting
A top-down reconstruction, combining production volumes, trade flows, and injectable biologics approval counts, feeds the first cut. Select bottom-up roll-ups of sampled CDMO revenues and typical ASP × units validate and fine-tune totals. Key variables include (i) annual injectable biologic approvals, (ii) installed sterile isolator capacity square footage, (iii) pre-filled syringe unit shipments, (iv) capital outlay for fill-finish expansions, and (v) contract outsourcing penetration. Multivariate regression, supported by scenario analysis around biologics pipeline growth, projects values through 2030, while gaps in granular plant data are bridged with region-specific utilization coefficients derived from expert calls.
Data Validation & Update Cycle
Outputs pass a multi-step triangulation and variance screen, after which senior reviewers sign off. Reports refresh each year, with interim updates triggered by major facility approvals, capacity additions, or regulatory shifts. A quick data sweep just before release ensures clients receive the freshest view.
Why Mordor's Fill Finish Manufacturing Baseline Commands Reliability
Published figures differ because firms choose varying service scopes, forecast horizons, and currency conversion points. Our disciplined scoping, annual refresh cadence, and direct capacity cross-checks keep Mordor's baseline consistent and decision-ready.
Key gap drivers typically stem from whether ready-to-use components are bundled, how ASP erosion is modeled, and the aggressiveness of pipeline growth assumptions.
Benchmark comparison
| Market Size | Anonymized source | Primary gap driver |
|---|---|---|
| USD 12.26 Bn (2025) | Mordor Intelligence | - |
| USD 18.36 Bn (2025) | Global Consultancy A | Broader inclusion of secondary packaging and mixing of terminal sterilization services |
| USD 14.70 Bn (2025) | Industry Association B | Uses shipment value at factory gate without adjusting for multi-site transfers |
| USD 12.04 Bn (2025) | Trade Journal C | Applies higher ASP inflation and counts some oral dose CDMO revenue |
The comparison shows how modest scope tweaks or pricing assumptions swing market totals by several billion dollars. Mordor's grounded variable set, transparent adjustments, and repeatable steps give decision-makers a balanced, defensible starting point for strategy.


Key Questions Answered in the Report
What is the projected CAGR for global fill-finish manufacturing between 2026 and 2031?
The sector is forecast to expand at 8.72% CAGR during 2026-2031.
Which geographic region is expected to record the fastest growth through 2031?
Asia-Pacific is projected to advance at an 11.72% CAGR as China, India and South Korea scale aseptic capacity.
Why are contract manufacturing organizations gaining share in sterile filling?
Innovator drug companies prefer outsourcing because a single high-speed aseptic line can cost USD 100 million or more when facility and validation expenses are included.
What primary packaging trend is reshaping equipment specifications?
Adoption of ready-to-use polymer syringes, vials and cartridges is accelerating to curb particulates, cut change-over time and meet EU recyclability rules.
How does AI-driven predictive maintenance benefit high-speed filling lines?
Real-time analytics predict component failures up to three days in advance, reducing unplanned stoppages by more than 30% on early adopter lines.
Which product category currently generates the bulk of recurring revenue?
Consumables such as vials, prefilled syringes and cartridges account for 63.55% of 2025 sales because every production run consumes new components.
Page last updated on:


