Pharmaceutical Equipment Market Size and Share
Market Overview
| Study Period | 2020 - 2031 |
|---|---|
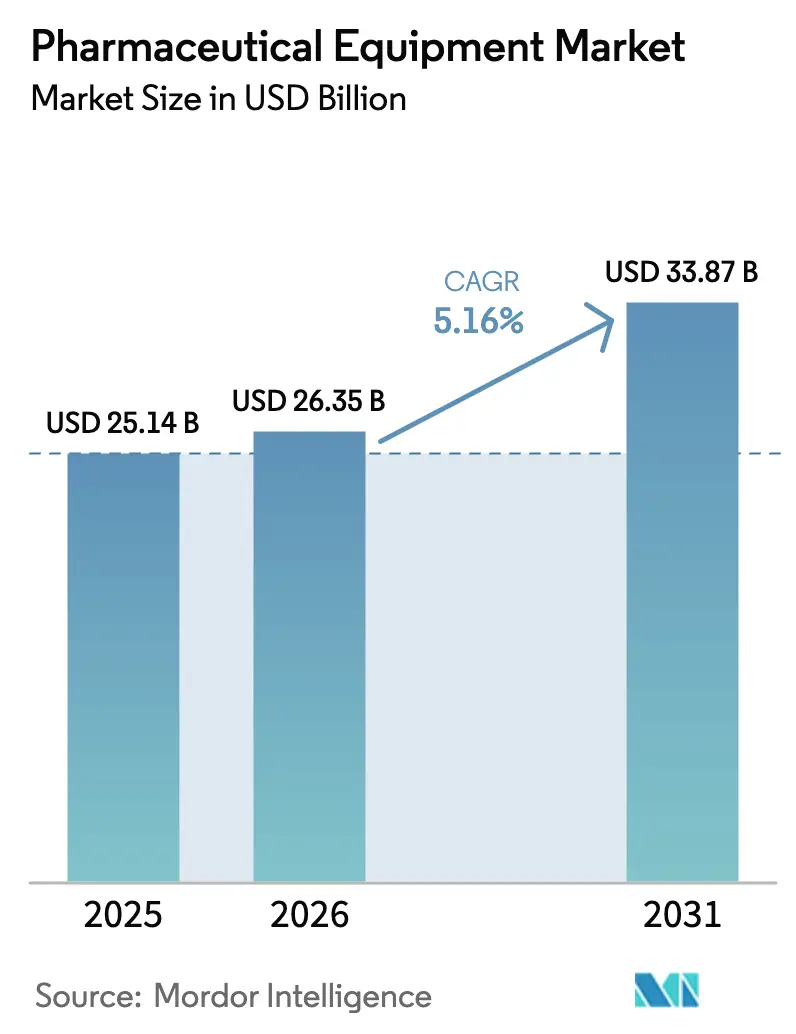
| Market Size (2026) | USD 26.35 Billion |
| Market Size (2031) | USD 33.87 Billion |
| Growth Rate (2026 - 2031) | 5.16% CAGR |
| Fastest Growing Market | Asia-Pacific |
| Largest Market | North America |
| Market Concentration | Medium |
Major Players *Disclaimer: Major Players sorted in no particular order Image © Mordor Intelligence. Reuse requires attribution under CC BY 4.0. | |
Pharmaceutical Equipment Market Analysis by Mordor Intelligence
The pharmaceutical equipment market size is expected to increase from USD 25.93 billion in 2025 to USD 27.10 billion in 2026 and reach USD 33.79 billion by 2031, growing at a CAGR of 4.51% over 2026-2031. Demand pivots toward biologics, which now account for 62% of pre-clinical and clinical manufacturing runs, prompting suppliers to replace monolithic stainless-steel installations with modular, single-use assemblies that cut validation timelines from 18 months to under 6 months. Contract development and manufacturing organizations (CDMOs) are consolidating purchasing power; they consumed 28% of global bioreactor capacity in 2024 and are projected to command 38% by 2028, accelerating investment in continuous-flow production skids. Regulatory change intensifies upgrade cycles: the European Medicines Agency’s Annex 1 revision obliges isolators or restricted-access barrier systems (RABS) across roughly 1,200 European fill-finish suites, driving a multiyear retrofit backlog. Meanwhile, the U.S. Food and Drug Administration (FDA) fast-tracks applications that deploy advanced manufacturing technologies, shortening commercial approval by 6 to 9 months and accelerating capital spending.
Key Report Takeaways
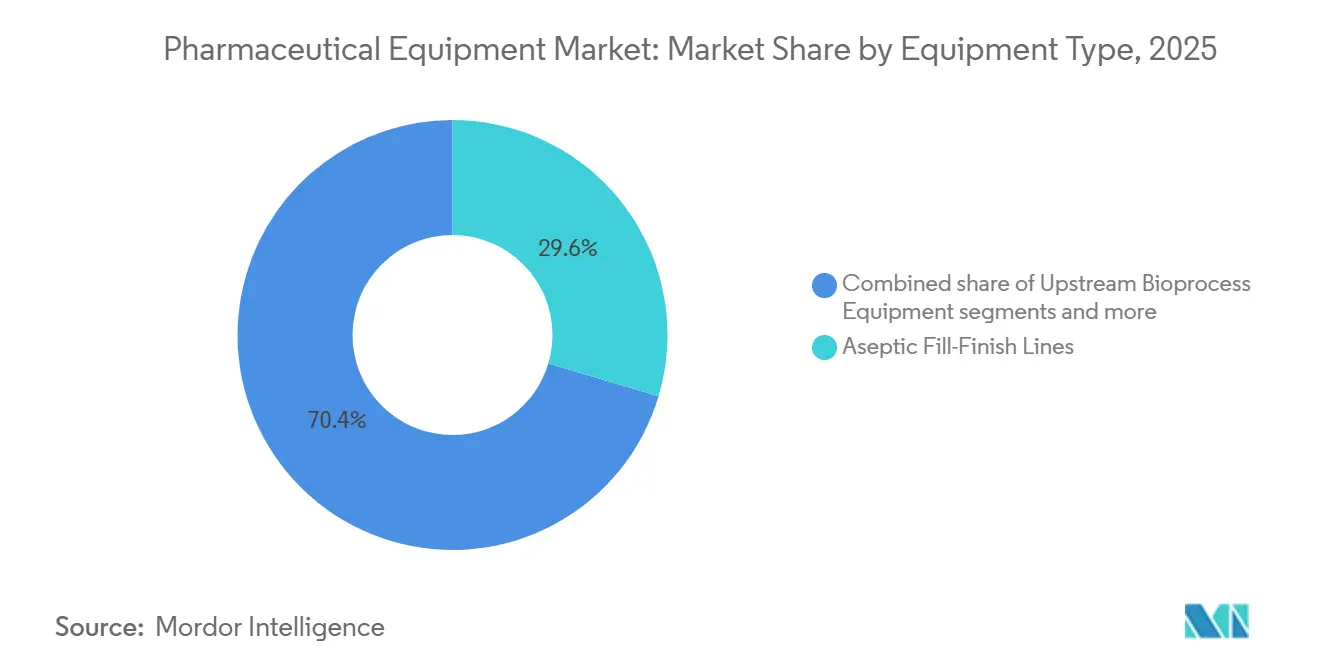
- By equipment type, aseptic fill-finish systems led with 29.55% revenue share in 2025, while quality-control and inspection instruments are advancing at a 4.85% CAGR through 2031.
- By manufacturing stage, drug substance production accounted for 36.53% of the pharmaceutical equipment market in 2025, but quality-control and release testing is projected to expand at a 5.75% CAGR through 2031.
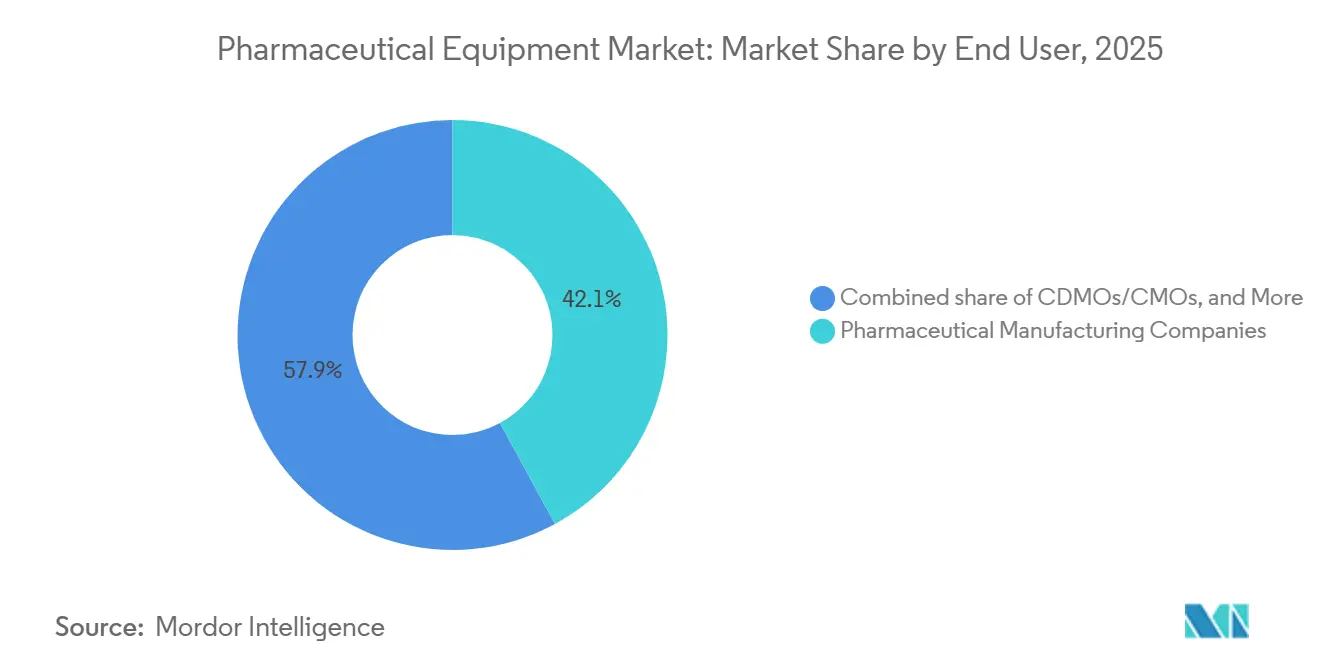
- By end user, Big Pharma accounted for 42.15% of spending in 2025; CDMOs/CMOs are growing faster at a 5.82% CAGR over 2026-2031.
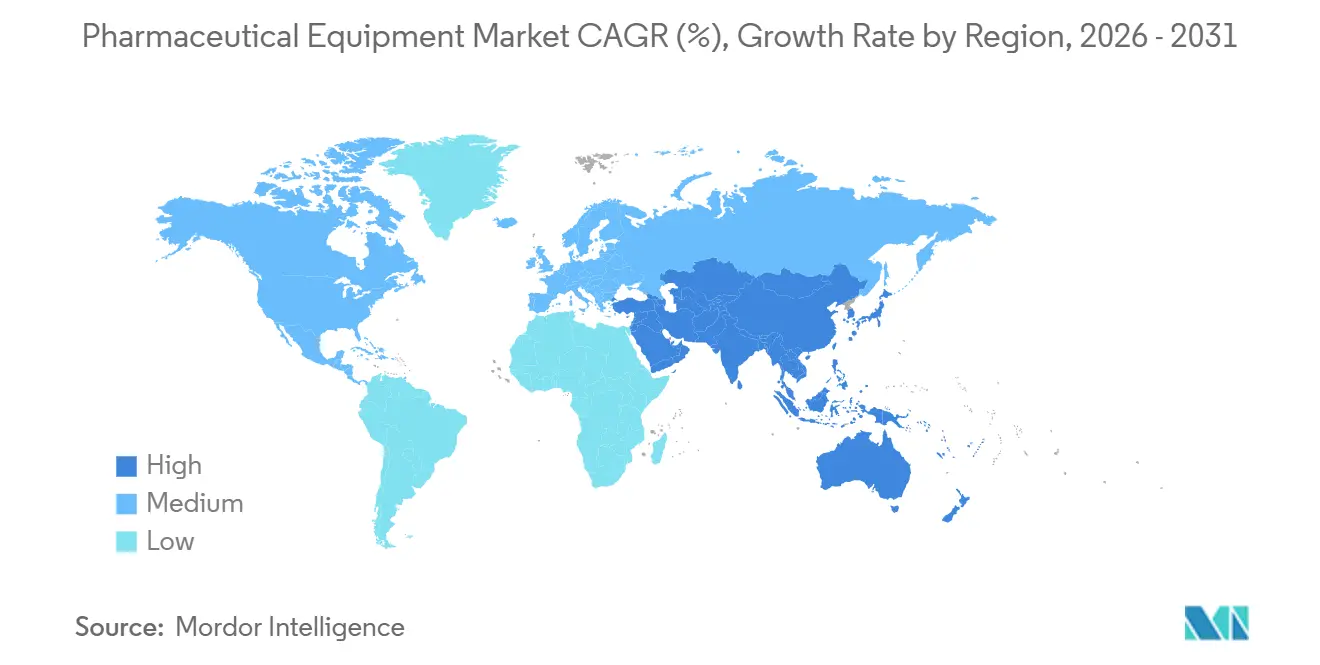
- Geographically, North America captured 42.52% of the pharmaceutical equipment market share in 2025; Asia-Pacific is set to be the fastest-growing region at a 5.12% CAGR up to 2031.
Note: Market size and forecast figures in this report are generated using Mordor Intelligence’s proprietary estimation framework, updated with the latest available data and insights as of 2026.
Global Pharmaceutical Equipment Market Trends and Insights
Driver Impact Analysis*
| Driver | (~) % Impact on CAGR Forecast | Geographic Relevance | Impact Timeline |
|---|---|---|---|
| Rising Biologics Manufacturing Volumes | +1.2% | North America, Europe, China | Long term (≥ 4 years) |
| Accelerated Adoption of Single-Use Tech | +0.9% | North America, Europe, accelerating in Asia-Pacific | Medium term (2-4 years) |
| Stringent GMP-Driven Equipment Upgrades | +0.7% | Global with EU retrofit spike | Short term (≤ 2 years) |
| Expansion of Contract Manufacturing Capacity | +0.8% | North America, Europe, India, Singapore | Medium term (2-4 years) |
| Shift Toward Continuous Manufacturing Lines | +0.5% | Early adoption in North America and Europe | Long term (≥ 4 years) |
| Pharma 4.0 Predictive-Maintenance Retrofits | +0.4% | Highest uptake in United States and Germany | Medium term (2-4 years) |
| Source: Mordor Intelligence | |||
Rising Biologics Manufacturing Volumes
Biologics commanded 85% of pipeline manufacturing runs in 2024, pushing installed global bioreactor volume from 6.7 million L to an expected 8.9 million L by 2028[1]BioPlan Associates, “Biomanufacturing Capacity Report 2024,” bioplanassociates.com . Viral-vector lines are most constrained, with 18-24-month equipment lead times that limit gene-therapy launches. New product pipelines encourage co-location of upstream and fill-finish assets, trimming batch transfer by 40% and simplifying contamination control[2]BioPhorum, “Single-Use Bioprocessing Adoption Trends 2024,” biophorum.com.
Accelerated Adoption of Single-Use Technologies
Single-use systems reached USD 27.8 billion in 2025 and are now deployed in 62% of commercial batches, saving users millions in cleaning-validation downtime. CDMOs value the 14-day campaign changeovers versus 45-60 days for stainless-steel lines, unlocking higher asset utilization. Supply-chain fragility persists: a 2024 polymer-film plant fire disrupted bag deliveries for 4 months and raised spot prices by 15% across Europe.
Stringent GMP-Driven Equipment Upgrades
The EU Annex 1 update mandates isolators or RABS for aseptic manufacture, generating USD 2.4-3.6 billion in retrofit demand between 2024-2026[3]European Medicines Agency, “EU GMP Annex 1 Revision,” ema.europa.eu. U.S. guidance on advanced technologies layers extra sensors for real-time parameter monitoring, lifting compliance investment for mid-tier biotech to 12-15% of annual revenue, compared with <2% for large multinationals[4]U.S. FDA, “Advanced Manufacturing Technologies Designation Program 2024,” fda.gov .
Expansion of Contract Manufacturing Capacity
CDMOs controlled 28% of installed bioreactor volume in 2024 and booked 52% of equipment orders above USD 10 million, leveraging scale to negotiate 15-20% price concessions. Samsung Biologics, Lonza, and Fujifilm Diosynth together pledged USD 8.4 billion to expand capacity by 3.2 million L and add 14 fill-finish lines by 2026.
Restraints Impact Analysis*
| Restraint | (~) % Impact on CAGR Forecast | Geographic Relevance | Impact Timeline |
|---|---|---|---|
| High Capital Investment & Long Payback | -0.6% | Global, with acute mid-tier biotech pressure | Long term (≥ 4 years) |
| Supply-Chain Shortages of Critical Components | -0.4% | EU and North America most exposed to single-use bottlenecks | Short term (≤ 2 years) |
| Multi-Jurisdiction Approval Complexity | -0.3% | FDA, EMA, PMDA triplicate filings | Medium term (2-4 years) |
| Skilled-Labor Gap in Emerging Markets | -0.2% | India, ASEAN, Latin America | Long term (≥ 4 years) |
| Source: Mordor Intelligence | |||
High Capital Investment & Long Payback
A greenfield 4×2,000 L biologics plant costs USD 300-450 million and takes seven to nine years to recover at present utilization and pricing. Rising European energy tariffs added USD 2.5-4 million in electricity spends for 10,000 m² facilities in 2024. Modular designs such as Cytiva’s FlexFactory shave 40% off upfront capital but cap annual throughput at 200 kg versus up to 800 kg for traditional builds.
Supply-Chain Shortages of Critical Components
Single-use systems depend on a small pool of polymer-film, filter, and tubing vendors; a March 2024 factory fire in Germany halted bag supplies for four months, forcing batch delays at three CDMOs. Semiconductor bottlenecks lengthened PLC and HMI lead times to 12-16 months at Siemens and Rockwell Automation in 2024. Manufacturers now dual-source 42% of critical items, raising procurement budgets 8-12%
*Our forecasts treat driver/restraint impacts as directional, not additive. The impact forecasts reflect baseline growth, mix effects, and variable interactions.
Segment Analysis
By Equipment Type: Aseptic Systems Lead, Quality Instruments Accelerate
Aseptic fill-finish platforms captured 29.55% of the pharmaceutical equipment market share in 2025 amid the boom in pre-filled syringes and autoinjectors for GLP-1 agonists and monoclonal antibodies. Quality-control instrumentation is forecast to grow 4.85% annually through 2031 as regulators require 100% visual inspection and real-time release testing. Upstream bioprocess skids benefit from a 33% surge in mammalian capacity, yet Chinese vendors undercut Western prices by up to 40%, squeezing margins.
Downstream purification assets, a gating step, run at >85% utilization in leading CDMOs, with each 2,000 L batch cycling through 8-12 chromatography passes and consuming 4-6 hours per pass. Serialization mandates raise primary and secondary packaging line costs by USD 1.5-2.5 million per installation, while Annex 1 drives higher HVAC and water-for-injection expenditure. The pharmaceutical equipment market size tied to lyophilizers and homogenizers trails the broader average as oral-solid dose output migrates to lower-cost sites.


By Manufacturing Stage: Drug Substance Dominates, QC Testing Surges
Drug substance assets accounted for 36.53% of the pharmaceutical equipment market in 2025, thanks to the capital-intensive nature of bioreactors and fermenters. The fastest growth, at a 5.75% CAGR to 2031, is in quality-control suites, where process analytical technology (PAT) is a precondition for continuous operation licenses. Drug product formulation grows modestly as portfolios shift from tablets to injectables that skip complex coating or granulation steps. Fill-finish capacity bifurcates between 400-600-unit-per-minute high-speed lines for biosimilars and 20-40-unit boutique lines priced at a premium for cell-therapy batches.
By End User: CDMOs Outpace Big Pharma in Growth Velocity
Big Pharma held 42.15% of expenditure in 2025, securing 15-20% volume discounts through global sourcing contracts. CDMOs and CMOs, however, expand faster at 5.82% CAGR, reflecting innovators’ appetite to outsource late-stage and commercial runs for balance-sheet agility. Academic and government sites receive pandemic-preparedness funding, with BARDA channeling USD 4.2 billion into modular suites that can switch products within weeks.
Geography Analysis
North America accounted for 42.52% of the pharmaceutical equipment market revenue in 2025, supported by 3.1 million L of installed bioreactor volume and expedited FDA reviews that shorten approval cycles by up to 9 months. BARDA investments establish rapid-deployment modules in Texas, North Carolina, and Maryland, while Canada’s USD 370 million regenerative-medicine hub enhances clinical-stage capacity. Mexico leverages labor savings of 40-50% to attract three U.S. fill-finish expansions.
Asia-Pacific is projected to grow 5.12% CAGR through 2031, spearheaded by China’s 1.2 million L capacity boost and India’s INR 150 billion PLI incentives for APIs and biologics. South Korea and Singapore host major CDMO clusters, whereas Japan automates to offset labor deficits, implementing 18 collaborative robots across inspection cells.
Europe faces elevated energy costs, with German electricity tariffs up 22% in 2024, yet it remains the innovation nucleus for single-use components, housing 9 of the top 15 suppliers. Annex 1 drives a USD 3 billion retrofit boom, led by Germany, the UK, and France. Southern Europe is emerging as a biosimilar fill-finish hub, driven by lower labor costs, despite slightly longer regulatory timelines. Middle East–Africa and South America remain small but strategically important. Saudi Arabia commits USD 3.2 billion to cut drug import reliance to 50% by 2030. South Africa’s Biovac secured Pfizer partnership for mRNA fill-finish, the continent’s first WHO-prequalified line. Brazil’s state-run Biomanguinhos installed a 2,000 L single-use reactor in 2025, but under-investment in quality control curbs export readiness.

Competitive Landscape
The pharmaceutical equipment market is moderately fragmented. Sartorius and Danaher’s Cytiva command a significant share of upstream bioprocess revenue, yet Chinese challengers Tofflon and Truking underprice lyophilizers and filling machines by up to 40%, securing 22% of Asia-Pacific orders in 2024. Thermo Fisher positions vertically, bundling equipment with CDMO services to drive sticky revenue; Sartorius monetizes digital ecosystems, such as its Ambr platform, generating USD 80-120 million in annual software subscriptions.
Patent filings for predictive maintenance climbed 68% in 2024, led by Körber and Rockwell Automation, whose digital twins reduce unscheduled downtime by 35% and protect CDMOs from penalty clauses. White-space innovation centers on modular rapid-deployment plants, closed-loop analytics, and sustainability retrofits that reduce water use by up to 60%. Disruptors such as Cellares compress cell-therapy manufacturing footprints 50-fold, while Culture Biosciences offers bioreactor-as-a-service to remove early-stage capital hurdles.
Incumbents still hold structural advantages: Danaher’s installed base of 8,000-plus bioprocess units yields USD 1.2-1.5 billion a year in high-margin consumables that fund R&D outlays two to three times higher than specialist entrants. Regulatory familiarity also favors long-established suppliers; four Chinese vendors failed to pass U.S. audit requirements in 2024-2025, delaying their entry into regulated markets.
Pharmaceutical Equipment Industry Leaders
GEA Group
Korber AG
LFA Machines Oxford LTD
Sartorius
Danaher (Cytiva)
- *Disclaimer: Major Players sorted in no particular order

Recent Industry Developments
- December 2025: AST and Marchesini Group formed a strategic alliance to deliver integrated sterile fill-finish solutions.
- April 2025: Comecer unveiled a portfolio of filling and closing machines aimed at high-potency pharmaceutical applications.


Global Pharmaceutical Equipment Market Report Scope
As per the report's scope, pharmaceutical equipment helps manufacturers produce drugs with desired qualities and properties.
The pharmaceutical equipment market is segmented by equipment type, manufacturing stage, end user, and geography. By equipment type, the market is segmented into upstream bioprocess equipment, downstream purification equipment, aseptic fill-finish systems, primary & secondary packaging lines, quality-control & inspection instruments, ancillary utilities (HVAC, CIP/SIP, etc.), and others. By manufacturing stage is segmented by drug substance production, drug product formulation, fill-finish, final packaging & labelling, and quality-control & release testing. By end user, the market is segmented into pharmaceutical manufacturing companies, contract development & manufacturing organizations (CDMOs/CMOs), and others. By geography, the market is segmented into North America, Europe, Asia-Pacific, the Middle East and Africa, and South America. The market report also covers the estimated market sizes and trends for 17 different countries across the major regions globally. The report offers the values (in USD) for the above segments.
| Upstream Bioprocess Equipment |
| Downstream Purification Equipment |
| Aseptic Fill-Finish Systems |
| Primary & Secondary Packaging Lines |
| Quality-Control & Inspection Instruments |
| Ancillary Utilities (HVAC, CIP/SIP, etc.) |
| Others |
| Drug Substance Production |
| Drug Product Formulation |
| Fill-Finish |
| Final Packaging & Labelling |
| Quality-Control & Release Testing |
| Pharmaceutical Manufacturing Companies |
| Contract Development & Manufacturing Orgs (CDMOs/CMOs) |
| Others |
| North America | United States |
| Canada | |
| Mexico | |
| Europe | Germany |
| United Kingdom | |
| France | |
| Italy | |
| Spain | |
| Rest of Europe | |
| Asia-Pacific | China |
| India | |
| Japan | |
| Australia | |
| South Korea | |
| Rest of Asia-Pacific | |
| Middle East and Africa | GCC |
| South Africa | |
| Rest of Middle East and Africa | |
| South America | Brazil |
| Argentina | |
| Rest of South America |
| By Equipment Type | Upstream Bioprocess Equipment | |
| Downstream Purification Equipment | ||
| Aseptic Fill-Finish Systems | ||
| Primary & Secondary Packaging Lines | ||
| Quality-Control & Inspection Instruments | ||
| Ancillary Utilities (HVAC, CIP/SIP, etc.) | ||
| Others | ||
| By Manufacturing Stage | Drug Substance Production | |
| Drug Product Formulation | ||
| Fill-Finish | ||
| Final Packaging & Labelling | ||
| Quality-Control & Release Testing | ||
| By End User | Pharmaceutical Manufacturing Companies | |
| Contract Development & Manufacturing Orgs (CDMOs/CMOs) | ||
| Others | ||
| By Geography | North America | United States |
| Canada | ||
| Mexico | ||
| Europe | Germany | |
| United Kingdom | ||
| France | ||
| Italy | ||
| Spain | ||
| Rest of Europe | ||
| Asia-Pacific | China | |
| India | ||
| Japan | ||
| Australia | ||
| South Korea | ||
| Rest of Asia-Pacific | ||
| Middle East and Africa | GCC | |
| South Africa | ||
| Rest of Middle East and Africa | ||
| South America | Brazil | |
| Argentina | ||
| Rest of South America | ||


Key Questions Answered in the Report
What growth rate is expected for the pharmaceutical equipment market to 2031?
The market is projected to expand at a 4.51% CAGR between 2026 and 2031, lifting value from USD 27.10 billion in 2026 to USD 33.79 billion by 2031.
Which equipment segment currently holds the largest revenue share?
Aseptic fill-finish systems led with 29.55% of revenue in 2025, reflecting demand for pre-filled syringes and autoinjectors.
Why are CDMOs important purchasers of pharmaceutical equipment?
CDMOs captured 28% of global bioreactor capacity in 2024 and negotiate large-volume orders that secure 15-20% price discounts and priority delivery slots.
Which region will grow fastest in pharmaceutical equipment spending?
Asia-Pacific is forecast to rise at a 5.12% CAGR through 2031, powered by capacity additions in China and India’s incentive programs.
How are regulations influencing equipment upgrades in Europe?
The EU Annex 1 revision mandates isolators or RABS for aseptic manufacture, driving a USD 3 billion retrofit wave across roughly 1,200 fill-finish suites.
What technology trend is reducing unplanned equipment downtime?
AI-enabled predictive-maintenance platforms with digital twins are lowering unplanned downtime by up to 35%, led by solutions from Körber and Rockwell Automation.
Page last updated on:


