Kenya Telecom MNO Market Size and Share
Market Overview
| Study Period | 2020 - 2031 |
|---|---|
| Forecast Data Period | 2026 - 2031 |
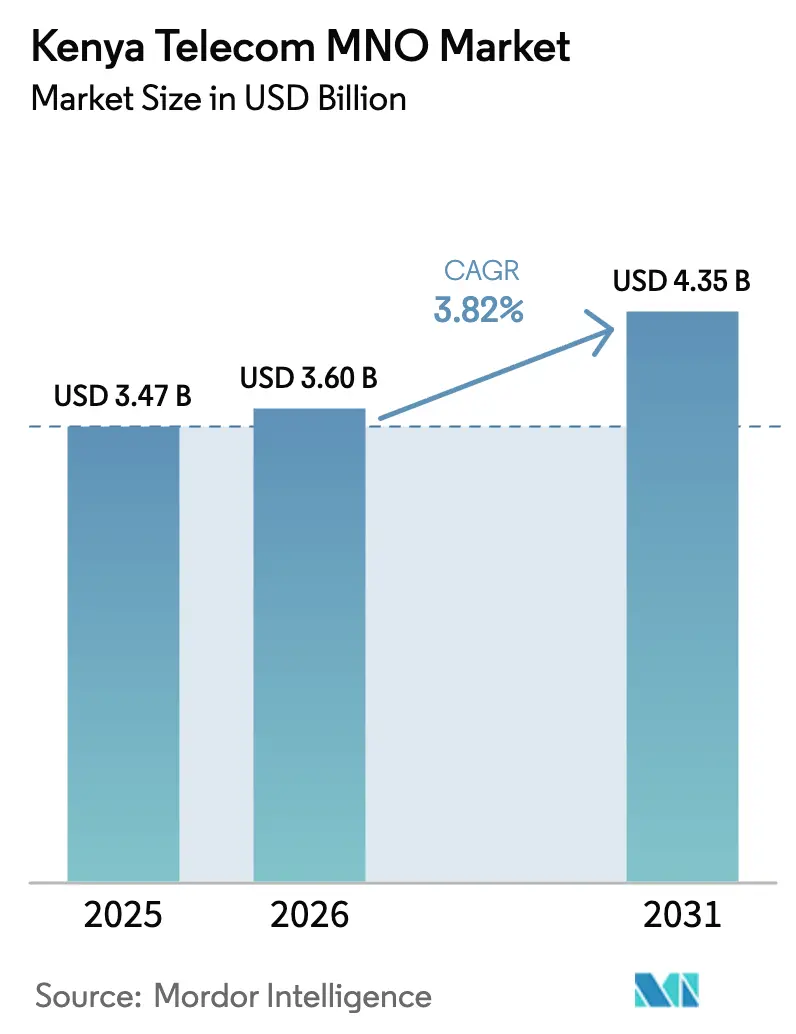
| Base Year Market Size (2025) | USD 3.47 Billion |
| Market Size (2026) | USD 3.6 Billion |
| Market Size (2031) | USD 4.35 Billion |
| Growth Rate (2026 - 2031) | 3.82% CAGR |
| Market Concentration | Medium |
Major Players *Disclaimer: Major Players sorted in no particular order Image © Mordor Intelligence. Reuse requires attribution under CC BY 4.0. | |
Kenya Telecom MNO Market Analysis by Mordor Intelligence
Kenya Telecom MNO Market size in 2026 is estimated at USD 3.6 billion, growing from 2025 value of USD 3.47 billion with 2031 projections showing USD 4.35 billion, growing at 3.82% CAGR over 2026-2031.
Robust data demand, ongoing fiber expansion under the BETA Pillar program, and rising 5G handset adoption keep the Kenya Telecom MNO market on a steady upward path despite new taxation on SIM cards and data bundles. Competitive tension is intensifying as satellite entrants such as Starlink test urban capacity limits and as Safaricom accelerates AI-enabled network upgrades. Government digital-economy programs have pushed the sector’s economic contribution to 9.24% of GDP in 2025, while the Universal Service Fund (USF) offsets rural connectivity gaps through targeted subsidies. Meanwhile, quality-of-service enforcement is tightening after only Safaricom exceeded the 80% benchmark in the latest field tests, compelling rivals to invest in network optimization to avoid financial penalties.
Key Report Takeaways
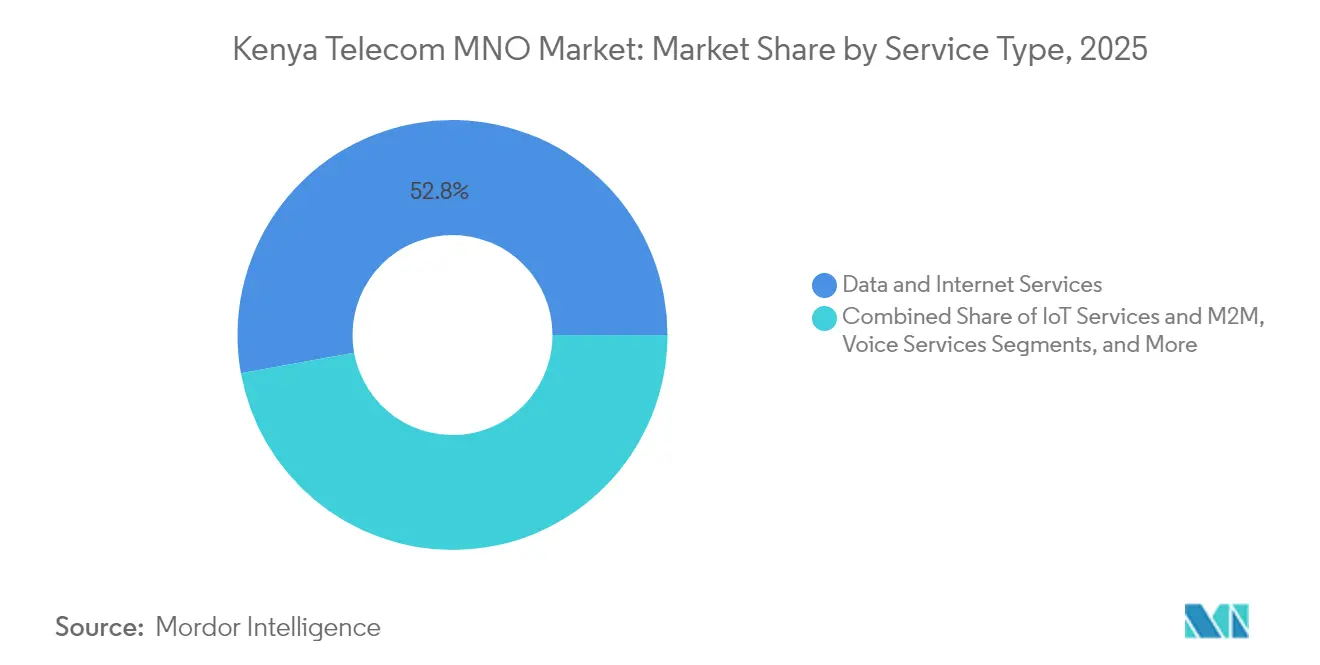
- By service type, Data and Internet Services led with 52.84% of the Kenya Telecom MNO market share in 2025, while IoT and M2M Services are projected to expand at a 3.93% CAGR through 2031.
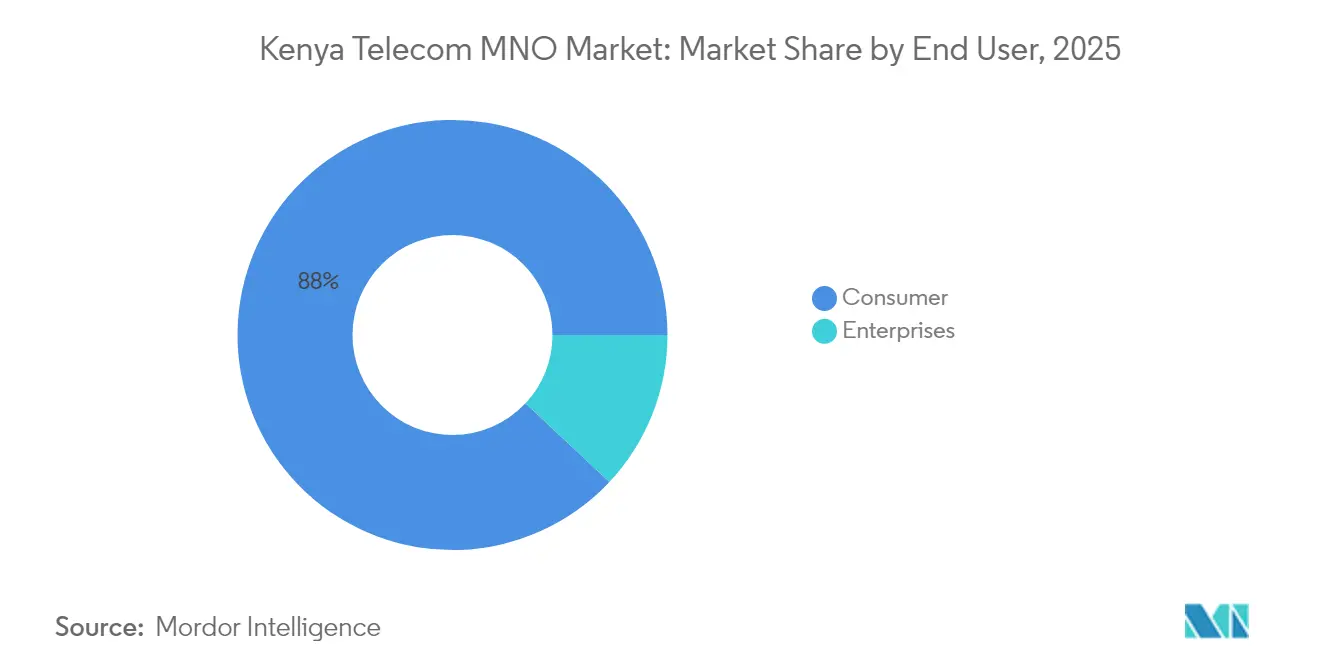
- By end-user, the Consumer segment accounted for an 88.02% share of the Kenya Telecom MNO market size in 2025, whereas Enterprise services are forecast to grow at a 4.62% CAGR through 2031.
Note: Market size and forecast figures in this report are generated using Mordor Intelligence’s proprietary estimation framework, updated with the latest available data and insights as of 2026.
Kenya Telecom MNO Market Trends and Insights
Drivers Impact Analysis*
| Driver | (~) % Impact on CAGR Forecast | Geographic Relevance | Impact Timeline |
|---|---|---|---|
| Rising 4G/5G smartphone penetration fuels data uptake | +1.2% | National, with early gains in Nairobi, Mombasa, Kisumu | Medium term (2-4 years) |
| Expansion of mobile-money–enabled credit and insurance bundles | +0.8% | National, strongest in rural and peri-urban areas | Long term (≥ 4 years) |
| Fibre-to-the-home (FTTH) roll-outs in secondary cities | +0.6% | Secondary cities including Thika, Nakuru, Eldoret | Medium term (2-4 years) |
| Government digital-economy master-plan (e-citizen, e-health) | +0.5% | National, prioritizing underserved counties | Long term (≥ 4 years) |
| Under-sea cable landings lowering international bandwidth cost | +0.3% | National, with coastal landing points advantage | Short term (≤ 2 years) |
| Edge-cloud zones for low-latency enterprise IoT | +0.4% | Urban centers, industrial zones | Medium term (2-4 years) |
| Source: Mordor Intelligence | |||
Rising 4G/5G Smartphone Penetration Fuels Data Uptake
Kenya now sees more than 18 million active 4G devices, and monthly data traffic per smartphone is projected to triple to 17 GB by 2030, creating enduring momentum for the Kenya Telecom MNO market. Safaricom’s “Maisha Poa Ni Digital” campaign subsidizes entry-level 4G devices and bundles, while Airtel Kenya’s May 2025 5G router speed upgrade raised the competitive bar for urban broadband. Both operators deploy AI algorithms for cell-site balancing, which has cut latency by up to 28% in pilot clusters. These network investments position Kenya among the few Sub-Saharan economies where 33% of mobile users are expected to adopt 5G by 2030. As handset prices slide toward the USD 50 threshold, rural uptake is expected to narrow the urban–rural data-consumption gap.
Expansion of Mobile-Money–Enabled Credit and Insurance Bundles
M-PESA processed USD 314 billion in transactions during FY 2025, up 13% YoY, underscoring the payments engine underpinning the Kenya Telecom MNO market. The January 2025 launch of the Ziidi Money Market Fund now allows M-PESA users to invest small balances, expanding financial services beyond payments. Central Bank approval to double the M-PESA wallet ceiling to KES 500,000 supports high-value peer-to-business flows, and Fuliza micro-loans disbursed KES 701 billion in the 12 months to March 2025. Mobile credit and micro-insurance deepen customer stickiness and diversify operator revenue, adding an estimated +0.8% boost to CAGR as customers migrate to higher data tiers to manage digital financial portfolios. [1]Central Bank of Kenya, “Mobile Money Statistical Bulletin 2025,” cbk.go.ke
Fibre-to-the-Home Roll-outs in Secondary Cities
FTTH deployment has extended to 13,590 km of backbone fiber, connecting 25,000 public Wi-Fi hotspots, 1,563 of which are live. [2]Government of Kenya, “BETA Pillar Program Progress Update,” ict.go.ke Liquid Intelligent Technologies now covers 39 counties on wholesale fiber leases, and Safaricom’s Easy50 planar tariff offers SMEs 50 GB at KES 6,000 per month, shrinking enterprise bandwidth costs by 24% year on year. Secondary cities such as Thika recorded 42% YoY traffic growth, signaling pent-up demand outside Nairobi. These roll-outs cut congestion on the main metropolitan core and unlock new revenue streams from enterprise VPN, SD-WAN, and cloud off-take agreements.
Government Digital-Economy Master-Plan (E-citizen, E-health)
Digital public-service portals surged from 350 to 20,985 in under two years, driving incremental traffic across all operator networks. The National Public Key Infrastructure assures transaction security, compelling operators to harden networks with additional TLS certificates and DPI layers. USF allocations totaling KES 837 million connected 896 public secondary schools to broadband, equipping 350,000 students to access e-learning content. UNICEF-supported backhaul links in Turkana bring 40,000 children online, demonstrating aligned public-private investment that raises the baseline for universal access.
Restraints Impact Analysis*
| Restraint | (~) % Impact on CAGR Forecast | Geographic Relevance | Impact Timeline |
|---|---|---|---|
| SIM-card tax hikes and excise duty on data bundles | -0.7% | National, disproportionate impact on low-income segments | Short term (≤ 2 years) |
| Prolonged spectrum fee disputes delaying 5G rural roll-out | -0.5% | Rural areas, secondary cities | Medium term (2-4 years) |
| Dollar liquidity crunch inflating vendor CAPEX | -0.4% | National, affecting infrastructure investments | Short term (≤ 2 years) |
| OTT voice substitution (WhatsApp, Zoom) eroding voice ARPU | -0.3% | Urban areas, youth demographics | Long term (≥ 4 years) |
| Source: Mordor Intelligence | |||
SIM-card Tax Hikes and Excise Duty on Data Bundles
The Finance Bill 2025 enlarges VAT to cover non-resident digital suppliers, and new economic-presence levies could raise average prepaid tariffs by 4% in the first year. While the 2023 budget trimmed internet excise duty to 15%, ongoing fiscal pressure has triggered hikes in SIM replacement fees and compliance surcharges that disproportionately hit low-income users. Telkom Kenya lost 1.1 million subscribers in 2024 after passing on cost increases, showing how fragile market share can be under price-sensitive conditions. USF top-ups partly shield rural users, yet affordability remains a core stumbling block for new data converts.
Prolonged Spectrum Fee Disputes Delaying 5G Rural Roll-out
The Communications Authority scored overall network quality at 72.4% in 2025, with rural Laikipia registering only 54%, in part because operators hesitate to bid aggressively for new spectrum blocks amid fee litigation. The planned hike in satellite ISP charges introduces an additional layer of regulatory uncertainty. While tower-sharing could slash per-site costs by 14%, Kenya lacks a definitive framework for spectrum-sharing reciprocity, slowing the economics of rural 5G. Delays push back projected timeline for sub-1 GHz deployments that IoT agriculture pilots depend on, dampening rural growth potential by an estimated 0.5% of CAGR.
*Our forecasts treat driver/restraint impacts as directional, not additive. The impact forecasts reflect baseline growth, mix effects, and variable interactions.
Segment Analysis
By Service Type: Data Services Drive Revenue Transformation
Data and Internet Services accounted for 52.84% of the Kenya Telecom MNO market in 2025 and remain the primary revenue engine as operators pivot from legacy voice lines. IoT and M2M connectivity, though only a small revenue slice today, is forecast to log 3.93% CAGR to 2031 as logistics, agriculture, and smart-city pilots gain scale, signaling a rising share of the Kenya Telecom MNO market size for enterprise telemetry workloads. Voice and SMS revenues continue a structural decline as WhatsApp and Zoom substitute traditional calls, pulling blended ARPU down by 7% in 2024.
Operators are repackaging OTT partnerships into zero-rating bundles to arrest churn, while competitively priced Pay-TV streaming add-ons feed higher-tier data plans. Safaricom’s USD 500 million edge-computing bet aims to bundle cloud GPU leases with managed connectivity, giving the carrier a first-mover stance in AI inferencing services. Meanwhile, Airtel Kenya collaborates with Starlink for hybrid satellite-terrestrial backhaul, giving it sub-50 ms latency on premium business circuits. These strategic moves reinforce the Kenya Telecom MNO market’s trajectory toward integrated data-centric ecosystems rather than plain-vanilla connectivity.


By End-user: Enterprise Growth Accelerates Digital Transformation
The Consumer base still delivered 88.02% of service revenue in 2025, yet Enterprise demand is growing at 4.62% CAGR as Kenyan SMEs migrate to cloud-first ERP, video-first collaboration, and secure SD-WAN overlays. As a result, Enterprise revenue share of the Kenya Telecom MNO market size is projected to climb from 11.98% in 2025 to 16.42% by 2031. Safaricom’s deeper M-PESA integration with accounting suites and Airtel’s Xtelify sovereign cloud platform are tailored for this demographic shift.
Public-sector digitization is also propelling enterprise uptake: county governments now procure dedicated VPN circuits for e-health, and Kenya Revenue Authority’s e-TIMS system mandates real-time invoice uploads, boosting uplink traffic. Liquid Intelligent Technologies’ pan-African fiber meshing lets multinationals maintain single-vendor SLAs across borders, further stimulating enterprise cross-sell. According to World Bank projections, workforce digital-skills upgrades, backed by USD 50 million in grant funding, will roughly double the potential enterprise TAM by 2030.
Geography Analysis
Kenya’s six under-sea cables provide 45 Tbps of lit capacity, reinforcing Nairobi’s status as an East African traffic hub and creating a concentric revenue pattern around the capital city, which posted 93.9% quality-of-service compliance in 2025. Mombasa leverages direct cable landings to house growing edge data-centers, with IXAfrica’s second 15 MW hall already 60% pre-leased to hyperscalers. Secondary corridors such as the Thika Special Economic Zone see double-digit data-growth rates as fiber trenching along new expressways drops last-mile costs by 18%.
Rural counties lag with average download speeds of 7 Mbps, but USF subventions of KES 2.1 billion are earmarked to build 1,300 new BTS sites, closing the coverage gap for 78 sub-locations deemed uneconomical. UNICEF’s school-connect program in Turkana exhibits how donor partnerships can lift otherwise unserved geographies to broadband parity. The Kenya Telecom MNO market continues to reward operators that redesign capex models around tower-sharing and microwave reuse to reduce rural deployment payback periods to under five years.
Cross-border fiber laterals into Uganda, Rwanda, and Ethiopia transform Kenya into a transit-traffic broker, a role that Safaricom monetizes through its One Network Area roaming plan, which waives incoming call fees for 40 million subscribers. These regional interconnections fortify the Kenya Telecom MNO market as neighboring land-locked states rely on Kenyan gateways for subsea traffic, creating incremental wholesale bandwidth revenue streams.
Competitive Landscape
Safaricom retained a commanding 71.2% subscriber share in 2024, ensuring high market concentration that forces challengers to carve niche territories. Airtel Kenya captures urban youth with aggressive unlimited-data night bundles and pioneered Africa’s first AI-driven spam filter to reduce unwanted SMS by 46% in its first quarter. Telkom Kenya, now fully state-owned after the September 2024 buyout, focuses on wholesale 4G-LTE fixed-wireless to schools and hospitals, leveraging its 800 MHz rural spectrum holdings for cost-efficient coverage. Jamii Telecom (Faiba Mobile) remains a disruptive player in unlimited VoLTE offers, maintaining a lean OPEX model via leased towers.
Satellite disruptors such as Starlink reached capacity in Nairobi by mid-2025 and are lobbying for spectrum fee concessions to broaden rural coverage, injecting additional competitive pressure. In anticipation, Safaricom committed USD 500 million to AI-ready data-center clusters that will co-locate 5G core functions, lowering incremental capacity costs. Airtel’s Xtelify suite introduces a sovereign-cloud overlay to court government procurements wary of data-residency, while Telkom pilots open-RAN trials with parallel rollouts of 400 G backbone rings. Regulatory oversight under the Data Protection Act and stricter QoS scoring adds compliance complexity that favors incumbents with mature risk programs.
Although new entrants nibble at enterprise and rural fringes, Safaricom’s integrated M-PESA–content–connectivity ecosystem sustains high switching costs, underpinning a 71% adjusted EBITDA margin. Yet, the government’s plan to offload up to 10% of its Safaricom stake by June 2026 may introduce more shareholder activism, possibly steering strategic focus onto regional expansion and fintech spin-offs.
Kenya Telecom MNO Industry Leaders
Safaricom PLC
Airtel Kenya Ltd
Telkom Kenya Ltd
Jamii Telecom (Faiba Mobile)
- *Disclaimer: Major Players sorted in no particular order


Recent Industry Developments
- August 2025: Microsoft, BlackRock, and Temasek unveiled the USD 30 billion Project MGX to build an AI hyperscale campus in Nairobi, the largest single ICT investment on the continent.
- May 2025: Safaricom allocated USD 500 million for AI infrastructure spanning three East African countries to support edge-cloud workloads.
- May 2025: The National Treasury signaled intentions to sell up to 10% of the government’s 35% Safaricom stake before Jun 2026, potentially unlocking USD 617.2 million in proceeds.
- March 2025: Safaricom selected Red Hat OpenShift to containerize M-PESA micro-services, enabling real-time scaling for 45 million users.


Kenya Telecom MNO Market Report Scope
Telecom or telecommunication is the long-range transmission of information by electromagnetic means. The telecom MNO market includes in-depth trend analysis of connectivity, such as fixed networks, mobile networks, and telecom towers.
The Kenyan telecom MNO market is segmented by services (voice services (wired and wireless), data and messaging services, OTT, and PayTV services). The market sizes and forecasts are provided in terms of value (USD) for all the above segments.
| Voice Services |
| Data and Internet Services |
| Messaging Services |
| IoT and M2M Services |
| OTT and PayTV Services |
| Other Services (VAS, Roaming and International Services, Enterprise and Wholesale Services, etc.) |
| Enterprises |
| Consumer |
| Service Type | Voice Services |
| Data and Internet Services | |
| Messaging Services | |
| IoT and M2M Services | |
| OTT and PayTV Services | |
| Other Services (VAS, Roaming and International Services, Enterprise and Wholesale Services, etc.) | |
| End-user | Enterprises |
| Consumer |


Key Questions Answered in the Report
How large is the Kenya Telecom MNO market in 2026?
The market stands at USD 3.6 billion and is on course to reach USD 4.35 billion by 2031 at a 3.82% CAGR.
Which service type generates the most revenue?
Data and Internet Services account for 52.84% of total revenue, reflecting user migration from voice to data services.
What segment is growing the fastest?
IoT and M2M connectivity is projected to expand at a 3.93% CAGR through 2031 as businesses deploy more sensor networks.
Who is the leading operator?
Safaricom commands 71.2% subscriber share, supported by its integrated M-PESA financial ecosystem.
How is government policy impacting the sector?
Digital-economy initiatives and USF subsidies are improving rural coverage, while new taxes on SIM cards and data create short-term affordability challenges.
What role do under-sea cables play?
Six subsea systems give Kenya 45 Tbps of lit capacity, positioning the country as East Africa’s connectivity gateway and lowering international bandwidth costs.
Page last updated on:


