Democratic Republic Of The Congo Telecom MNO Market Size and Share
Market Overview
| Study Period | 2019 - 2030 |
|---|---|
| Forecast Data Period | 2025 - 2030 |
| Historical Data Period | 2019 - 2023 |
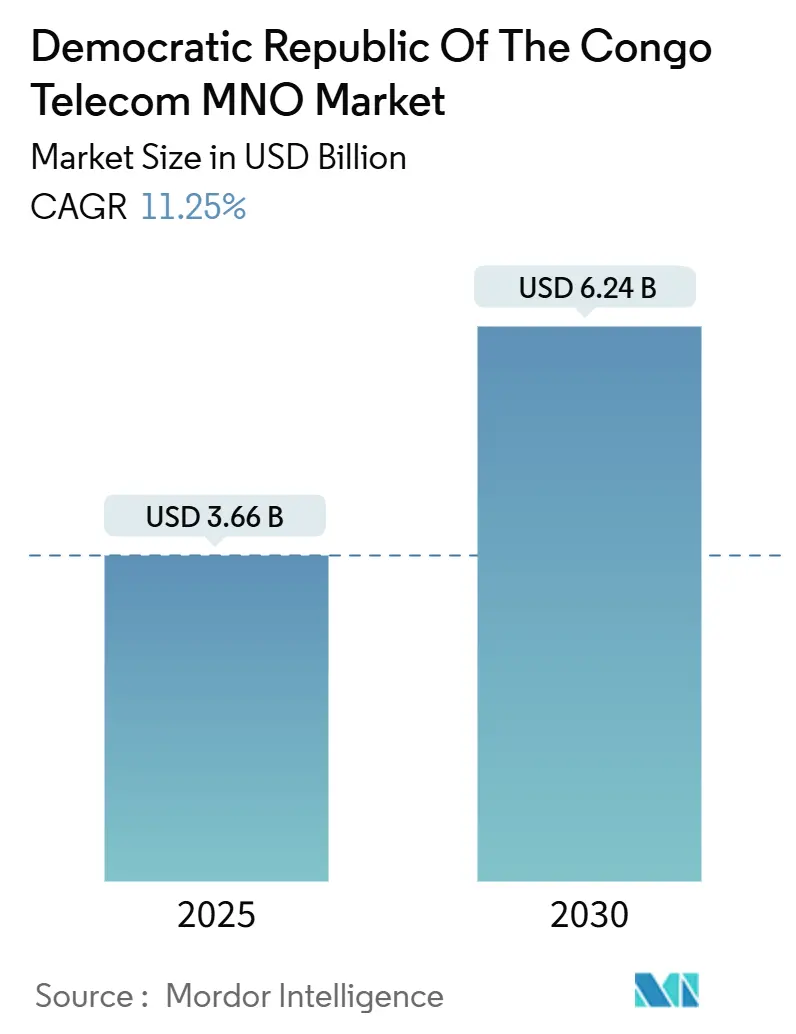
| Market Size (2025) | USD 3.66 Billion |
| Market Size (2030) | USD 6.24 Billion |
| Growth Rate (2025 - 2030) | 11.25% CAGR |
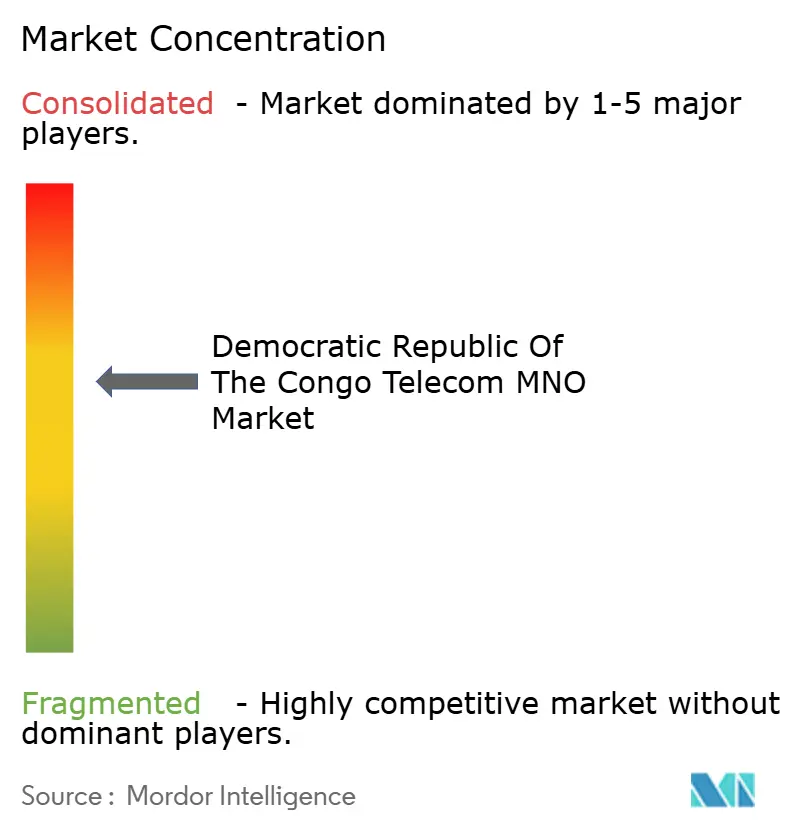
| Market Concentration | Medium |
Major Players *Disclaimer: Major Players sorted in no particular order Image © Mordor Intelligence. Reuse requires attribution under CC BY 4.0. | |
Democratic Republic Of The Congo Telecom MNO Market Analysis by Mordor Intelligence
The Democratic Republic Of The Congo Telecom MNO Market size is estimated at USD 3.66 billion in 2025, and is expected to reach USD 6.24 billion by 2030, at a CAGR of 11.25% during the forecast period (2025-2030). In terms of subscriber volume, the market is expected to grow from 64.01 million Subscribers in 2025 to 99.22 million Subscribers by 2030, at a CAGR of 9.16% during the forecast period (2025-2030).
Sustained investment in fiber backbones, rural tower rollouts, and mobile money ecosystems is shifting the revenue model from pure connectivity toward digital services monetization. Enterprise digitization and the integration of satellite connectivity following Starlink’s 2025 entry are enlarging the addressable customer base, while cross-border fiber corridors are cutting wholesale transit costs and improving international bandwidth economics. Competitive intensity remains relatively contained because Vodacom Congo, Orange RDC, and Airtel DRC together serve about 85% of mobile subscribers, enabling disciplined pricing in data bundles and enterprise solutions Vodacom. However, taxation reaching 34% of operator revenue and recurring electricity shortages continue to dilute EBITDA margins, particularly on rural sites.
Key Report Takeaways
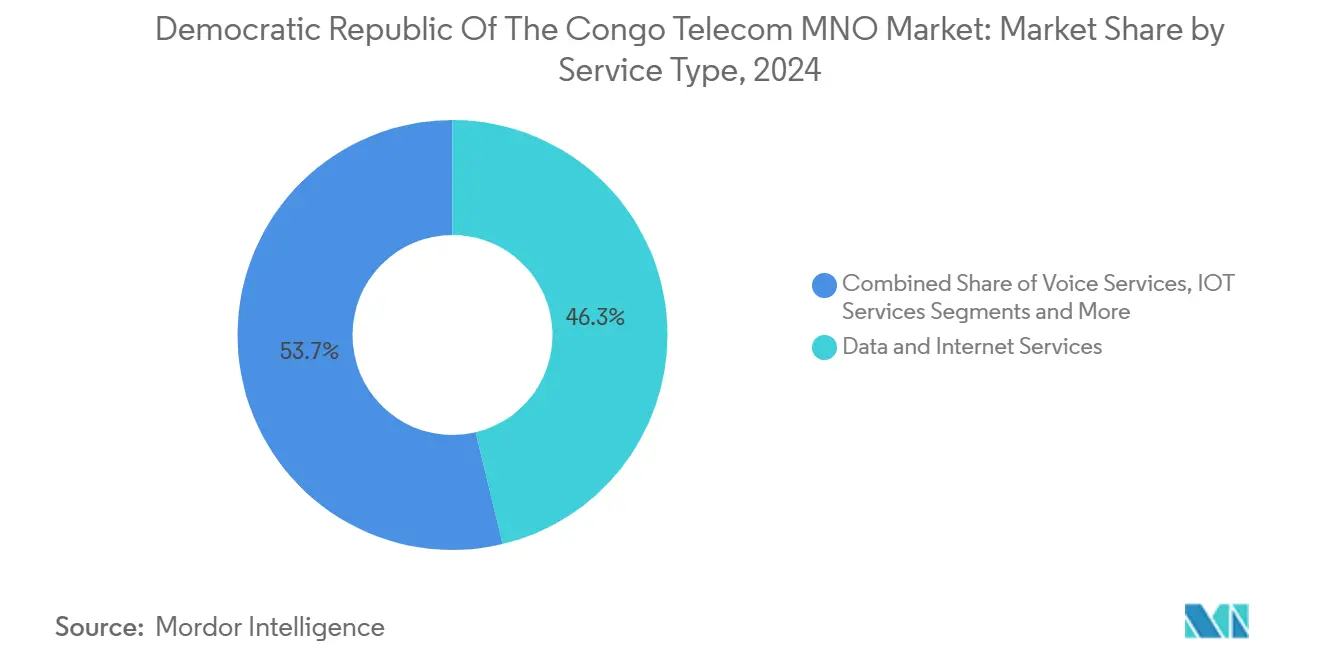
- By service type, data services led with 46.27% of the Democratic Republic of Congo telecom market share in 2024, while IoT services are set to expand at a 11.33% CAGR through 2030.
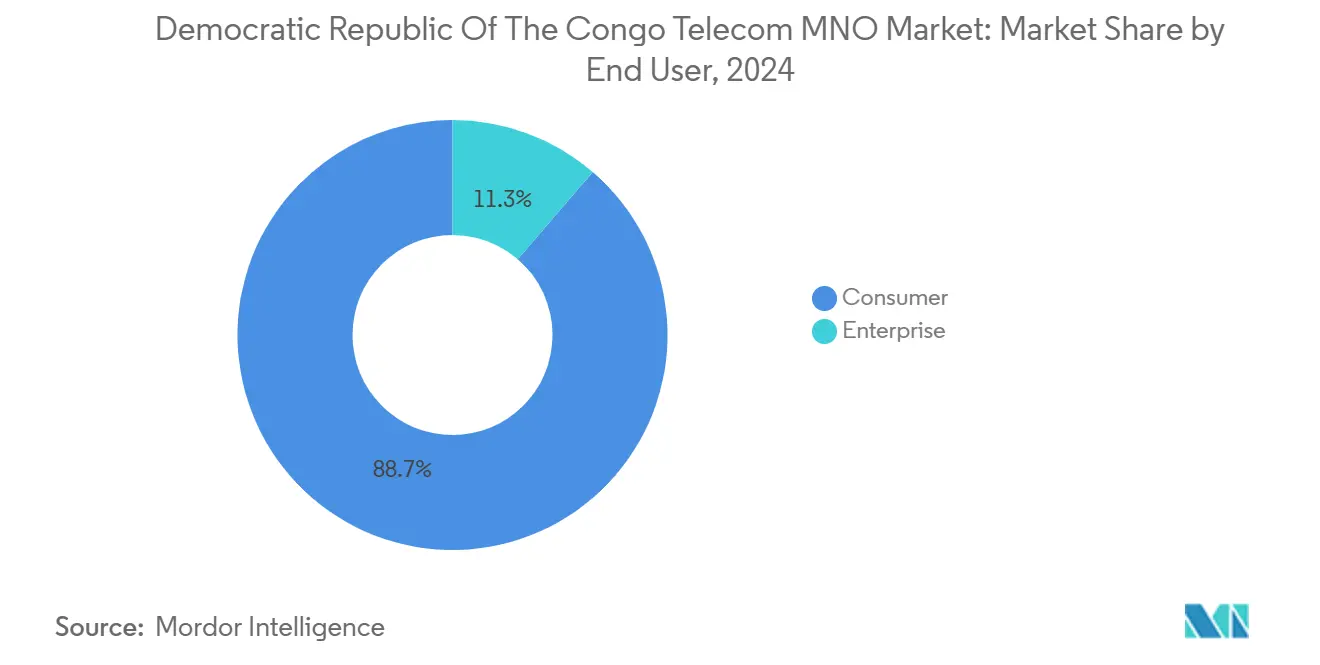
- By end user, the consumer segment held 88.69% of revenue in 2024; the enterprise segment records the fastest trajectory at a 12.20% CAGR to 2030.
Democratic Republic Of The Congo Telecom MNO Market Trends and Insights
Drivers Impact Analysis*
| Driver | (~) % Impact on CAGR Forecast | Geographic Relevance | Impact Timeline |
|---|---|---|---|
| Rising smartphone penetration and affordable Android handsets | +0.8% | National, concentrated in Kinshasa, Lubumbashi, Goma | Medium term (2-4 years) |
| Expanding 4G/4.5G coverage in secondary cities | +0.6% | Provincial capitals and mining centers | Medium term (2-4 years) |
| Enterprise demand for MPLS and dedicated Internet access | +0.4% | Kinshasa, Lubumbashi, Kolwezi business districts | Short term (≤ 2 years) |
| New wholesale fiber routes via Angola and Zambia corridors | +0.3% | Western and southern provinces | Long term (≥ 4 years) |
| Mobile money ecosystem integration with data bundles | +0.5% | National, rural areas priority | Short term (≤ 2 years) |
| Post-conflict donor-funded rural connectivity projects | +0.2% | Eastern provinces, post-conflict zones | Long term (≥ 4 years) |
| Source: Mordor Intelligence | |||
Rising Smartphone Penetration and Affordable Android Handsets
Handset prices below USD 50 are accelerating smartphone uptake, particularly outside major cities, by lowering entry barriers through operator-financed payment plans GSMA. Orange RDC’s device-plus-data bundles delivered 18% revenue growth in 2024, highlighting the monetization upside. Average monthly data consumption rises from 200 MB on feature phones to 2.5 GB on smartphones, and mobile money transactions per user multiply 3.5 times.[1]Orange RDC, “2024 Annual Report,” orange.cd
Expanding 4G/4.5G Coverage in Secondary Cities
4G expansion in mining hubs and agricultural towns unlocks higher-value usage, with ARPU 25-30% above rural-only sites. Vodacom’s satellite backhaul with Intelsat enables cost-efficient roll-out in remote terrain Developing Telecoms. Retrofit of existing 3G sites trims incremental capex by roughly 35%, while automated mining operations in Kolwezi require high-bandwidth links to Ivanhoe Mines
Enterprise Demand for MPLS and Dedicated Internet Access
Multinational miners and financial institutions drive premium connectivity, underpinning a 4.88% CAGR in enterprise revenue. MPLS connections cut production downtime and enable remote equipment control, reducing operating costs by up to 20%. Higher margins—40-50% above consumer ARPU—justify continued investment despite lower user numbers.
Mobile Money Ecosystem Integration with Data Bundles
Mobile financial platforms process substantial transaction value across Sub-Saharan Africa, with bundle offers generating 35% higher ARPU. Orange Money integration cuts churn by roughly one-quarter and attracts diaspora remittances through cross-border wallets.
Restraints Impact Analysis*
| Restraint | (~) % Impact on CAGR Forecast | Geographic Relevance | Impact Timeline |
|---|---|---|---|
| Prohibitive import duties on network equipment | -0.9% | National, affecting all operators | Short term (≤ 2 years) |
| Persistent electricity shortages raising opex | -0.7% | National, acute in rural areas | Medium term (2-4 years) |
| Armed-group vandalism of fiber backbones in the east | -0.4% | Eastern provinces (North Kivu, South Kivu) | Medium term (2-4 years) |
| Dollar-denominated license and spectrum fees vs. local-currency ARPU | -0.3% | National regulatory framework | Long term (≥ 4 years) |
| Source: Mordor Intelligence | |||
Prohibitive Import Duties on Network Equipment
Tariffs of 25-35% inflate capex, delaying 5G readiness and limiting rural rollouts. Operators often resort to refurbished kit or extended asset life cycles, which risks capacity fatigue amid rising data demand.[2]GSMA, “Handset Affordability in Sub-Saharan Africa,” gsma.com
Persistent Electricity Shortages Raising Opex
Diesel generation swallows up to 20% of operating costs, with grid reliability below 40% Clear Blue Technologies. Solar-battery hybrids promise relief but require sizeable upfront capital, stretching already pressured balance sheets.
*Our forecasts treat driver/restraint impacts as directional, not additive. The impact forecasts reflect baseline growth, mix effects, and variable interactions.
Segment Analysis
By Service Type: Data Services Drive Revenue Transformation
Data services held 37.12% of Democratic Republic of Congo telecom market share in 2024 and remain the largest revenue contributor. Mobile data consumption expanded 40% year-on-year, reaching 2.8 GB per subscriber. In parallel, IoT services exhibit a 4.02% CAGR, catalyzed by mining automation and emerging smart-city pilots in Kinshasa. Voice revenues continue to contract, yet bundles that integrate voice, data, and mobile money sustain loyalty. OTT video and Pay-Tv uptake reinforces the pivot toward platform-based monetization.
A widening service mix is lifting margins. Enterprise data plans generate ARPU about 45% higher than the consumer average because of SLA requirements. Messaging and value-added services provide incremental pockets of growth despite substitution pressures from OTT chat applications. Connectivity is shifting from a stand-alone commodity toward an enabler of adjacent fintech, content, and IoT revenue streams, enhancing the Democratic Republic of Congo telecom market’s overall resilience.[3]Stream TV Insider, “Canal+ boosts local content to counter Netflix in Africa,” streamtvinsider.com


By End User: Consumer Segment Drives Volume Growth
Consumers contributed 69.82% of revenue in 2024, propelled by smartphone adoption and mobile finance uptake. Average revenue per user climbed 12% because of higher data consumption and integrated financial services. Enterprises, although representing a smaller subscriber base, expand to 4.88% CAGR as mining, banking, and government digital projects scale.
Enterprise ARPU can run three to four times that of the consumer segment, reflecting dedicated bandwidth and SLA premiums. Mobile money business wallets represent 25% of total transactions but deliver 40% of fintech revenue. Shared infrastructure further blurs consumer and enterprise lines, enabling economies of scale in coverage extension and backbone upgrades, thereby bolstering the broader Democratic Republic of Congo telecom market.
Geography Analysis
Kinshasa and Katanga provinces together account for nearly 60% of sector revenue while hosting 35% of the population. Mobile penetration surpasses 80% in these urban hubs versus 35-40% in rural zones, guiding operators’ capex allocation toward high-demand clusters. Mining-rich regions such as Lualaba and Haut-Katanga attract enterprise-grade fiber and dedicated microwave links, driven by copper and cobalt output growth Ivanhoe Mines.
Eastern provinces continue to lag because of rebel activity that periodically cuts fiber backbones, delaying 4G rollouts. Satellite backhaul and microwave redundancy partially offset such outages, but service reliability gaps persist. Cross-border projects like the Lobito Corridor have lowered wholesale bandwidth costs by 25-30%, improving margin headroom for international traffic.
Western provinces benefit from new submarine cable landings in Angola, providing alternative routes to Europe and the Americas. Rural connectivity relies on donor-funded schemes and universal service levies, fostering low-cost solar-powered towers to bridge digital divides. Climate-related floods increasingly challenge network resilience and accelerate investment in hardened infrastructure Carnegie Endowment. Regional revenue and usage imbalances are expected to narrow gradually as regulatory incentives push operators to expand affordable coverage beyond the most profitable corridors of the Democratic Republic of Congo telecom market.
Competitive Landscape
The market is led by four mobile network operators, with Vodacom Congo holding 21 million subscribers and leveraging the most extensive 4G footprint. Orange RDC and Airtel DRC trail closely, focusing on mobile money innovation and data-centric bundles to lift ARPU. Together, the top three command roughly 85% of subscribers, reinforcing a moderately concentrated market structure.
Collaboration is rising in passive infrastructure, as tower-sharing and fiber co-builds reduce duplicative capex and accelerate roll-out to underserved zones. NuRAN Wireless’s network-as-a-service pact with orange targets 2,000 solar-powered rural sites. Satellite entrants like Starlink intensify rivalry for enterprise and remote-area customers, prompting terrestrial operators to integrate satellite backhaul or pivot toward value-added digital services.
Regulatory shifts—ranging from spectrum fees to service-quality mandates—shape competitive behavior. Recent directives from ARPTC press Airtel and MTN to remedy network performance lapses. Operators with diversified revenue paths, deep capital pools, and robust wholesale partnerships remain best positioned to capitalize on growth segments and sustain their standing within the Democratic Republic of Congo telecom market
Democratic Republic Of The Congo Telecom MNO Industry Leaders
Vodacom Congo
Airtel DRC
Orange DRC
Africell DRC
- *Disclaimer: Major Players sorted in no particular order

Recent Industry Developments
- May 2025: Starlink officially launched satellite internet services in the Democratic Republic of Congo with starter pricing of USD 389 for hardware and USD 50 monthly subscription, introducing fresh competition for remote broadband.
- June 2024: SOCOF SA and APCSC agreed to deploy 7,000 km of optical fiber along new roads under a USD 7 billion contract
- September 2024: Clear Blue Technologies secured contracts to supply hybrid renewable power for rural telecom sites.


Democratic Republic Of The Congo Telecom MNO Market Report Scope
| Voice Services |
| Data and Internet Services |
| Messaging Services |
| IoT and M2M Services |
| OTT and PayTV Services |
| Other Services (VAS, Roaming and International Services, Enterprise and Wholesale Services, etc.) |
| Enterprises |
| Consumer |
| Service Type | Voice Services |
| Data and Internet Services | |
| Messaging Services | |
| IoT and M2M Services | |
| OTT and PayTV Services | |
| Other Services (VAS, Roaming and International Services, Enterprise and Wholesale Services, etc.) | |
| End-user | Enterprises |
| Consumer |


Key Questions Answered in the Report
Who are the main competitors in the Democratic Republic of Congo telecom industry ?
Vodacom Congo, Orange RDC, and Airtel DRC together serve about 85% of subscribers, while Starlink is emerging in satellite broadband.
What are the biggest challenges for network expansion in the country?
High import duties, unreliable grid electricity, and security-related fiber vandalism raise capex and opex, delaying rural rollouts.
How will cross-border fiber projects influence connectivity costs?
New routes such as the Lobito Corridor are already reducing international bandwidth costs by roughly 25-30%, supporting more affordable data pricing and improved margins.
Which segment holds the highest Democratic Republic of Congo telecom market share?
Data services lead with 46.27% of revenue as of 2024, reflecting the shift toward mobile internet demand.
Page last updated on:


