Botswana Telecom MNO Market Size and Share
Market Overview
| Study Period | 2019 - 2030 |
|---|---|
| Forecast Data Period | 2025 - 2030 |
| Historical Data Period | 2019 - 2023 |
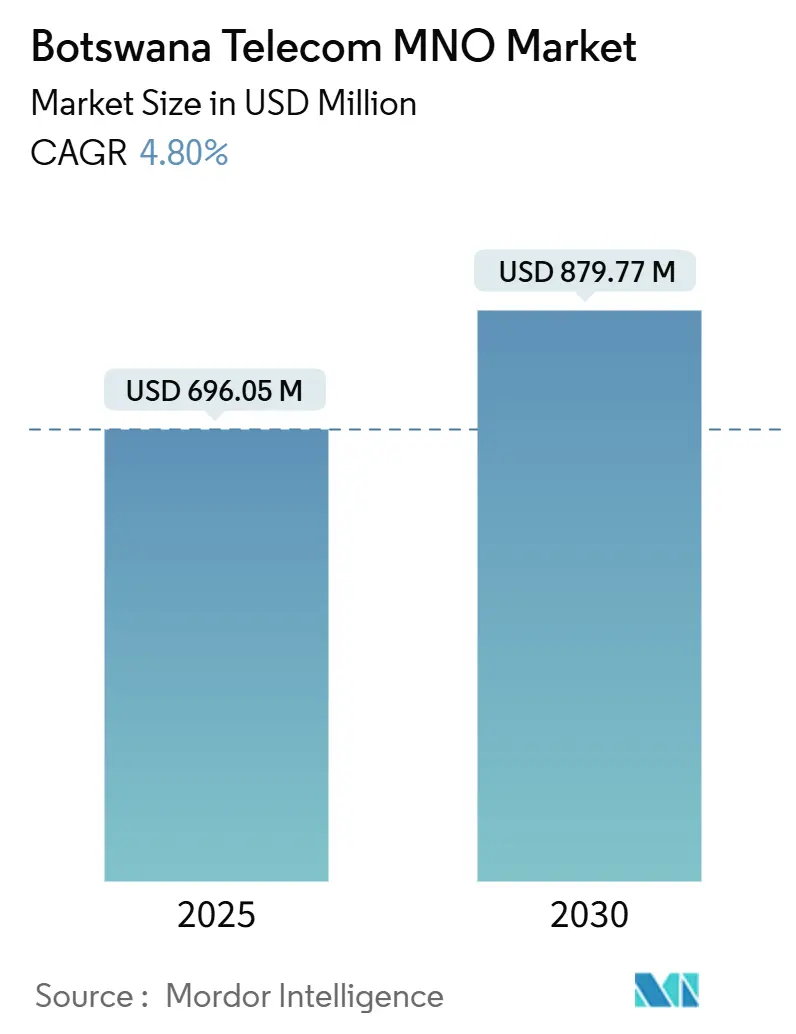
| Market Size (2025) | USD 696.05 Million |
| Market Size (2030) | USD 879.77 Million |
| Growth Rate (2025 - 2030) | 4.80% CAGR |
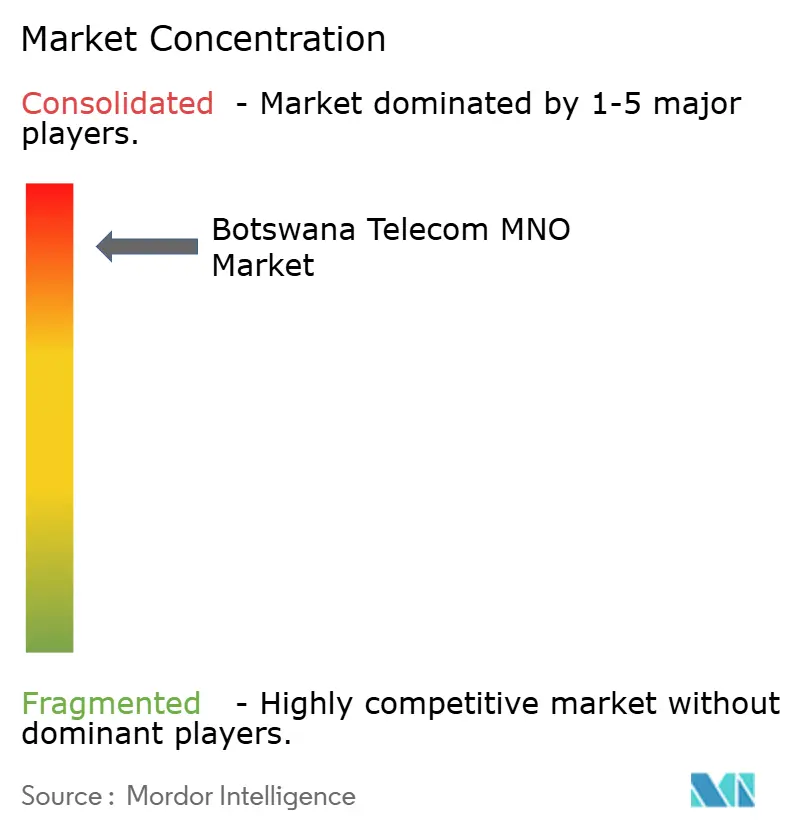
| Market Concentration | High |
Major Players *Disclaimer: Major Players sorted in no particular order Image © Mordor Intelligence. Reuse requires attribution under CC BY 4.0. | |
Botswana Telecom MNO Market Analysis by Mordor Intelligence
The Botswana Telecom MNO Market size is estimated at USD 696.05 million in 2025, and is expected to reach USD 879.77 million by 2030, at a CAGR of 4.80% during the forecast period (2025-2030). In terms of subscriber volume, the market is expected to grow from 5.40 million Subscribers in 2025 to 7 million Subscribers by 2030, at a CAGR of 5.10% during the forecast period (2025-2030).
The modest expansion underscores a mature environment where mobile data revenues offset voice‐service decline while infrastructure upgrades and digital services unlock incremental growth. Competitive intensity revolves around three nationwide mobile network operators that keep prices in check yet drive innovation through 4G, 5G and satellite broadband deployments. Data services already dominate revenue pools and are poised to deepen their contribution as smartphone adoption increases and BoFiNet’s wholesale fiber lowers access costs. Enterprise digital transformation, especially in mining and financial services, supports the fastest-growing use cases such as IoT, cloud connectivity and mobile money. Structural headwinds include small population size, elevated operating costs, saturated mobile penetration and constrained household income, but supportive regulation and state-backed backbone projects continue to create targeted growth pockets.
Key Report Takeaways
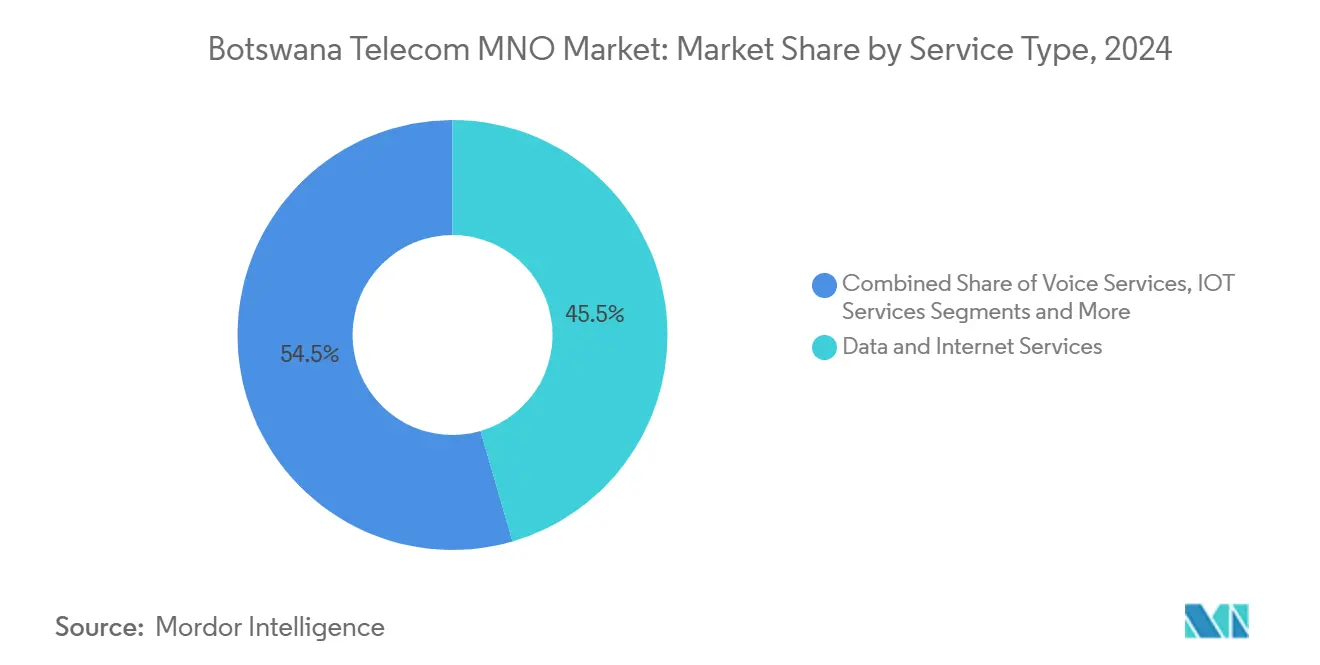
- By service type, data services led with 45.50% revenue share in 2024, while IoT services within this category are projected to expand at a 4.72% CAGR to 2030.
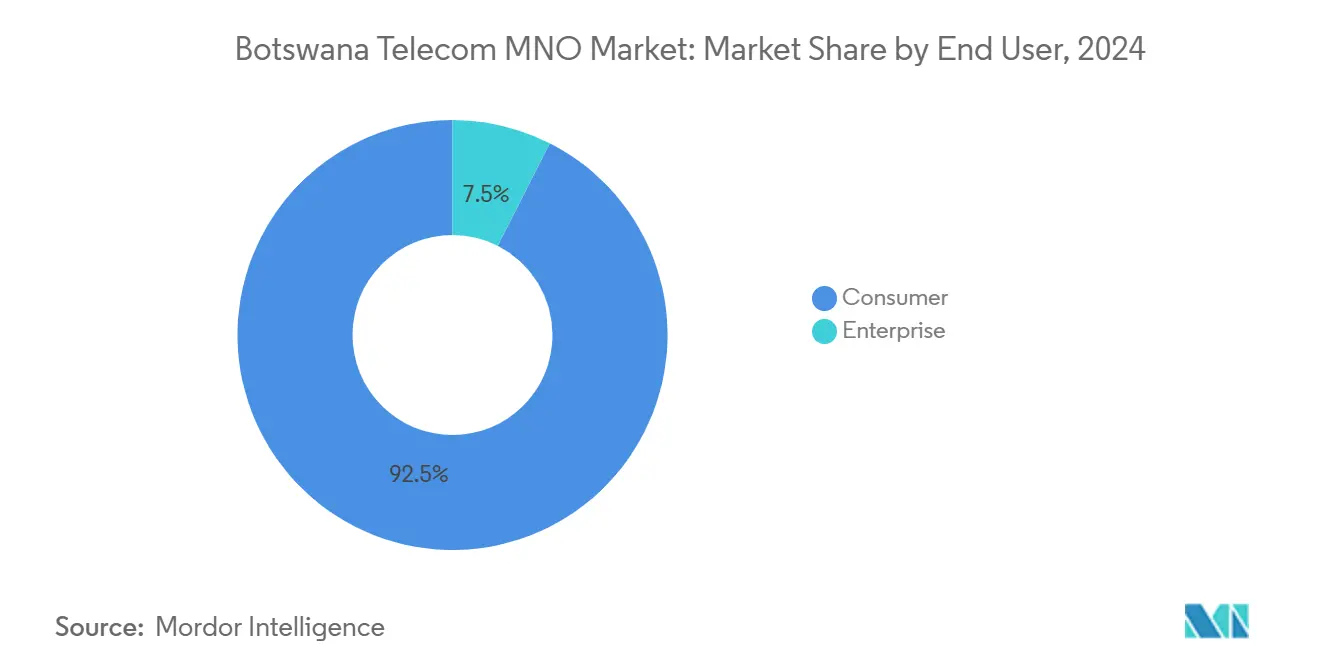
- By end user, the consumer segment captured 92.54% revenue share in 2024, whereas enterprise services are set to post the highest 7.46% CAGR through 2030.
Botswana Telecom MNO Market Trends and Insights
Drivers Impact Analysis*
| Driver | (~) % Impact on CAGR Forecast | Geographic Relevance | Impact Timeline |
|---|---|---|---|
| Rising mobile data consumption and smartphone penetration | +0.4% | National (urban focus) | Medium term (2-4 years) |
| Expansion of 4G/5G coverage and new spectrum auctions | +0.3% | National (cities first) | Long term (≥ 4 years) |
| Government-backed BoFiNet fiber rollouts | +0.2% | National (rural priority) | Long term (≥ 4 years) |
| Enterprise demand for IoT and cloud connectivity | +0.2% | Urban and mining regions | Medium term (2-4 years) |
| Entry of LEO satellite broadband (Starlink) | +0.1% | Rural and remote areas | Short term (≤ 2 years) |
| Mobile money friendly fintech rules | +0.1% | National | Medium term (2-4 years) |
| Source: Mordor Intelligence | |||
Rising Mobile Data Consumption and Smartphone Penetration
Mobile data already produces nearly 70% of total data revenue and continues to rise as smartphone ownership spreads across urban and rural districts. A 173% mobile penetration rate implies multiple SIMs per person, and 91.2% of those connections are broadband-enabled, making video streaming, mobile commerce and social-media use habitual. Orange Botswana leverages its new 5G footprint—now covering 30% of the population—to deliver download speeds that often exceed fixed alternatives, further propelling data usage.[1]GSMA, “Mobile Economy Sub-Saharan Africa 2025,” gsma.com
Expansion of 4G/5G Coverage and New Spectrum Auctions
Continuous network modernization supports coverage and capacity goals. Orange Botswana’s 5G activation in September 2024 established a first-mover advantage, while forthcoming spectrum releases are expected to level the field for rivals. GSMA projects half of Sub-Saharan Africa’s mobile connections will be on 4G by 2030, illustrating the region’s shift toward higher-bandwidth standards.[2]U.S. Department of Commerce, “Botswana Information & Communication Technology,” trade.gov
Government-Backed BoFiNet Fiber Rollouts Lowering Wholesale Costs
BoFiNet’s national fiber backbone reduces wholesale tariffs, enabling smaller retail ISPs to connect underserved areas and compelling mobile operators to upgrade backhaul links. Projects include a neutral data center and fiber laterals that raise 4G population coverage from 56% to 90%.
Enterprise Demand for IoT and Cloud Connectivity Solutions
IoT revenues, though modest, now expand at the fastest 2.04% CAGR as mining, logistics and retail firms adopt remote-monitoring and telemetry solutions. BTC’s March 2025 decision to modernize its charging and billing stack with Amdocs exemplifies operator strategies to serve complex B2B and cloud workloads.
Restraints Impact Analysis*
| Restraint | (~) % Impact on CAGR Forecast | Geographic Relevance | Impact Timeline |
|---|---|---|---|
| High energy and operating costs | -0.3% | National (rural amplified) | Long term (≥ 4 years) |
| Low disposable income and unemployment | -0.2% | National (rural, peri-urban) | Medium term (2-4 years) |
| New data-protection compliance costs | -0.1% | National | Short term (≤ 2 years) |
| Saturated mobile SIM penetration | -0.1% | National | Long term (≥ 4 years) |
| Source: Mordor Intelligence | |||
High Energy and Operating Costs Keeping Tariffs Elevated
Telecom base stations and data centers rely on electricity that is partly imported and priced above regional averages. The national utility supplies only 20% of consumption locally, leaving operators exposed to high input costs that curb tariff reductions and discourage rural expansion.[3]Botswana Power Corporation, “Corporate Profile 2025,” bpc.bw
Low Disposable Income and Unemployment Limiting Premium Uptake
Unemployment above 20% and sluggish GDP growth weigh on household budgets. The price of Starlink’s hardware at USD 363 and a USD 52 monthly fee highlights affordability gaps, especially in remote districts where income levels lag national averages.
*Our forecasts treat driver/restraint impacts as directional, not additive. The impact forecasts reflect baseline growth, mix effects, and variable interactions.
Segment Analysis
By Service Type: Data Services Drive Revenue Growth
Data services already account for 35.41% of 2024 revenue, securing the largest slice of the Botswana telecom market. Within this pool, mobile data alone command 69.88% thanks to smartphone diffusion and competitive bundles. The Botswana telecom market size for data services linked to IoT is projected to widen at 2.04% CAGR, outpacing voice and messaging segments. Operators monetize the surge through tiered bundles, zero-rated social packages and attack the fixed broadband domain with 5G fixed-wireless offers.
The declining cost per gigabyte and enhanced backhaul from BoFiNet’s fiber backbone favor heavier usage, while satellite broadband provides niche high-throughput options for farms and lodges outside fiber footprints. Legacy SMS and MMS continue losing ground to OTT platforms, but operators hedge by integrating mobile money, content and credit products, binding subscribers into larger digital ecosystems.


By End User: Consumer Segment Dominates Despite Enterprise Growth
Households control 71.24% of telecom outlays as prepaid SIM behavior drives volume. The Botswana telecom market size attached to enterprise services will nevertheless increase at 2.94% CAGR as mining firms, banks and public agencies digitalize operations. Large campuses order dedicated fiber or microwave loops and tap private-LTE for wide-area control networks.
BTC’s convergent billing overhaul facilitates bespoke service-level agreements and advanced self-service portals that big companies demand. SMEs follow with packaged broadband plus cloud POS systems, riding government programs that encourage e-commerce and e-tax compliance. Consumer momentum remains anchored in affordable smartphones, mobile money and entertainment streaming, but enterprise applications diversify revenue sources and smooth cyclical fluctuations tied to commodity exports.
Geography Analysis
Urban agglomerations such as Gaborone and Francistown generate the bulk of traffic and ARPU thanks to population density and higher income levels. The Botswana telecom market therefore intensively overlays these corridors with 4G, fiber and the country’s inaugural 5G clusters. Orange Botswana’s launch delivered immediate coverage to 30% of citizens concentrated in these hubs.
Rural districts spanning the Kalahari witness slower network economics. BoFiNet addresses the deficit via an open-access backbone and government funding, enabling smaller ISPs to light fiber spurs. The Botswana telecom market share for rural data remains modest yet climbs as hardware subsidies, community Wi-Fi and satellite broadband narrow the digital divide.
International gateways through South Africa, Namibia and Zambia position Botswana as a regional transit node, improving resilience and lowering wholesale IP transit costs. Cross-border fiber enables mining companies near the Okavango and Central Kalahari to integrate SCADA and IoT feeds back to headquarters. Meanwhile, the Data Protection Act, effective January 2025, harmonizes privacy rules with neighboring SADC members, smoothing service portability for cross-border corporates.
Competitive Landscape
Competition centers on Orange Botswana, Mascom Wireless and BTC’s be Mobile brand, all offering nationwide GSM, LTE and mobile money. Orange Botswana’s 43% subscriber lead stems from its early 5G gambit and bundled OTT partnerships. Mascom counters with a storied prepaid base and network upgrades in mining belts, while BTC leverages its wholesale fiber assets to sell converged packages.
Strategic differentiation now rests on platform modernization, ecosystem partnerships and rural coverage. BTC’s Amdocs roll-out stitches together mobile, fixed and fintech billing, slashing provisioning times and enabling slice-based 5G offers. Orange extends roaming and content deals across its eighteen-country footprint, enriching local products with global scale.
Starlink’s August 2024 start injects fresh rivalry in remote broadband, but its pricing gap restricts immediate substitution. Still, terrestrial operators accelerate fiber-to-tower builds and fixed-wireless rollouts to pre-empt churn. Regulatory clarity on spectrum renewals and tower-sharing frameworks supports capital-efficiency, while cybersecurity and data-protection mandates shape product roadmaps.
Botswana Telecom MNO Industry Leaders
Mascom Wireless (Pty) Limited
Orange Botswana Pty Limited
BTC Mobile
- *Disclaimer: Major Players sorted in no particular order

Recent Industry Developments
- March 2025: BTC selected Amdocs to modernize its convergent charging and billing platform, enabling advanced B2B, 5G and cloud propositions.
- January 2025: Botswana’s Data Protection Act 2024 entered force, mandating breach-reporting within 72 hours and DPO appointments for large-scale processors.
- June 2024: Liquid Intelligent Technologies activated the Gaborone metro ring and reported 10.3% year-on-year revenue growth, extending cloud and cyber offers to enterprises.
- November 2022: Orange Botswana launched commercial 5G covering 30% of citizens and offering baseline speeds of 15 Mbps for fixed-wireless access.


Botswana Telecom MNO Market Report Scope
| Voice Services |
| Data and Internet Services |
| Messaging Services |
| IoT and M2M Services |
| OTT and PayTV Services |
| Other Services (VAS, Roaming and International Services, Enterprise and Wholesale Services, etc.) |
| Enterprises |
| Consumer |
| Service Type | Voice Services |
| Data and Internet Services | |
| Messaging Services | |
| IoT and M2M Services | |
| OTT and PayTV Services | |
| Other Services (VAS, Roaming and International Services, Enterprise and Wholesale Services, etc.) | |
| End-user | Enterprises |
| Consumer |


Key Questions Answered in the Report
What role does BoFiNet play in telecom growth?
BoFiNet’s wholesale fiber network lowers backhaul costs, raises 4G coverage from 56% to 90% and supports new entrants in underserved regions.
How affordable is satellite broadband in Botswana?
Starlink hardware costs USD 363 with a USD 52 monthly fee, making it viable for some remote users but expensive for many rural households.
Why is market growth modest despite new technologies?
Small population size, saturated mobile penetration and high energy costs temper overall revenue expansion, resulting in a 1.09% forecast CAGR to 2030.
Which operator leads the Botswana telecom market?
Orange Botswana leads with roughly 43% subscriber share following its 5G launch covering 30% of the population.
Page last updated on:


