
Workflow Automation Market Size and Share
Market Overview
| Study Period | 2020 - 2031 |
|---|---|
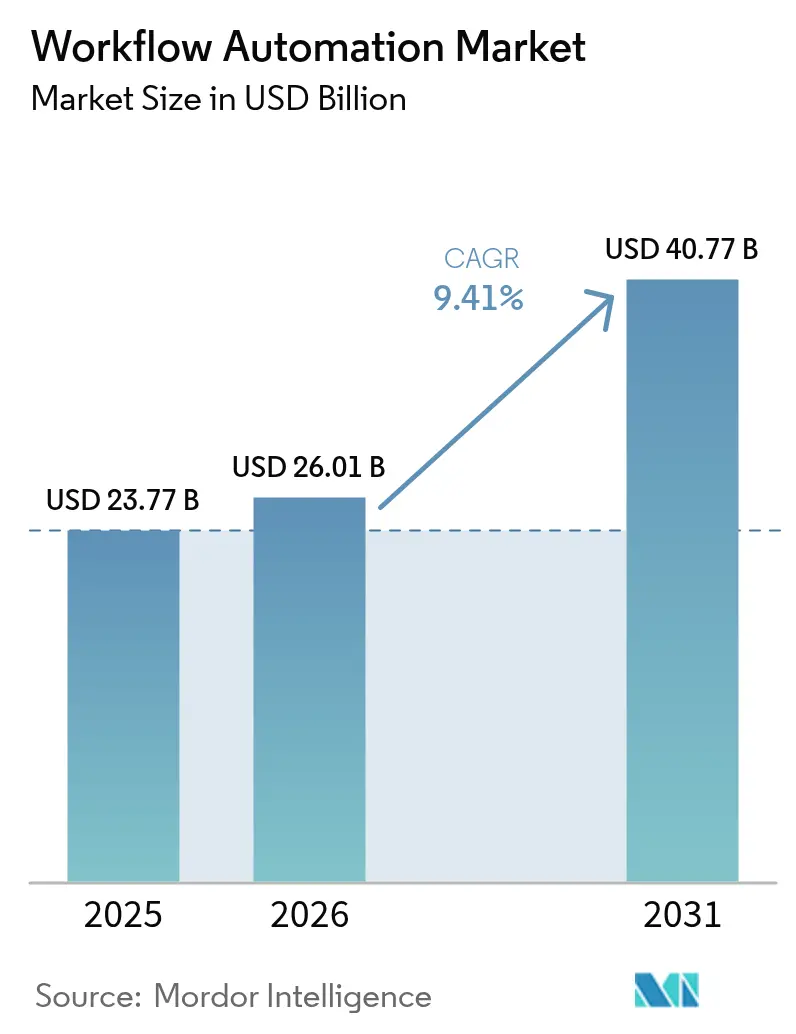
| Market Size (2026) | USD 26.01 Billion |
| Market Size (2031) | USD 40.77 Billion |
| Growth Rate (2026 - 2031) | 9.41 % |
| Fastest Growing Market | Asia-Pacific |
| Largest Market | North America |
| Market Concentration | Medium |
Major Players *Disclaimer: Major Players sorted in no particular order Image © Mordor Intelligence. Reuse requires attribution under CC BY 4.0. | |
Workflow Automation Market Analysis by Mordor Intelligence
The workflow automation market size was valued at USD 23.77 billion in 2025 and estimated to grow from USD 26.01 billion in 2026 to reach USD 40.77 billion by 2031, at a CAGR of 9.41% during the forecast period (2026-2031). Momentum stems from rising enterprise digitalization budgets, real-time edge workflows, and the fusion of artificial intelligence with robotic process automation. Vendors are packaging low-code design, process mining, and orchestration into unified suites, permitting faster deployments across finance, healthcare, and manufacturing. Cloud-first strategies remain dominant, but hybrid models are accelerating as regulators tighten data-sovereignty rules. Competitive intensity is steady: large platform providers defend share through vertical templates while specialist vendors target underserved edge and compliance niches.
Key Report Takeaways
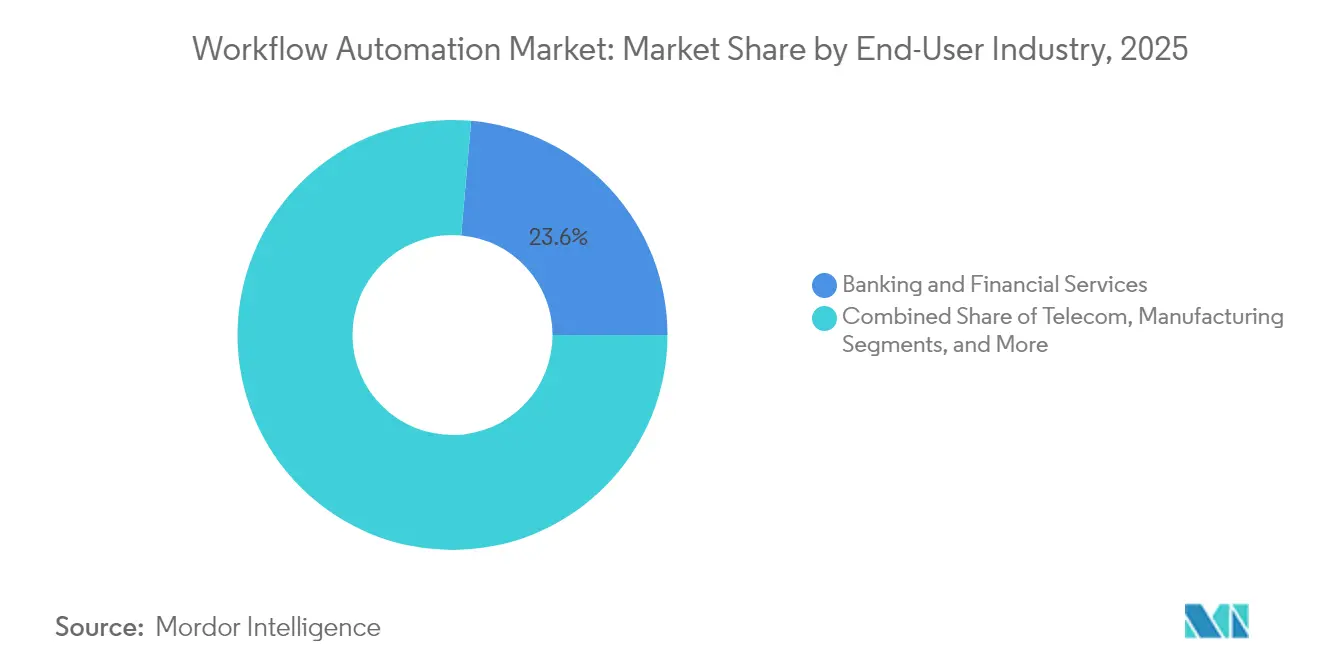
- By end-user industry, Banking and Financial Services held a 23.62% workflow automation market share in 2025, whereas Healthcare and Pharmaceuticals is projected to compound at an 11.22% CAGR through 2031.
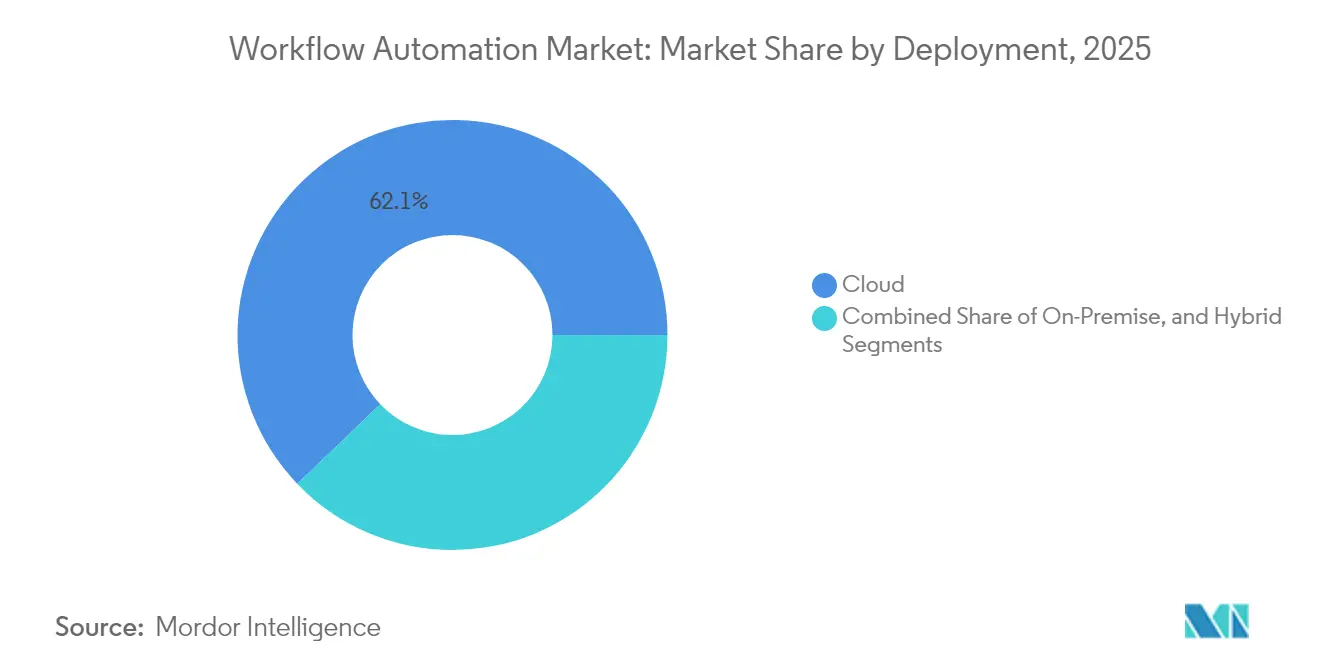
- By deployment, cloud captured 62.15% of the workflow automation market size in 2025, while hybrid configurations are expected to expand at a 10.08% CAGR between 2026-2031.
- By solution, software platforms commanded 66.55% revenue share of the workflow automation market size in 2025, and robotic process automation software is forecast to rise at a 9.95% CAGR through 2031.
- By organization size, large enterprises generated 71.05% of revenue in 2025, but small and medium-sized enterprises are on track for a 10.19% CAGR over the outlook period.
- By geography, North America contributed 34.22% of global revenue in 2025; Asia Pacific is expected to post the fastest regional CAGR at 9.92% through 2031.
Note: Market size and forecast figures in this report are generated using Mordor Intelligence’s proprietary estimation framework, updated with the latest available data and insights as of 2026.
Global Workflow Automation Market Trends and Insights
Drivers Impact Analysis*
| Driver | (~) % Impact on CAGR Forecast | Geographic Relevance | Impact Timeline |
|---|---|---|---|
| Rapid adoption of IoT-enabled edge workflows | +2.1% | Global ⁄ early gains in North America and Asia Pacific hubs | Medium term (2-4 years) |
| Rise in implementation of robotic process automation in business process management | +1.8% | Global ⁄ strongest in North America and Europe finance | Short term (≤ 2 years) |
| Growing demand for low-code ⁄ no-code development platforms | +1.6% | Global ⁄ robust in SME segments | Short term (≤ 2 years) |
| Convergence of workflow automation with generative AI copilots | +2.3% | North America and Europe lead ⁄ Asia Pacific follows | Medium term (2-4 years) |
| Operational resilience mandates in highly regulated sectors | +1.4% | Europe, North America, Asia Pacific | Long term (≥ 4 years) |
| Expansion of 5G private networks enabling real-time industrial automation | +1.2% | Asia Pacific core, spill-over to other regions | Long term (≥ 4 years) |
| Source: Mordor Intelligence | |||
Rapid Adoption of IoT-Enabled Edge Workflows
Real-time processing at the data source is removing latency barriers that previously hampered machine-critical automation. Manufacturers leverage local compute to analyze sensor streams in milliseconds, cutting scrap rates and scheduling predictive maintenance without waiting on centralized clouds. Mining operators deploy edge nodes that trigger automated safety shutdowns when gas or vibration thresholds spike, satisfying stringent IEC 61508 mandates. Logistics hubs combine 5G private networks with edge orchestration, letting autonomous mobile robots navigate dynamic warehouse layouts without connectivity delays. Healthcare providers embed edge analytics into bedside monitors so clinical alerts fire instantly, improving patient outcomes and easing nurse workloads. These gains reinforce capital investment in ruggedized gateways and containerized orchestration stacks that extend the workflow automation market deeper into operational technology footprints.[1]
Convergence of Workflow Automation with Generative AI Copilots
Generative AI is elevating automation from rule-based scripting to context-aware decision support. Financial institutions deploy copilots that parse regulatory bulletins, map clauses to business controls, and auto-configure approval chains, trimming weeks from compliance cycles while preserving auditability.[2]Hospitals feed unstructured clinical notes into large language models that flag sepsis risk, launch care-path workflows, and redact protected health information to uphold HIPAA safeguards. Insurers use document understanding engines to extract key terms from multilingual policies, then route exceptions to underwriters only when human judgment adds value. Early pilots report 40-60% productivity boosts across knowledge tasks, but firms must enforce model-governance, bias-mitigation, and explainability frameworks before scaling beyond sandbox environments.
Growing Demand for Low-Code ⁄ No-Code Development Platforms
Citizen developers now design procurement, accounts-receivable, and HR workflows without deep programming skills, shrinking deployment cycles from months to days. Small manufacturers adopt subscription-based builders that bundle templates, connectors, and role-based access, eliminating hefty upfront licenses. Large enterprises encourage business units to prototype flows in sandboxes governed by IT-managed guardrails that enforce encryption, data-loss-prevention, and rollback controls. Vendors supplement drag-and-drop tooling with AI-guided suggestions that auto-generate integrations, further lowering barriers. These dynamics expand the workflow automation market into previously untapped long-tail use cases while shifting professional developers toward complex orchestration and governance work.[3]
Rise in Implementation of Robotic Process Automation in Business Process Management
RPA has evolved from screen scraping into enterprise-grade orchestration capable of spanning legacy cores, SaaS suites, and mainframes. Banks employ attended bots that collect KYC evidence, cross-check sanctions lists, and populate onboarding systems, driving 70% cycle-time cuts and error rates below manual norms.[4]Healthcare providers automate claims adjudication, scheduling, and reporting, achieving 90% accuracy improvements. Integrating RPA with process-mining dashboards exposes bottlenecks, letting teams prioritize high-ROI candidates. Success hinges on robust exception handling, version control, and change-management programs that prevent unforeseen system updates from crippling automated processes.
Restraints Impact Analysis*
| Restraint | (~) % Impact on CAGR Forecast | Geographic Relevance | Impact Timeline |
|---|---|---|---|
| Data security and privacy concerns within multi-tenant cloud | -1.8% | Global ⁄ acute in Europe and regulated verticals | Medium term (2-4 years) |
| Shortage of process-mining skill sets to scope automation projects | -1.5% | Global ⁄ most severe in North America and Europe | Short term (≤ 2 years) |
| Legacy system integration complexity in brownfield enterprises | -1.2% | Global ⁄ concentrated in mature IT landscapes | Long term (≥ 4 years) |
| Budget compression amid macro-economic uncertainty | -1.1% | Global with cyclical intensity | Short term (≤ 2 years) |
| Source: Mordor Intelligence | |||
Data Security and Privacy Concerns Within Multi-Tenant Cloud
Enterprises handling financial and health records face heightened breach risks when workflows run on shared stacks. European controllers demand GDPR alignment, compelling vendors to embed consent tracking, data-minimization, and erase-on-request functions. Financial institutions preparing for Digital Operational Resilience Act compliance insist on granular audit trails, encryption in transit and at rest, and continuous vulnerability scans. Many firms therefore adopt hybrid architectures that stage sensitive data on-premises while leveraging cloud analytics layers. Vendor roadmaps emphasize FedRAMP, ISO 27001, and SOC 2 certifications, plus region-specific data-residency options that place replicas inside sovereign clouds.[5]
Shortage of Process-Mining Skill Sets to Scope Automation Projects
Process mining reveals hidden throughput gaps, yet qualified professionals who can extract logs, cleanse data, and interpret patterns remain scarce. Organizations struggle to build credible ROI cases, delaying funding approvals and narrowing project pipelines. Hospitals need analysts versed in both BPMN and clinical operations; manufacturers require expertise spanning ERP, MES, and Six Sigma. To bridge gaps, firms engage managed service partners or outsource diagnostics, but this can curb internal capability building and raise long-term costs. Vendors are releasing self-service discovery modules with AI-guided insights, though governance teams still need specialists to validate findings and prioritize initiatives.
*Our forecasts treat driver/restraint impacts as directional, not additive. The impact forecasts reflect baseline growth, mix effects, and variable interactions.
Segment Analysis
By Deployment: Cloud Leadership Propels Hybrid Upswing
Cloud-hosted offerings generated 62.15% of revenue in 2025, underscoring the preference for elastic scaling and subscription pricing. Vendors bundle AI services and pre-built connectors, letting clients pilot flows in hours. Financial services, retail, and healthcare gravitate toward cloud to avoid hardware refresh cycles and to tap rapid innovation. Yet rising scrutiny from regulators and boards sparks a shift to hybrid, now pacing at a 10.08% CAGR. Here, sensitive data remains on-premises while orchestration tiers run in vendor clouds, balancing sovereignty with agility. The workflow automation market size for hybrid architectures is expanding as 5G edge nodes route latency-critical tasks locally, then sync analytics upstream. Vendors augment platforms with policy-based routing that assigns each process instance to cloud or edge based on data classification and performance targets.
Hybrid adoption broadens as public sector agencies and defense primes demand demonstrable control over encryption keys and audit logs. Integrated management dashboards unify visibility across zones, easing compliance reporting. On-premises deployments persist in nuclear, defense, and air-gapped plants where air-gap and zero-trust postures are mandatory. Edge appliances certified to ISO 27001 run containerized orchestration engines, letting factories maintain autonomous operations during network outages. Over the forecast span, workload portability, confidential computing, and sovereign-cloud alliances will embed flexibility, but cost-benefit analysis will continue to favor cloud for non-regulated workloads.

By Solution: Software Platforms Anchor RPA Innovation
Software platforms accounted for 66.55% of 2025 spending, bundling workflow orchestration, RPA, event streaming, and AI inference in cohesive suites. The segment’s dynamism lies in the infusion of large language models, enabling bots to comprehend free-text instructions and auto-generate API calls. This evolution positions RPA as the fastest-growing sub-segment, rising at 9.95% CAGR as enterprises revisit previously unautomatable exception handling. Vendors expose model ops consoles that monitor drift, retrain models, and enforce responsible-AI principles, features becoming purchase prerequisites for regulated buyers.
Services held 33.45% of value, anchored by system integration and change-management engagements that ensure cross-system data coherence. Process-mining assessments feed backlog roadmaps, while managed-service contracts guarantee outcome-based SLAs for clients lacking domain talent. Consulting arms increasingly verticalize offerings, delivering DORA compliance accelerators for banks or GMP-validated templates for pharmaceutical plants. As the workflow automation market grows, co-innovation partnerships between hyperscalers and boutique integrators will amplify, combining global reach with domain depth.
By End-User Industry: Finance Dominates, Healthcare Accelerates
Banking and Financial Services retained 23.62% revenue share in 2025, reflecting transaction volumes and stringent compliance overheads that favor automation. Institutions leverage bots for anti-money-laundering investigations, loan disbursements, and straight-through settlements. DORA preparation commands additional spend on continuity orchestration, cyber-event playbooks, and supplier-risk dashboards. The workflow automation market size for healthcare and pharmaceuticals is advancing the fastest, at 11.22% CAGR, as electronic health record mandates and clinical trial digitization intensify. Automated prior-authorization, e-signature capture, and pharmacovigilance reporting free clinicians to focus on patient care while meeting regulatory filing windows.
Manufacturing remains pivotal, integrating workflow engines with IoT sensors and quality-management systems to streamline shop-floor decisions. Retail, logistics, and utilities deploy automation to stabilize supply chains, respond to demand volatility, and comply with environmental reporting. Government agencies adopt citizen-service portals powered by back-office orchestration that slashes manual paperwork and accelerates benefit disbursements, yet they grapple with legacy interoperability constraints.
By Organization Size: SME Momentum Outpaces Enterprise Scale
Large enterprises delivered 71.05% of revenue in 2025, driven by cross-domain initiatives that weave workflows through finance, HR, ITSM, and customer experience platforms. Their deployments involve multi-year roadmaps, center-of-excellence governance, and complex change-management. However, the 10.19% CAGR logged by small and medium-sized enterprises through 2031 signals democratization. Low-code suites, pay-as-you-grow tiers, and template libraries enable SMEs to automate procure-to-pay, CRM updates, and compliance filings without large IT staff. Vendors court this base with usage-based pricing and managed-service bundles that guarantee uptime and security patching.
Partnership ecosystems with regional integrators and value-added distributors extend vendor reach into local markets, offering language localization and sector expertise. Government grant programs supporting digital adoption, such as Enterprise Singapore’s Enterprise Development Grant, offset capital barriers. As SMEs mature, they adopt hybrid governance, instituting light-weight approval gates to prevent runaway shadow IT and ensure audit readiness.
Geography Analysis
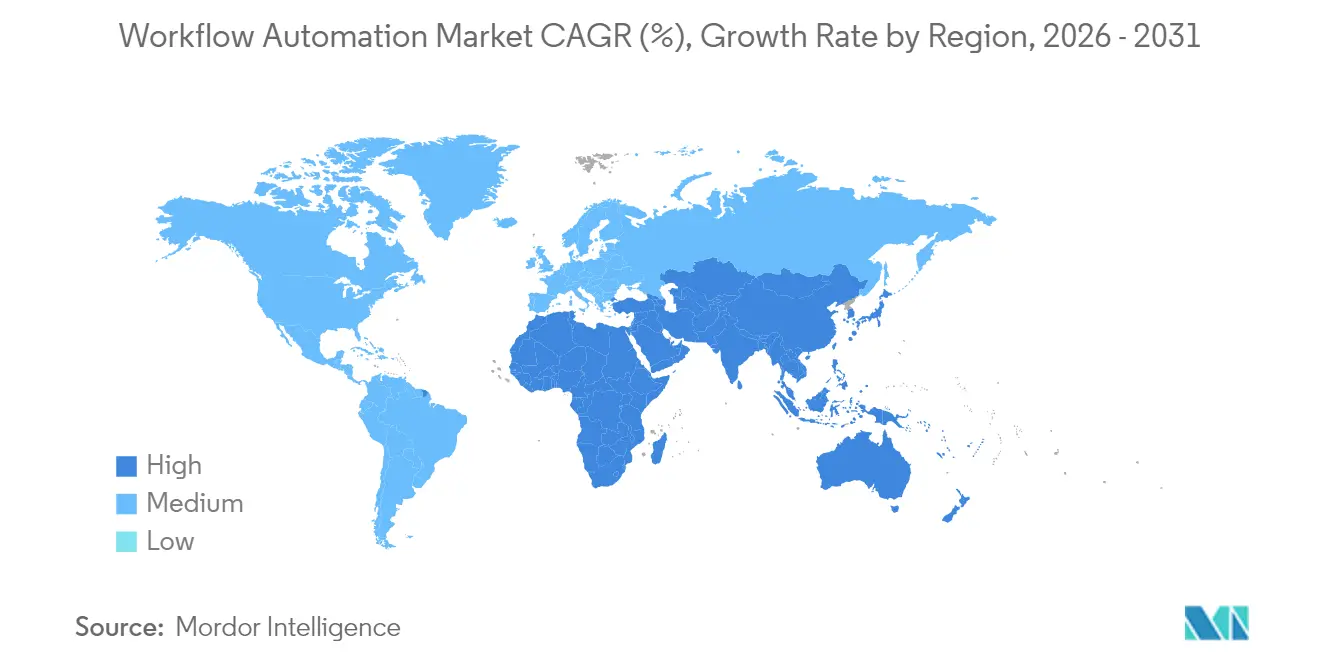
North America contributed 34.22% of global revenue in 2025 as enterprises accelerated cloud migration and AI adoption under stable regulatory oversight. Financial institutions implemented end-to-end onboarding workflows compliant with SOX and Dodd-Frank, while manufacturers embedded edge nodes to enhance production resilience. U.S. vendors anchor local ecosystems, offering early-access betas that encourage experimentation. Canada’s public sector digitization programs further underwrite regional demand, especially for citizen-service portals.
Asia Pacific is expanding at a 9.92% CAGR, propelled by manufacturing digitization, e-commerce growth, and favorable government incentives. China’s dual-circulation strategy drives factories to embed workflow engines for supply-chain visibility, whereas India’s Make-in-India campaign spurs SMEs to adopt low-code tools. Japan and South Korea prioritize 5G-enabled smart factories, integrating edge orchestration with industrial robots to curb labor shortages. Southeast Asian nations deploy cloud-native platforms hosted in regionally-compliant data centers, raising adoption among mid-market firms.
Europe ranks third by revenue but exhibits strong compliance-driven uptake. DORA’s 2025 deadlines catalyze bank spending on continuity orchestration, while GDPR fosters demand for built-in consent management. Germany’s Industrie 4.0 tailwinds support manufacturing workflows, and the United Kingdom’s NHS invests in process mining to optimize care pathways. Data-residency requirements encourage hybrid implementations, with sovereign-cloud regions from hyperscalers gaining traction. The Middle East and Africa and Latin America remain nascent but display rising interest as telecom operators roll out 5G and governments digitize public services.
Regulatory Landscape
Workflow automation deployments are increasingly shaped by AI governance and operational resilience requirements, which pushes vendors to strengthen auditability, model documentation, and control traceability across automated processes. The EU Artificial Intelligence Act (Regulation (EU) 2024/1689) sets a risk-based framework for AI systems, with general application beginning August 2, 2026, raising expectations for transparency, human oversight, and lifecycle management where AI-enabled workflow components are used in regulated functions.
In the United States, NIST continues to influence how enterprises operationalize AI controls through its AI Risk Management Framework and related standards, which buyers commonly map into procurement and internal governance checklists for AI-augmented workflows. Federal usage is further guided by OMB Memorandum M-26-04 implementing Executive Order 14319 for agency procurement and use of large language models, while state-level activity adds fragmentation, such as Colorado SB 26-189 signed May 14, 2026 (effective January 1, 2027), which changes compliance assumptions by removing a prior NIST AI RMF affirmative defense approach.
Value Chain Analysis
The workflow automation value chain begins with core technology inputs (cloud infrastructure, container platforms, identity and access management, APIs/connectors, and AI model services) that enable orchestration, BPM, RPA, and low-code workflow design. Platform vendors bundle these components into suites, then system integrators and managed service providers deliver process discovery, integration with ERP/CRM/ITSM and legacy systems, governance setup (audit trails, DLP, encryption), and ongoing operations.
Distribution is increasingly partner-led for mid-market adoption, with hyperscalers and ISVs co-selling templates and connectors, while enterprises purchase through a mix of direct subscription, enterprise agreements, and outcome-linked service engagements. Downstream, deployment and adoption depend on process intelligence and orchestration layers that unify tool sprawl across hybrid IT, with self-service automation becoming a common operating model in large organizations (Stonebranch reported that 63% of organizations had more than 200 self-service users in 2025). In vertical supply chains such as media operations, specialized workflow ecosystems show where value is created through end-to-end integration of content systems, QC, metadata, and storage into cohesive pipelines, including Ateliere Creative Technologies partnering with TMT Insights (April 2024) and BBC Studios working with TMT Insights on Polaris for global content operations (September 2024). Bottlenecks persist around integration complexity, skills shortages in process mining, and governance requirements for AI-enabled automation, which keeps services and partner ecosystems central to scaling.
Competitive Landscape
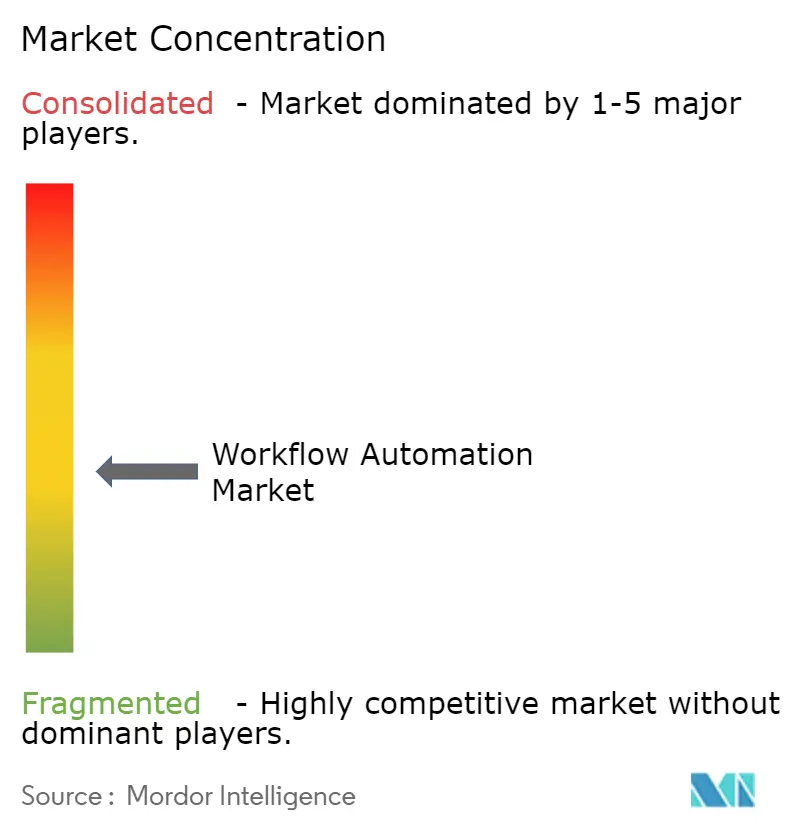
Competition is moderately concentrated, with the top five suppliers holding roughly 35% of global revenue. Microsoft, IBM, and ServiceNow embed workflow engines into broader cloud and productivity suites, leveraging install bases to defend share. UiPath, Celonis, and Automation Anywhere focus on RPA and process-intelligence depth, acquiring niche startups to widen capability gaps. Celonis’s 2024 purchase of PAF bolstered AI-driven mining, while UiPath’s multilingual document understanding adds vertical reach. Vendors differentiate via open APIs, BPMN-2.0 compliance, and multi-model AI orchestration that allows plug-in of third-party LLMs.
Strategic thrusts skew toward industry templates and compliance accelerators. Banks adopt DORA packs that pre-configure incident response workflows, while pharma clients seek GxP-aligned validation blueprints. Edge workflow enablement remains white space, with only a handful of providers offering containerized runtimes certified for rugged industrial PCs. Low-code vendors like Zapier and Kissflow target SMB sweet spots, combining ease-of-use and community-driven templates. Hyperscalers partner with specialist ISVs to co-sell domain solutions, while channel alliances with regional system integrators expand service wraparounds.
Pricing models migrate from user-based tiers to consumption or outcome-linked contracts. Clients increasingly evaluate total automation value delivered per hour saved rather than license counts. AI augmentation, governance toolkits, and analytical dashboards stand out as purchase criteria. Over the outlook horizon, consolidation is expected as platform breadth trumps point capabilities, yet innovative startups will persist by pioneering vertical micro-flows, privacy-preserving edge agents, and trust-layer overlays for regulated data.
Workflow Automation Industry Leaders
-
IBM Corporation
-
Oracle Corporation
-
Pegasystems, Inc
-
Xerox Corporation
-
Appian Corporation
- *Disclaimer: Major Players sorted in no particular order
Market Opportunities and Future Outlook
A major opportunity area is governance-first orchestration for AI-enabled workflows, where enterprises need a control plane that can manage hybrid execution, policy-based routing, and auditable agent actions across systems. Vendor and industry activity in 2026 supports this direction, with Stonebranch's 2026 Global State of IT Automation Report positioning orchestration as the missing link for AI adoption and trust, aligning with demand for unified observability, approval chains, and exception handling in regulated and mission-critical processes.
Another white-space is interoperable, agent-ready workflow automation that connects enterprise platforms with external AI agents without creating new silos. Product moves in 2026 support this shift: Oracle expanded Oracle AI Agent Studio for Fusion Applications in March 2026 with an Agentic Applications Builder and workflow tooling, and introduced an AI-native builder experience in July 2026 to create and run agentic applications within Oracle Fusion Cloud Applications. In content and media operations, Dalet announced Dalet Flex LTS in July 2026 with deeper integration for its Dalia agentic AI platform to trigger workflows via natural language, highlighting opportunities for verticalized, template-driven automation that couples orchestration with domain systems while keeping governance and lifecycle management centralized.
Recent Industry Developments
- July 2026: Oracle introduced an AI-native builder experience for Oracle AI Agent Studio, enabling users to create and run agentic applications within Oracle Fusion Cloud Applications. The release strengthens Oracle's workflow tooling around agent-driven execution, embedding orchestration and contextual capabilities closer to enterprise application workflows.
- January 2026: Pegasystems launched Notes to Blueprint, an AI-powered tool designed to help transform legacy Lotus Notes applications into cloud-native automated workflows. The offering targets modernization backlogs by accelerating migration into governed workflow patterns instead of maintaining brittle, custom legacy apps.
- December 2024: Celonis finalized the acquisition of Process Analytics Factory, expanding its process-mining depth and real-time insight capabilities. The deal tightens the link between process intelligence and automation execution, helping buyers prioritize workflows with measurable impact and faster time-to-value.
Research Methodology Framework and Report Scope
Market Definition and Coverage
This market is defined as revenue earned from software and related services that help organizations design, run, monitor, and improve business workflows, across on-premise, cloud, and hybrid environments. It includes tools used to automate task routing, approvals, and process steps across key functions.
Scope exclusions: Hardware-only purchases, pure IT outsourcing without workflow software, and general productivity apps that do not automate workflows are excluded.
Segmentation Overview
- By Deployment
- On-premise
- Cloud
- Hybrid
- By Solution
- Software
- Workflow Orchestration Platforms
- Business Process Management Suites
- RPA Platforms
- Services
- Consulting and Advisory
- Implementation and Integration
- Managed Services
- Software
- By End-user Industry
- Banking and Financial Services
- Telecom
- Retail and E-commerce
- Manufacturing
- Logistics and Transportation
- Healthcare and Pharmaceuticals
- Energy and Utilities
- Government and Public Sector
- Other End-user Industries
- By Organization Size
- Large Enterprises
- Small and Medium-sized Enterprises
- By Geography
- North America
- United States
- Canada
- Mexico
- South America
- Brazil
- Argentina
- Rest of South America
- Europe
- Germany
- United Kingdom
- France
- Italy
- Rest of Europe
- Asia Pacific
- China
- Japan
- India
- South Korea
- Australia and New Zealand
- Rest of Asia Pacific
- Middle East
- Saudi Arabia
- United Arab Emirates
- Turkey
- Rest of Middle East
- Africa
- South Africa
- Nigeria
- Kenya
- Rest of Africa
- North America
Data Sources, Market Sizing, and Validation
Desk Research
Desk research was used to set the market boundary, build the initial demand story, and ground assumptions in public data. We referenced sources such as the US Bureau of Labor Statistics for employment and wage trends that affect automation ROI, and US Census and OECD digital economy indicators to gauge how quickly enterprises digitize their operations. For cloud adoption and security-related context, we also reviewed material from NIST and other government cyber guidance, along with public procurement portals where workflow tools are commonly tendered.
To translate those trends into sizing inputs, we reviewed company filings and investor presentations for revenue splits and product positioning, along with reputable press coverage and association publications tied to process improvement and IT service management. In a few cases, paid subscriptions for company financials and news intelligence were used to cross-check revenue history, deal timing, and segment notes. These desk sources are illustrative only, and many other public references were also used for data collection, clarification, and validation.
Primary Interviews and Surveys
Primary work focused on validating what is counted as workflow automation spend, and how buyers budget across software subscriptions, implementation, and ongoing support. We spoke with solution leaders, service partners, and enterprise users across APAC, EMEA, and the Americas to confirm adoption pace, pricing behavior, and how hybrid deployments are contracted.
Distribution of primary research fieldwork respondents
| Company type | Respondent position | Region |
|---|---|---|
| Top tier: 27% | CXOs: 14% | APAC: 38% |
| Mid tier: 55% | Functional/Unit leaders: 41% | EMEA: 35% |
| Smaller Players: 18% | Managers: 45% | Americas: 27% |
Market-Sizing & Forecasting
For market sizing, we start with a top-down build where IT and digital operations spend pools are reconstructed by region, and then filtered using workflow automation adoption and usage intensity across major industries. The final totals are then checked with selective bottom-up approximations, such as sampled vendor revenue ranges, channel checks, and ASP times estimated user or workflow volumes, which helps correct for over-counting.
Key inputs used in the model include cloud versus on-premise versus hybrid mix, subscription and services attach rates, typical contract duration and renewal behavior, and the pace of low-code adoption that changes seat expansion. We also track enterprise digitization indicators, regulatory pressure in data-sensitive industries, and the share of implementations that move from pilot to scaled rollout, since these factors affect realized revenue in a given year.
Forecasts are built using scenario analysis supported by a short multivariate regression layer for demand drivers. Variables such as cloud adoption, IT services growth, and labor cost pressure are stress-tested with expert feedback. Where bottom-up checks are incomplete for smaller geographies or niche industries, we use peer-market proxies and normalize them back to the total demand pool so the numbers remain consistent.
Data Validation & Update Cycle
Validation is done through repeated cross-checks between the model output and independent signals, including enterprise software spending direction, cloud migration pace, and services attach behavior. When a variance appears, we re-check scope mapping, revisit key assumptions, and re-contact selected respondents if the change looks tied to pricing, bundling, or a shift in deployment preference.
Before sign-off, the work goes through multi-step internal reviews where logic, math, and year-over-year movements are challenged and corrected if needed. Reports are refreshed annually, and interim updates are made when material events occur such as major product bundling shifts, regulatory changes affecting deployments, or a clear demand slowdown. Right before delivery, we re-scan the latest public and primary signals so clients receive an up-to-date view.
Mordor Intelligence's Workflow Automation Market Estimate Compared With Other Published Estimates
Published market sizes for workflow automation do not always line up, even when the topic name looks similar. The spread usually comes from how each study draws the category boundary, which years are used as anchors, and how software versus services are treated in the revenue count.
By tracking deployment mix, services attach, and renewal timing, Mordor Intelligence places the 2025 total closer to recurring platform revenue plus directly related implementation, and it avoids inflating the market with adjacent BPM or broader process automation categories. A second driver is forecasting style, where some estimates use aggressive expansion assumptions for low-code rollouts, while others keep a more conservative path for regulated buyers that extend approval cycles and slow large-scale expansions.
Benchmark comparison
| Source | Market Size | Gaps in Research Methodology |
|---|---|---|
| Mordor Intelligence | USD 23.77 B (2025) | |
| Industry Publisher A | USD 24.81 B (2025) | Uses a similar year anchor but appears to apply different component and deployment assumptions, with a longer forecast window that can shift implied pricing and adoption curves. |
| Industry Publisher B | USD 25.20 B (2024) | Anchors on a different base year and shows a much higher growth trajectory, which can happen when adjacent workflow management and broader digital transformation spend is included more freely. |
Looking across the table, the differences are explainable once scope and the year basis are aligned. The approach used here stays traceable to clear demand indicators, separates software from services in a consistent way, and applies forecasting assumptions that can be rechecked with real adoption and pricing signals.
Key Questions Answered in the Report
What is the projected value of the workflow automation market in 2031?
The market is forecast to reach USD 40.77 billion by 2031.
Which region is expected to witness the fastest growth through 2031?
Asia Pacific is projected to expand at a 9.92% CAGR, driven by manufacturing modernization and digital infrastructure investments.
Which deployment model is growing the quickest?
Hybrid deployment is rising at a 10.08% CAGR as enterprises balance data sovereignty with cloud scalability.
Why are healthcare organizations accelerating adoption?
Clinical digitization mandates and the need for compliant, patient-centric workflows are propelling hospital and pharmaceutical uptake at an 11.22% CAGR.
How are vendors differentiating their offerings?
Providers compete on integrated AI, process mining depth, vertical compliance templates, and low-code ease of use to shorten time-to-value.
What security features are enterprises demanding from vendors?
Buyers seek end-to-end encryption, granular audit trails, region-specific data residency, and certifications such as ISO 27001 and SOC 2 to satisfy regulatory mandates.