Accounts Receivable Automation Market Size and Share
Market Overview
| Study Period | 2020 - 2031 |
|---|---|
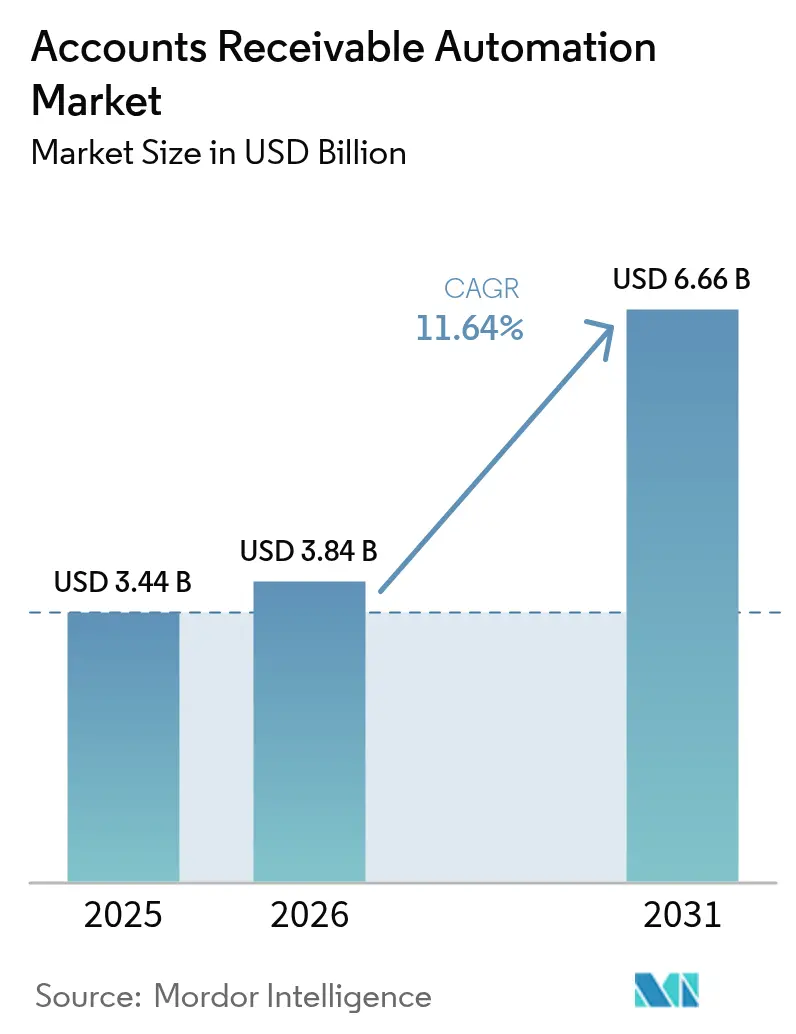
| Market Size (2026) | USD 3.84 Billion |
| Market Size (2031) | USD 6.66 Billion |
| Growth Rate (2026 - 2031) | 11.64% CAGR |
| Fastest Growing Market | Asia-Pacific |
| Largest Market | North America |
| Market Concentration | Medium |
Major Players *Disclaimer: Major Players sorted in no particular order Image © Mordor Intelligence. Reuse requires attribution under CC BY 4.0. | |
Accounts Receivable Automation Market Analysis by Mordor Intelligence
The accounts receivable automation market size is expected to grow from USD 3.44 billion in 2025 to USD 3.84 billion in 2026 and is forecast to reach USD 6.66 billion by 2031 at 11.64% CAGR over 2026-2031. Mandatory e-invoicing rules now active in more than 80 jurisdictions are pulling finance teams away from manual reconciliations toward API-driven cash application, while the expansion of real-time payment rails exposes collection inefficiencies previously hidden by settlement float. Cloud platforms that deliver continuous feature updates are accelerating the shift because enterprises gain instant access to new invoice formats, tax schemas, and AI models without the need for upgrade projects. Vendors that embed machine-learning credit scoring and dispute analytics are capturing net-new workloads as controllers prioritize working-capital efficiency over historical allegiance to ERP incumbents. Headline risks remain: rising cybersecurity attacks on SaaS finance stacks, a global talent shortage in finance automation, and fragmented B2B identity standards that complicate straight-through processing across borders.
Key Report Takeaways
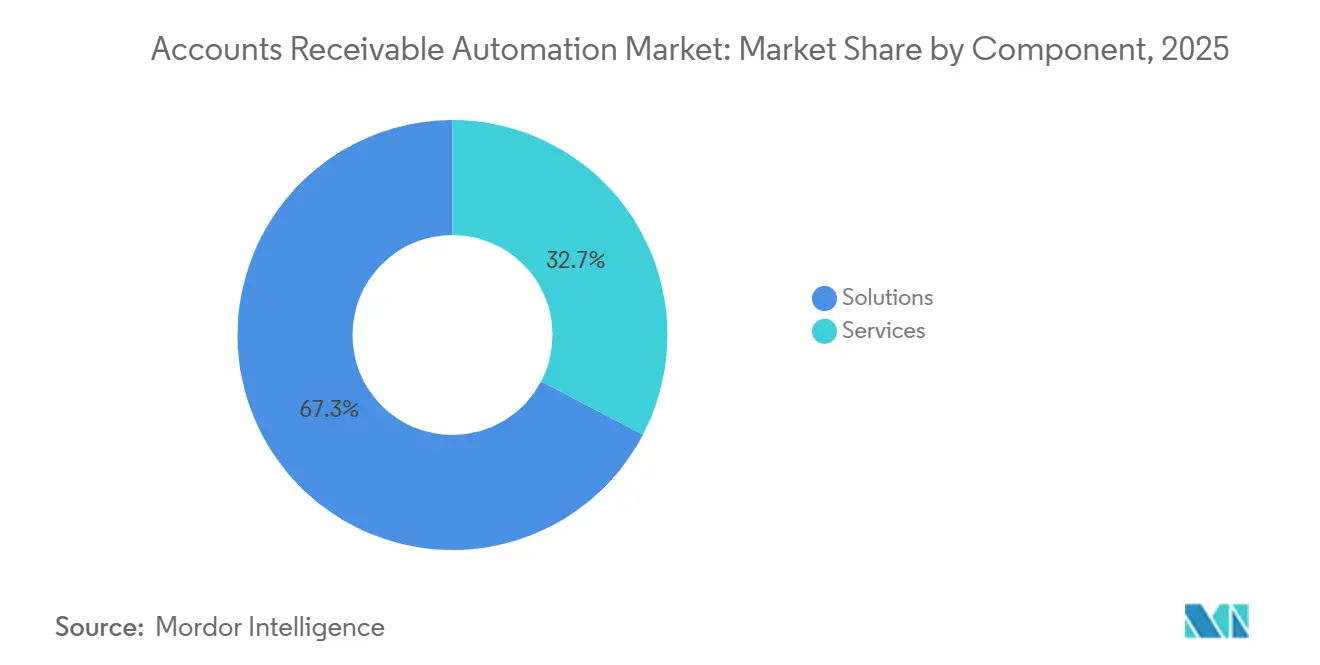
- By component, solutions led with 67.33% of the accounts receivable automation market share in 2025; services are forecast to expand at a 12.04% CAGR through 2031.
- By deployment model, cloud offerings captured 79.21% share of the accounts receivable automation market size in 2025 and are advancing at a 12.11% CAGR through 2031.
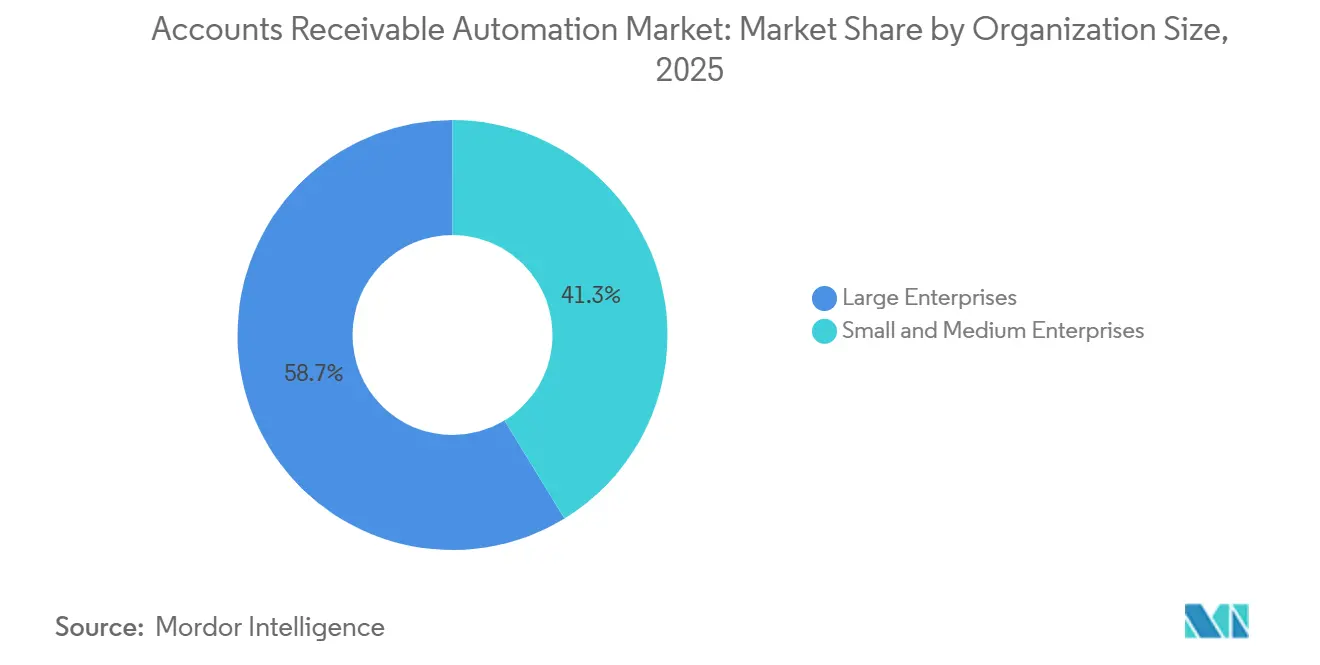
- By organization size, large enterprises held 58.71% of overall spending in 2025, while SMEs are projected to record a 12.07% CAGR between 2026 and 2031.
- By end user industry, BFSI accounted for 23.46% of the accounts receivable automation market in 2025, and healthcare and life sciences are poised for a 13.24% CAGR through 2031.
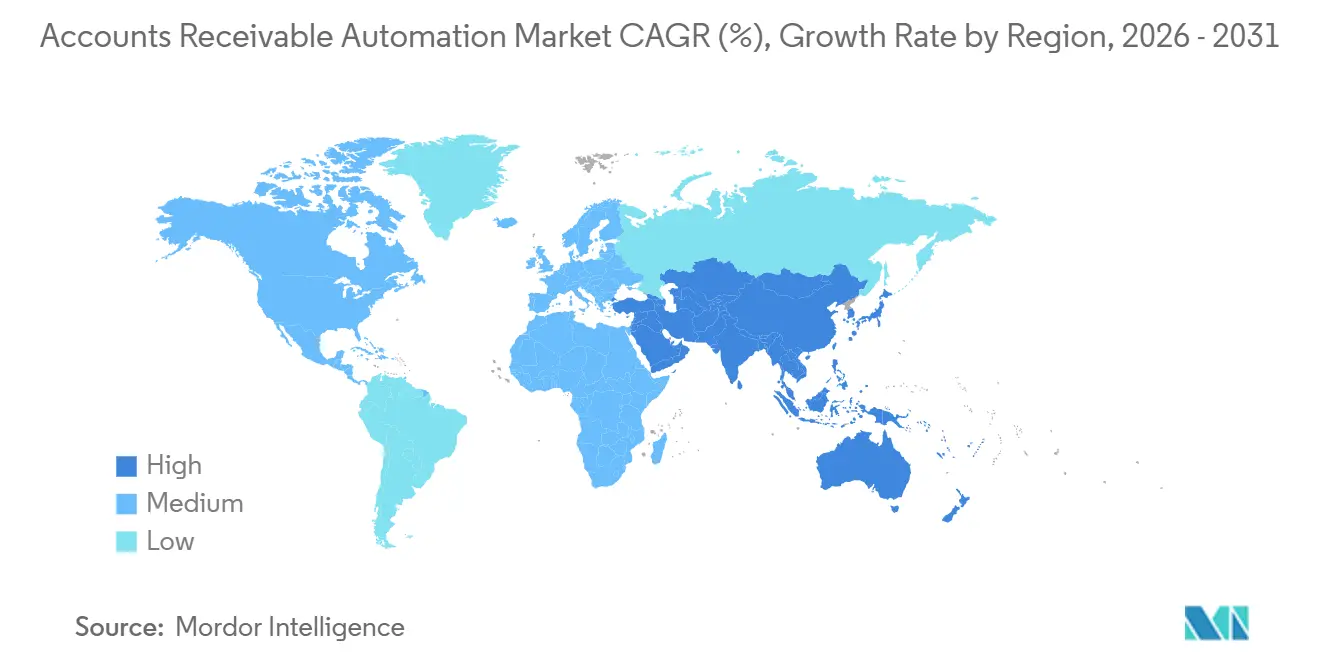
- By geography, North America secured 38.40% of the accounts receivable automation market share in 2025, whereas Asia-Pacific is forecast to post a 12.67% CAGR during 2026-2031.
Note: Market size and forecast figures in this report are generated using Mordor Intelligence’s proprietary estimation framework, updated with the latest available data and insights as of 2026.
Global Accounts Receivable Automation Market Trends and Insights
Drivers Impact Analysis*
| Driver | (~) % Impact on CAGR Forecast | Geographic Relevance | Impact Timeline |
|---|---|---|---|
| Need to Improve Cash-Flow and Working-Capital Efficiency | +2.8% | Global with acute pressure in North America and Europe | Short term (≤ 2 years) |
| Rapid Adoption of Cloud-Based AR Suites by SMEs | +2.4% | Global led by Asia-Pacific and South America | Medium term (2-4 years) |
| AI and ML-Driven Credit and Dispute Analytics | +2.2% | North America and Europe core, expanding to Asia-Pacific | Medium term (2-4 years) |
| Global e-Invoicing and Tax Digitisation Mandates | +1.9% | Europe and South America lead, Asia-Pacific accelerating | Long term (≥ 4 years) |
| Real-Time-Payments Rails Enabling Auto-Cash-Application | +1.3% | North America, Europe, select Asia-Pacific markets | Medium term (2-4 years) |
| ESG-Linked Supply-Chain Finance Pushing Receivables Automation | +0.8% | Europe and North America, emerging in Asia-Pacific | Long term (≥ 4 years) |
| Source: Mordor Intelligence | |||
Need to Improve Cash-Flow and Working-Capital Efficiency
Central banks raised benchmark rates through 2025, so treasurers began treating unpaid invoices as the cheapest liquidity lever available. Firms that automated invoice-to-cash workflows reported 6-day reductions in DSO and scaled collections without adding staff, shrinking reliance on revolving credit lines.[1]Bill.com, “BILL Announces Autonomous AI Agents for Accounts Payable and Receivable,” investor.bill.com Faster collections also let CFOs fund early-payment discount programs that generate low-risk returns above prevailing money-market yields. AI-driven cash-position forecasts identify which invoices to pay early for the largest rebate, turning the accounts receivable function into a profit contributor. Because these benefits are realized in the first quarter after go-live, finance chiefs now earmark a double-digit budget share for AR automation initiatives.
Rapid Adoption of Cloud-Based AR Suites by SMEs
Spreadsheets break down once monthly invoice counts top 1,000, so smaller firms are embracing subscription AR software that eliminates six-figure license fees. In 2025, an alliance between a top cloud accounting platform and an AR vendor reduced deployment time from 6 months to 6 weeks, clearing the technical hurdle that had kept automation in the enterprise tier. Pay-as-you-go pricing that starts at around USD 200 per month aligns software expenses with sales cycles, letting SMEs match the payment-term agility of larger rivals. Automated credit checks and instant e-invoice delivery compress the quote-to-cash cycle by up to 50%, freeing up working capital for growth. These gains explain why the SME segment is projected to post a double-digit CAGR through 2031.
AI and ML-Driven Credit and Dispute Analytics
Machine-learning engines now ingest live payment signals, dispute frequencies, and even email sentiment to flag credit risk weeks before bureau downgrades. A leading AR platform disclosed in 2025 that early adopters cut bad-debt write-offs by 99% after deploying its predictive models.[2]FIS, “FIS Launches Revenue Insight Analytics Platform,” fisglobal.com The same algorithms automatically categorize disputes and route them to the correct team, reducing average resolution time from 15 days to under 3. Faster dispute clearance keeps invoices from aging into uncollectible status and protects gross margin. Because the models self-learn from every new transaction, performance improves over time without manual rule tuning.
Global e-Invoicing and Tax Digitization Mandates
More than 80 countries now require machine-readable invoices submitted through government networks such as Peppol, and the EU’s ViDA directive will extend the model across Europe by 2030.[3]European Commission, “VAT in the Digital Age Proposal,” ec.europa.eu Structured data flows straight into AR ledgers, eliminating hand keying and real-time tax errors. Companies that adopt early avoid non-compliance fines and unlock automation dividends, such as instant validation and straight-through cash application. Mandates are compressing the normal seven-year software cycle into as little as 18 months, creating a captive buyer base for vendors that ship certified invoice formats. The ripple effect is global because exporters must meet destination-country rules even when domestic mandates lag.
Restraints Impact Analysis*
| Restraint | (~) % Impact on CAGR Forecast | Geographic Relevance | Impact Timeline |
|---|---|---|---|
| Legacy ERP Integration Complexity | -1.2% | Global, acute in enterprises with multi-ERP landscapes | Short term (≤ 2 years) |
| Cyber-Security and Data-Privacy Concerns | -0.9% | Global, heightened in North America and Europe | Medium term (2-4 years) |
| Fragmented B2B Identity Standards | -0.7% | Cross-border trade in North America, Europe, and Asia-Pacific | Medium term (2-4 years) |
| Talent Shortage in Finance Automation | -0.5% | Global, more pronounced in North America and Europe | Short term (≤ 2 years) |
| Source: Mordor Intelligence | |||
Legacy ERP Integration Complexity
Many companies still run customized versions of SAP, Oracle, or Microsoft Dynamics installed before 2015, and those systems expose only batch exports rather than modern APIs. Integration projects quoted at 12 weeks routinely stretch to 9 months when hidden custom code breaks standard connectors. Each quarterly ERP patch can also invalidate a certified link, forcing expensive regression tests that drain IT budgets. When live AR data cannot sync, AI credit decisions and cash forecasts become stale within hours, undercutting the very ROI that justified the project. These hurdles push some enterprises to outsource the entire invoice-to-cash process, slowing direct software growth.
Cyber-Security and Data-Privacy Concerns
Accounts receivable platforms store bank details, credit limits, and taxpayer IDs, making them prime targets for ransomware. A 2024 breach at a finance SaaS vendor triggered regulatory probes and several million dollars in remediation costs, reminding buyers that AR providers must meet the same controls as banks. Data-residency mandates in China and Russia require in-country hosting, fragment cloud infrastructure, and delay global feature rollouts. Many CFOs now require SOC 2 Type II and ISO 27001 certifications before signing multiyear SaaS contracts, lengthening sales cycles. Until vendors can prove zero-trust architecture and localized compliance, some prospects will defer or limit deployments.
*Our forecasts treat driver/restraint impacts as directional, not additive. The impact forecasts reflect baseline growth, mix effects, and variable interactions.
Segment Analysis
By Component: Services Gain as Integration Complexity Rises
Services revenue is projected to accelerate at a 12.04% CAGR during 2026-2031, outpacing solutions even though the latter captured 67.33% of the accounts receivable automation market share in 2025. Enterprises that underestimated the effort needed to stitch modern cash-application engines into legacy ERP estates spent 40% more internal hours than budgeted, prompting a pivot toward managed and professional services bundles. The shift means vendors now monetize continuous optimization work, AI model retraining, new e-invoice template mapping, and connector upkeep rather than relying solely on license fees. Because those activities are recurring, they align vendor revenue with customer DSO reductions, thereby embedding providers more deeply into finance operations.
Solutions remain essential because invoice-to-cash suites replace email billing and PDF tracking across the largest share of users. Credit and risk modules attract organizations with concentrated customer exposure, while standalone cash-application engines gained momentum in 2025 after real-time payment rails erased reconciliation float. The accounts receivable automation market, linked to software, continues to grow, but at a slower clip than the services layer needed to keep deployments current. Vendors that package outcome-based contract fees tied to days-sales-outstanding cuts are winning multiyear renewals, reinforcing the revenue shift from perpetual licenses to subscription-plus-services bundles.


By Deployment Model: Cloud Dominance Driven by API Ecosystems
Cloud platforms held 79.21% of the accounts receivable automation market share in 2025 and are forecast to grow at a 12.11% CAGR to 2031 as weekly releases deliver new invoice schemas, payment-rail hooks, and AI models without customer downtime. Continuous delivery enables finance teams to comply with e-invoicing mandates in days rather than quarters, a critical advantage given that rules can change mid-fiscal year. On-premise installations persist in defense, healthcare, and government contracts where data-sovereignty laws mandate local storage, yet even those users adopt hybrid models that keep invoice images on-site while pushing analytics to the cloud.
Version fragmentation undermines on-premise ROI: multi-site organizations often run three release levels, complicating support and delaying compliance patches. Participation in international B2B networks such as Peppol now presumes cloud connectivity, forcing late adopters to budget migration spend sooner than planned. The accounts receivable automation market size from pure SaaS subscriptions will therefore grow faster than hybrid alternatives, because each new real-time payment endpoint or tax schema validates the elasticity of multitenant infrastructure. Vendors that guarantee sub-two-hour uptime windows and zero-data-loss backups are becoming the default choice for CFOs wary of headline cyber breaches.
By Organization Size: SMEs Close the Automation Gap
Large enterprises accounted for 58.71% of 2025 revenue, yet small and medium enterprises are tracking a 12.07% CAGR, eroding the gap each year. The 2025 launch of tiered pricing at USD 200 per month for up to 500 invoices lowered the entry barrier, allowing firms with under USD 50 million in revenue to tap AI-driven credit risk scoring and automated cash application. Because SMEs operate without large treasury teams, they value pre-configured workflows that go live in weeks, not months. Faster quote-to-cash cycles enable these companies to offer competitive payment terms, leveling the playing field against multinationals.
Large corporates still dominate absolute spend by virtue of invoice volumes in the millions and the need for multi-entity consolidation, intercompany netting, and SOX-compliant audit logs. However, their implementations move more slowly due to legacy ERP complexity, so vendors increasingly bifurcate go-to-market motions: standardized self-service for SMEs and high-touch consulting for Fortune 500 rollouts. As the SME cohort scales usage, its share of the accounts receivable automation market will continue to expand, reinforcing the strategic value of consumption-based pricing and marketplace integrations that minimize IT lift.
By End-User Industry: Healthcare Leads Growth Amid Payer-Provider Friction
Healthcare and life sciences are projected to grow at a 13.24% CAGR through 2031, outrunning every other vertical, as one-third of claims still require manual follow-up and dispute clearance. AR platforms tied into electronic health record systems now pre-validate coding against payer rules, trimming denial rates by as much as 50% and accelerating cash collection. Faster reimbursement eases hospital liquidity stress, reducing the need for short-term credit lines that carry rates above 7%. Because HIPAA compliance requires granular audit trails, vendors that bundle encryption and role-based access controls clinch multiyear contracts.
Banking, financial services, and insurance accounted for 23.46% of 2025 spend due to regulatory requirements for exhaustive audit trails and fraud analytics. Retail, logistics, and manufacturing deploy automation to reconcile thousands of daily invoices and credit memos, but investment levels vary with margin pressure. Education users automate tuition receivables that stretch over multiple terms, whereas technology firms focus on subscription billing reconciliation. As mandates for machine-readable invoices spread, every sector’s share of the accounts receivable automation market will rise, yet healthcare’s early pain points ensure it remains the fastest-growing opportunity for vendors positioned with claim-specific connectors and denial-prediction AI.
Geography Analysis
North America generated 38.40% of 2025 revenue as U.S. enterprises moved early to cloud-native invoice-to-cash platforms and took advantage of FedNow and RTP instant-payment rails. Canadian and Mexican firms also boosted spending because cross-border trade under the USMCA framework drives invoice volume and multi-currency complexity. A 2025 Peppol integration pilot enabled exporters to send compliant e-invoices to Europe and Asia without maintaining duplicate systems, cutting international receivable overhead by up to 40%. Although most Fortune 500 companies have already automated collections, mid-market adopters remain a growth pocket, so vendors now tailor lighter deployment playbooks for regional banks, distributors, and software companies.
Asia-Pacific is forecast to post a 12.67% CAGR for 2026-2031, the fastest regional trajectory. China’s Golden Tax IV regime, fully enforced in 2024, and India’s Goods and Services Tax Network mandate that invoices be machine-readable, triggering a rapid shift from PDFs to API-connected platforms. South Korea, Japan, and Indonesia are rolling out similar programs that compress the typical seven-year software cycle to less than two years, forcing even conservative manufacturers to modernize. Australia and New Zealand contribute steady cloud demand because their treasuries want real-time multi-currency visibility with ASEAN partners, while Southeast Asian growth is uneven due to fragmented payment infrastructure and varying e-invoicing maturity.
Europe’s momentum rests on the ViDA directive that will make real-time digital reporting compulsory across the bloc by 2030, accelerating current adoption led by Italy, France, Germany, and the United Kingdom. Harmonized invoice schemas reduce localization work, so vendors can deploy a single multitenant instance that serves multinational clients across the continent. In South America, Brazil and Argentina are driving growth as continuous transaction controls expand to curb tax evasion, while Chile and Colombia are catching up with pilot programs. The Middle East and Africa remain nascent but strategic, with Saudi Arabia and the UAE funding national e-invoicing and instant-payment platforms that should unlock faster regional expansion after 2027.

Competitive Landscape
The vendor field remains moderately fragmented, with the top five players controlling just under 40% of global revenue. ERP incumbents such as SAP, Oracle, and Workday defend their bases through bundle pricing that keeps general-ledger, tax, and receivables modules on one contract, but specialist contenders like HighRadius, BlackLine, Bill.com, and Billtrust win net-new workloads by embedding machine-learning credit scoring, autonomous cash application, and dispute analytics that legacy systems cannot match. Middleware depth is now the decisive factor, because pre-built connectors into the twenty most popular accounting suites reduce project timelines from quarters to weeks.
Artificial intelligence is becoming the key battleground. An AI-native entrant launched in 2025 with large language models that parse email sentiment and extract payment obligations from unstructured purchase orders, enabling 80% straight-through cash application in early pilots. Incumbents responded by layering generative models into existing analytics, but integration hurdles slow time-to-value. Consumption-based pricing represents another front: vendors are shifting from seat-based fees to contracts tied to invoices processed or DSO reduction achieved, which resonates with finance leaders under budget scrutiny.
Vertical solutions pose the newest threat to horizontal providers. Healthcare revenue-cycle platforms, construction progress-billing systems, and e-commerce checkout suites are adding native receivable modules that displace standalone products. As these niche players scale, they could trigger consolidation, especially if private-equity owners pair complementary assets to offer end-to-end order-to-cash functionality. Because no single vendor holds more than 20% share, alliances and targeted acquisitions are likely over the forecast horizon as companies seek to secure key geographic footholds and specialized compliance capabilities.
Accounts Receivable Automation Industry Leaders
SAP SE
Oracle Corporation
SK Global Software LLC
Quadient SA
Workday, Inc.
- *Disclaimer: Major Players sorted in no particular order

Recent Industry Developments
- July 2025: A leading accounts receivable automation vendor introduced tiered, consumption-based pricing that starts at USD 200 per month for up to 500 invoices, opening advanced cash-application capabilities to small and medium enterprises.
- March 2025: A major cloud accounting platform and a leading accounts receivable automation vendor formed a strategic partnership that delivers pre-built integrations, cutting implementation timelines from six months to six weeks for mid-market customers.
- January 2025: Billtrust rolled out Agentic VoIP, an AI voice assistant that negotiates payment plans, conducts collection calls, and updates account notes in real time, resolving 60% of overdue accounts without human escalation.
- January 2025: Bill.com launched autonomous AI agents that predict payment dates, prioritize collection tasks, and draft personalized outreach, enabling finance teams to process 50% more invoices without adding staff.


Global Accounts Receivable Automation Market Report Scope
The Accounts Receivable Automation Market Report is Segmented by Component (Solutions, and Services), Deployment Model (On-Premise, and Cloud), Organization Size (Large Enterprises, and Small and Medium Enterprises), End-User Industry (Banking Financial Services and Insurance, Information Technology and Telecommunications, Manufacturing, Healthcare and Life Sciences, Transportation and Logistics, Retail and E-Commerce, Education, Other End-User Industries), and Geography (North America, South America, Europe, Asia-Pacific, Middle East and Africa). The Market Forecasts are Provided in Terms of Value (USD).
| Solutions | Invoice-to-Cash Suites |
| Credit and Risk Management | |
| Cash-Application Engines | |
| Services | Implementation and Integration |
| Managed and Support Services |
| On-Premise |
| Cloud |
| Large Enterprises |
| Small and Medium Enterprises |
| Banking, Financial Services and Insurance |
| Information Technology and Telecommunications |
| Manufacturing |
| Healthcare and Life Sciences |
| Transportation and Logistics |
| Retail and E-Commerce |
| Education |
| Other End-User Industries |
| North America | United States | |
| Canada | ||
| Mexico | ||
| South America | Brazil | |
| Argentina | ||
| Rest of South America | ||
| Europe | United Kingdom | |
| Germany | ||
| France | ||
| Italy | ||
| Rest of Europe | ||
| Asia Pacific | China | |
| Japan | ||
| India | ||
| South Korea | ||
| Rest of Asia Pacific | ||
| Middle East and Africa | Middle East | United Arab Emirates |
| Saudi Arabia | ||
| Rest of Middle East | ||
| Africa | South Africa | |
| Egypt | ||
| Rest of Africa | ||
| By Component | Solutions | Invoice-to-Cash Suites | |
| Credit and Risk Management | |||
| Cash-Application Engines | |||
| Services | Implementation and Integration | ||
| Managed and Support Services | |||
| By Deployment Model | On-Premise | ||
| Cloud | |||
| By Organization Size | Large Enterprises | ||
| Small and Medium Enterprises | |||
| By End-User Industry | Banking, Financial Services and Insurance | ||
| Information Technology and Telecommunications | |||
| Manufacturing | |||
| Healthcare and Life Sciences | |||
| Transportation and Logistics | |||
| Retail and E-Commerce | |||
| Education | |||
| Other End-User Industries | |||
| By Geography | North America | United States | |
| Canada | |||
| Mexico | |||
| South America | Brazil | ||
| Argentina | |||
| Rest of South America | |||
| Europe | United Kingdom | ||
| Germany | |||
| France | |||
| Italy | |||
| Rest of Europe | |||
| Asia Pacific | China | ||
| Japan | |||
| India | |||
| South Korea | |||
| Rest of Asia Pacific | |||
| Middle East and Africa | Middle East | United Arab Emirates | |
| Saudi Arabia | |||
| Rest of Middle East | |||
| Africa | South Africa | ||
| Egypt | |||
| Rest of Africa | |||


Key Questions Answered in the Report
How fast is the accounts receivable automation market expected to grow between 2026 and 2031?
The market is projected to expand at 11.64% CAGR over 2026-2031 based on Mordor Intelligence data.
Which deployment model will add the most new revenue through 2031?
Cloud deployments, already 79.21% of 2025 spending, are forecast to post a 12.11% CAGR and capture the bulk of incremental revenue.
Why are healthcare organizations accelerating adoption?
Payer-provider claim disputes create long receivable cycles, and automation integrated with EHRs drops denial rates by up to 50%, fueling a 13.24% CAGR in the sector.
What is driving SME uptake of AR automation?
Consumption-based pricing that starts around USD 200 per month lets smaller firms cut DSO without large capital outlays, supporting a 12.07% CAGR in SME spending.
Which region is set to see the fastest growth?
Asia-Pacific, propelled by e-invoicing mandates in China, India, South Korea, and Japan, is projected to achieve a 12.67% CAGR through 2031.
What technology shift differentiates specialist AR vendors from ERP incumbents?
Specialist platforms embed machine-learning engines that auto-match payments and predict credit risk using unstructured data, capabilities legacy ERPs rarely offer.
Page last updated on:


