Market Overview
| Study Period | 2020 - 2031 |
|---|---|
| Market Size (2026) | USD 26.13 Billion |
| Market Size (2031) | USD 46.83 Billion |
| Growth Rate (2026 - 2031) | 12.38% CAGR |
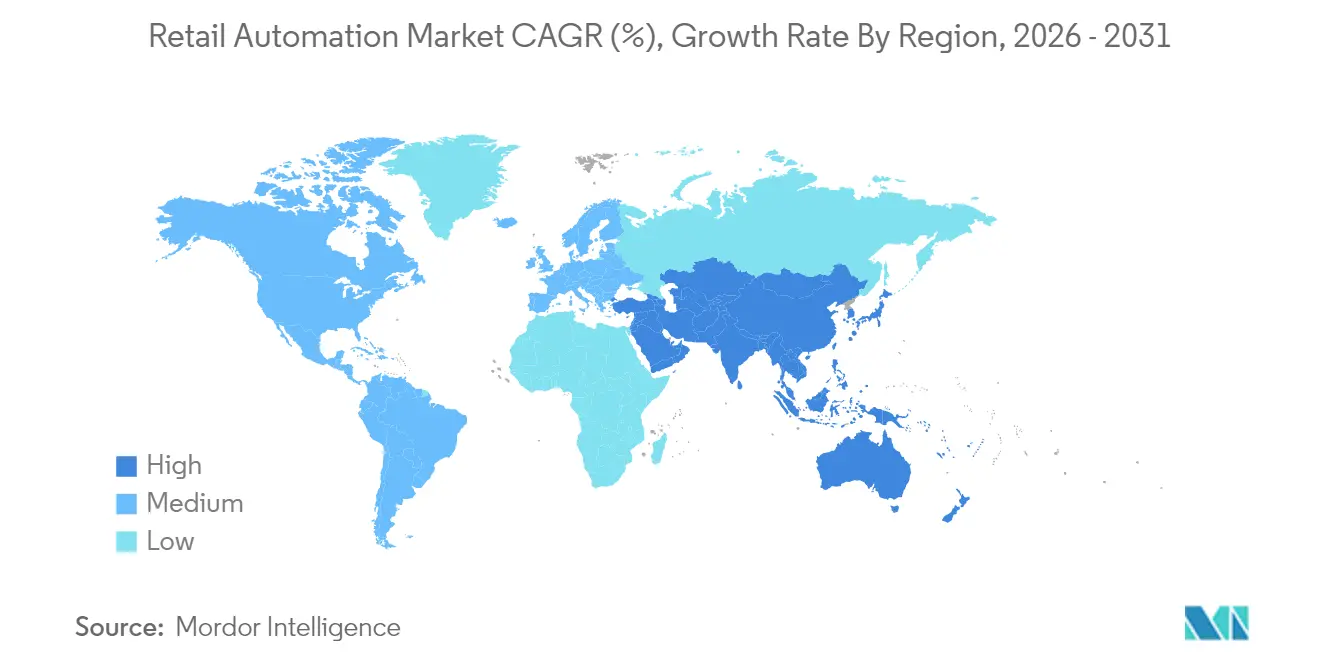
| Fastest Growing Market | Asia Pacific |
| Largest Market | North America |
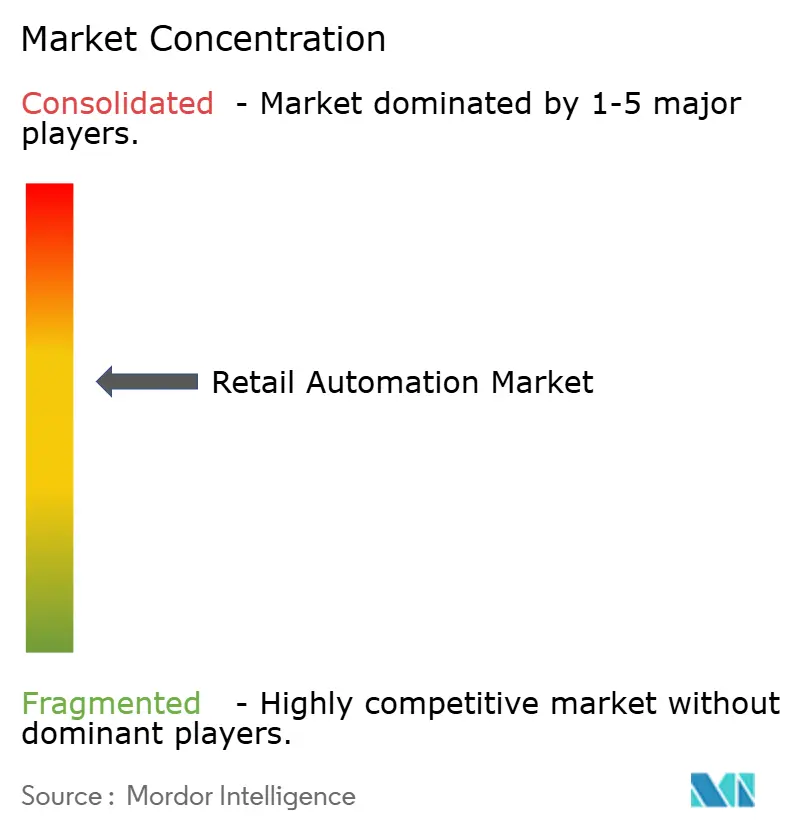
| Market Concentration | Medium |
Major Players *Disclaimer: Major Players sorted in no particular order Image © Mordor Intelligence. Reuse requires attribution under CC BY 4.0. | |
Retail Automation Market Analysis by Mordor Intelligence
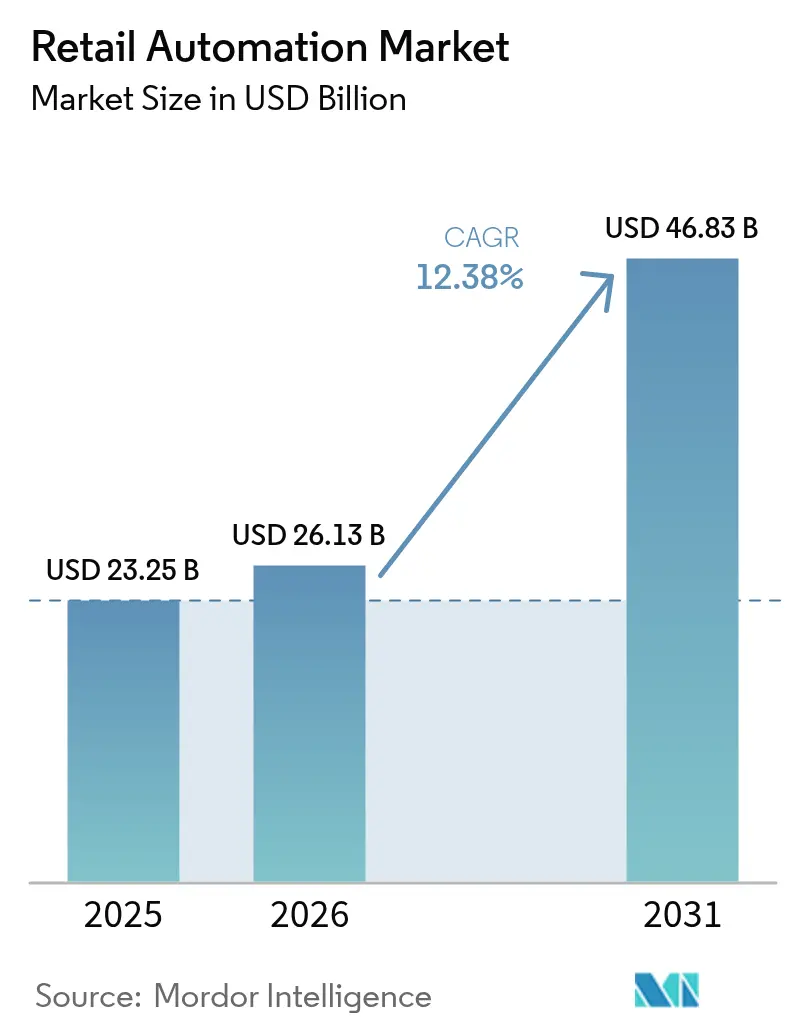
The retail automation market size is expected to grow from USD 23.25 billion in 2025 to USD 26.13 billion in 2026 and is forecast to reach USD 46.83 billion by 2031 at 12.38% CAGR over 2026-2031. Rapid adoption is being driven by retailers seeking higher operating efficiency, lower labor exposure, and seamless customer journeys. Front-of-house technologies such as self-checkout[1]Star Micronics, “Consumer Attitudes Toward Self-Checkout,” starmicronics.com and digital kiosks are expanding quickly, while edge-AI chips are opening new locations where limited connectivity once held back upgrades. Hardware continues to account for most current spending, yet cloud software and managed services are expanding faster as retailers favor subscription models that reduce capital outlay. Intensifying competition from e-commerce platforms is also pushing brick-and-mortar operators to automate order picking and last-mile fulfillment, creating fresh demand for micro-fulfillment centers, robotics, and real-time inventory systems.
Key Report Takeaways
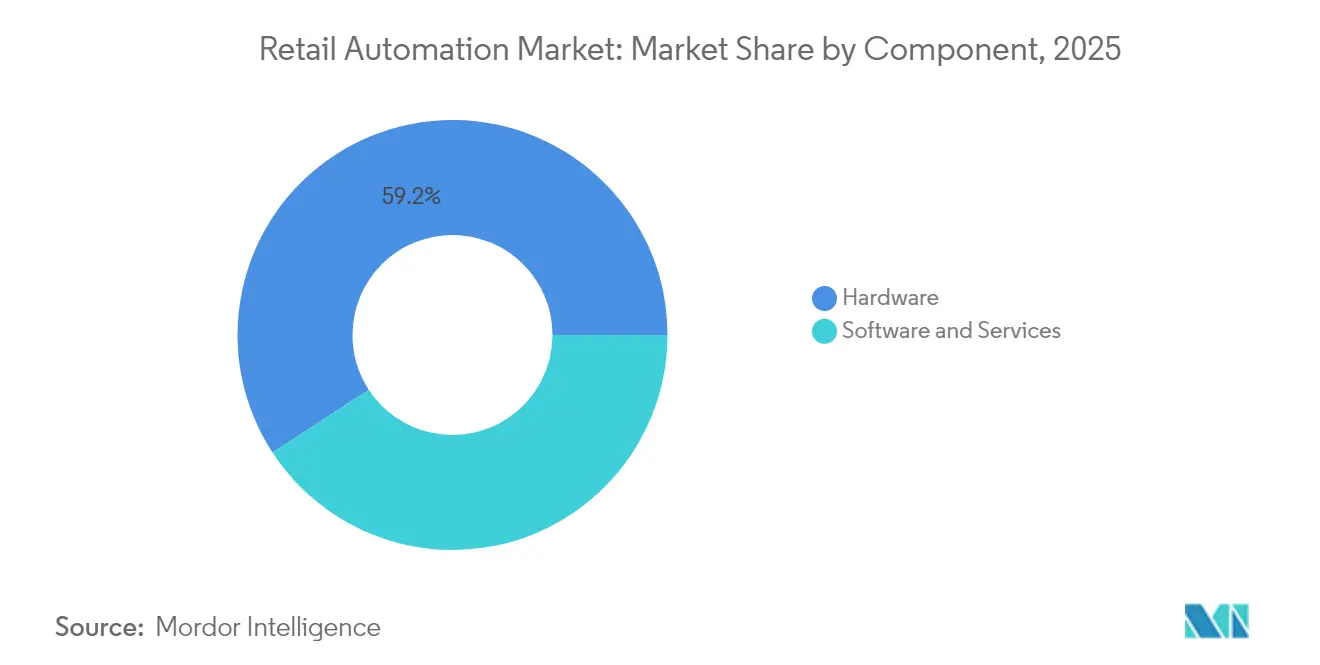
- By component, hardware commanded 59.20% of retail automation market share in 2025, while software and services are projected to expand at a 13.28% CAGR through 2031.
- By implementation, in-store front-of-house systems led with 57.35% of the retail automation market size in 2025; omnichannel fulfillment centers are advancing at 13.62% CAGR to 2031.
- By end-user, grocery retailers held 48.10% retail automation market share in 2025; the hospitality segment is forecast to grow at 13.31% CAGR.
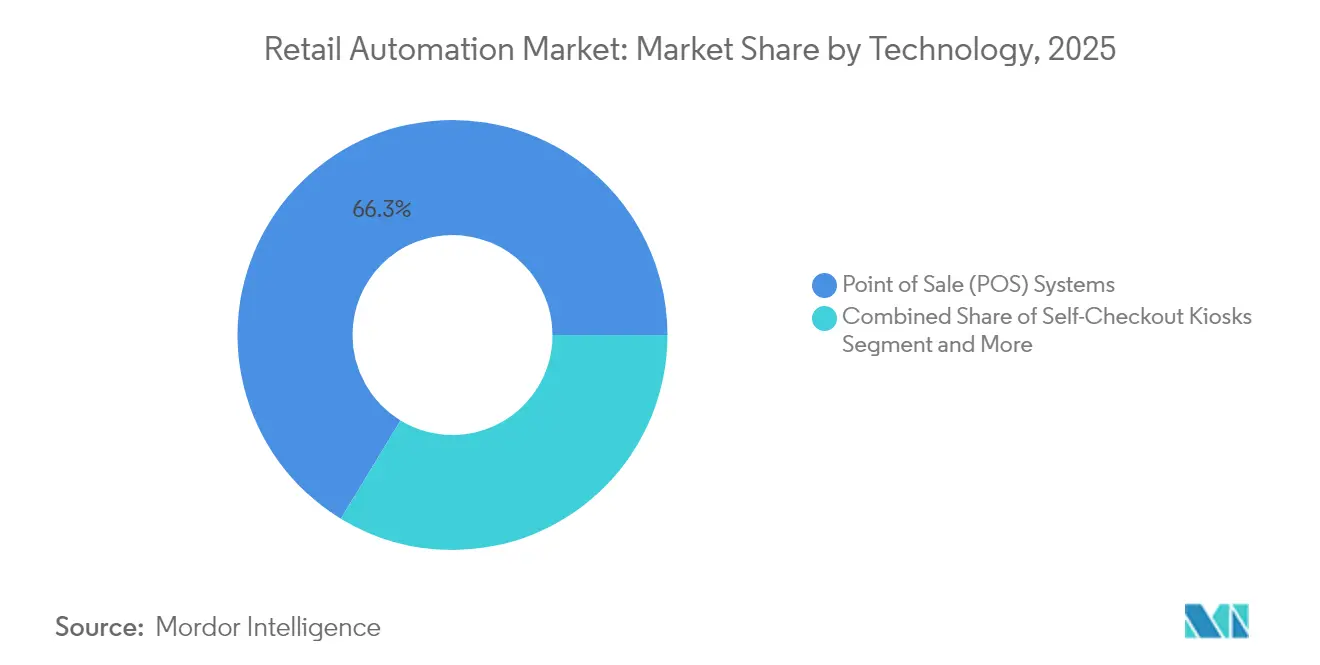
- By technology, POS systems dominated with 66.30% revenue share in 2025, while self-checkout kiosks are projected to rise at 13.73% CAGR.
- By store format, supermarkets accounted for 65.20% of the retail automation market size in 2025 and are expected to expand at 12.98% CAGR.
- By geography, North America led with 34.60% revenue share in 2025; Asia-Pacific is the fastest growing region at a projected 13.72% CAGR.
Note: Market size and forecast figures in this report are generated using Mordor Intelligence’s proprietary estimation framework, updated with the latest available data and insights as of 2026.
Global Retail Automation Market Trends and Insights
Drivers Impact Analysis*
| Driver | (~) % Impact on CAGR Forecast | Geographic Relevance | Impact Timeline |
|---|---|---|---|
| Rising demand for quality and fast service | +3.2% | North America, Europe, global urban hubs | Short term (≤ 2 years) |
| Growth and competition among retail and e-commerce players | +2.8% | Asia-Pacific, global tier-one cities | Medium term (2-4 years) |
| Labor shortages and wage inflation accelerating self-checkout adoption | +2.3% | North America, Europe, Australia, New Zealand | Medium term (2-4 years) |
| Retail-media monetization driving POS data integration | +1.9% | North America, Europe, China | Medium term (2-4 years) |
| Source: Mordor Intelligence | |||
Rising demand for quality and fast service
Shoppers increasingly value speed and accuracy over ancillary store attributes. Retailers upgrading to AI-driven checkout lanes report around 40% shorter transactions, which improves throughput at peak periods. Smaller chains are turning to modular POS bundles that scale in line with footfall. This modularity lowers barriers to entry, letting independents match service levels offered by national retailers. Higher satisfaction is turning into measurable loyalty gains, making store-wide automation a tactical priority for the next two years. The retail automation market is therefore experiencing sharper adoption cycles whenever customer wait times rise.
Growth and competition among retail and e-commerce players
Traditional stores face aggressive online rivals offering near-instant delivery and personalised promotions. Omnichannel commerce platforms that blend online and in-store inventory are becoming strategic. POS terminals are evolving into unified commerce hubs that process orders originating from websites, apps, or in-aisle QR codes. Retailers launching third-party marketplaces are creating new automation use cases, such as automated seller onboarding and fee reconciliation. Conversely, digital-first brands opening physical showrooms are deploying smart shelving and RFID to maintain the real-time stock accuracy they are accustomed to online. These intersecting models widen the addressable base of the retail automation market.
Labor shortages and wage inflation accelerating self-checkout adoption
Retail wages continue to climb faster than headline inflation, prompting chains to re-engineer staffing[2]Michele Dupré, “2025 Retail Trends Report,” Verizon, verizon.com. One attendant can now supervise four to six self-checkout stations, cutting front-end labor hours by up to 30%. Savings are redirected to service roles such as aisle advice and online order picking. This redeployment is changing staff skill requirements without eliminating headcount outright. The retail automation industry is responding with designs that feature predictive maintenance, antimicrobial screens, and ergonomic layouts that minimise compliance training.
Retail-media monetization driving POS data integration
In-store traffic is turning into a high-margin advertising asset. Retail media networks use live basket data to serve targeted promotions on kiosks, apps, and electronic shelf labels. Media revenue, often worth 5-7% of digital sales, is helping finance further automation, creating a self-reinforcing investment loop. Vendors are embedding ad-tech APIs into next-generation POS software so that inventory, pricing, loyalty, and advert serving operate on a single data layer. As a result, the retail automation market sees rising demand for analytics engines capable of billions of real-time impressions each year.
Restraints Impact Analysis*
| Restraint | (~) % Impact on CAGR Forecast | Geographic Relevance | Impact Timeline |
|---|---|---|---|
| High hardware failure rates | -1.9% | Emerging markets, harsh environments | Short term (≤ 2 years) |
| Rising self-checkout fraud forcing rollout pauses | -1.3% | North America, Europe | Short term (≤ 2 years) |
| Source: Mordor Intelligence | |||
High hardware failure rates
Retail equipment often runs near-continuously in temperature-fluctuating, dust-heavy settings, leading to component fatigue. Self-checkout scanners exhibit higher downtime than staffed lanes, causing queue abandonment and service desk bottlenecks. Each outage minute can cost a high-volume supermarket thousands in missed revenue and brand erosion. Manufacturers are embedding ruggedised sensors and remote diagnostics, yet the problem remains acute in emerging markets lacking spare-part supply chains. These reliability issues dampen short-term ordering cycles and influence the retail automation market toward service-level-agreement contracts that shift maintenance risk to suppliers.
Rising self-checkout fraud forcing rollout pauses
Expanded self-service invites new types of shrinkage, from barcode switching to walk-aways. Incidents have risen sharply since 2019, prompting several large chains to slow planned installations while they evaluate AI vision, weight verification, and ID scanning add-ons. Shrinkage at self-checkout can reach 7% of sales compared with 0.3% for staffed lanes, eroding the labor savings that justified investment. Solution providers are integrating computer vision, edge-AI inference, and real-time intervention alerts. Until accuracy is proven, some retailers will cap self-service penetration, tempering near-term revenue growth for the retail automation market.
*Our forecasts treat driver/restraint impacts as directional, not additive. The impact forecasts reflect baseline growth, mix effects, and variable interactions.
Segment Analysis
By Component: Software Services Outpace Hardware Growth
Hardware accounted for 59.20% of 2025 revenue as retailers installed POS devices, kiosks, and RFID gateways. However, software and services are forecast to outgrow hardware at 13.28% CAGR to 2031. The retail automation market size for software subscriptions is expanding as cloud deployment enables continuous feature updates rather than episodic hardware refreshes. Open-API hardware designs now let third-party developers plug in analytics, loyalty engines, and payment wallets, blurring traditional component lines.
Greater focus on data-driven operations is benefiting SaaS providers offering AI-powered forecasting and loss prevention. Managed service contracts bundle uptime guarantees, security patches, and predictive maintenance, shifting spending from capital to operating budgets. As retailers rationalise physical footprints, modular fixtures linked to cloud orchestration supply flexibility. Consequently, solution vendors that pair rugged hardware with scalable platforms are gaining share.


By End-User: Grocery Dominance Amid Hospitality Surge
Grocery chains held 48.10% of 2025 revenue owing to high basket churn and thin margins that demand process efficiency. Micro-fulfillment systems, electronic shelf labels, and smart scales are central to this group’s automation roadmap. The retail automation market share of grocery is expected to remain significant, yet hospitality operators are posting the fastest gains at 13.31% CAGR. Quick-service restaurants are adding ordering kiosks, kitchen display systems, and robotic food prep to tackle wage pressure and speed expectations.
Hotels are deploying mobile check-in, digital keys, and service robots that deliver linens or room service trays, illustrating cross-sector technology spill-over. While general merchandise and specialty sectors automate inventory visibility, their growth pace is moderate relative to grocery and hospitality. Vendors tailoring solutions to sector-specific workflows will capture incremental opportunities as use cases broaden.
By Implementation: Omnichannel Fulfillment Centers Accelerate
Customer-facing installations, such as self-checkout, held a 57.35% share in 2025 because they directly address queue times and upsell. Yet omnichannel fulfillment centers are the fastest-growing implementation, projected at 13.62% CAGR. The retail automation market size linked to micro-fulfillment is climbing as retailers convert back-of-store zones into automated pick stations that process online orders in under 30 minutes.
This reallocation of space reduces last-mile costs and supports same-day delivery pledges. Warehouses and back-store areas continue to adopt AMRs, automated sorters, and RFID portals, but growth lags behind front-of-house upgrades. Retailers integrating demand forecasting, order routing, and labor scheduling across all three zones report double-digit efficiency gains, reinforcing unified investment cycles.
By Technology: Self-Checkout Kiosks Gain Momentum
POS platforms remained the bedrock with 66.30% revenue share in 2025, acting as the transactional system of record. Still, self-checkout kiosks are expanding at a 13.73% CAGR as shoppers value control and speed. Computer vision cameras and AI object recognition now cut mis-scans, while voice guidance improves accessibility. The retail automation market embraces RFID, barcode, and vision sensors to achieve item-level accuracy in mixed baskets.
Robotics and AMRs, though a smaller slice, are posting double-digit growth as costs fall and use cases mature. Brain Corp reports that store-friendly AMRs run 10 hours per charge and slot into existing cleaning or inventory routines, avoiding the ceiling-height constraints of drones. Over time, multi-sensor architectures linking kiosks, mobile apps, and shelf scanners will deliver end-to-end visibility from stockroom to checkout.
By Store Format: Supermarkets Lead Automation Adoption
Supermarkets controlled 65.20% of 2025 spending and are projected to grow at 12.98% CAGR to 2031. High SKU volumes and perishables require granular inventory control. Smart shelves alert staff to out-of-stocks, while computer vision validates produce identification. The retail automation market size in the supermarket segment is set to widen as chains invest in voice-assisted navigation and augmented reality promotions that shorten trip time.
Hypermarkets pursue similar tools across larger footprints, emphasizing autonomous floor scrubbers and mobile picking carts. Convenience and fuel retailers focus on 24/7 unattended formats using computer-vision checkout and smart lockers. Department stores, with lower footfall frequency, allocate funds to interactive fitting mirrors and endless-aisle kiosks that integrate with e-commerce catalogs. Each format demands distinct user interfaces and device durability, steering solution design diversity.
Geography Analysis
North America contributed 34.60% of 2025 revenue. High wages, early adoption culture, and strong vendor ecosystems underpinned leadership. Retailers are piloting computer-vision POS lanes expected to proliferate by 2026. Edge-AI processing inside scanners reduces latency and lessens reliance on data centers. Privacy regulations and shrinkage concerns temper unrestrained rollouts, but innovation pipelines remain healthy.
Asia-Pacific is the fastest-growing region at a 13.72% projected CAGR. China pioneers mobile wallet-only stores and robotic micro-warehouses, while India’s e-commerce surge fuels warehouse automation demand. Autonomous mobile robot penetration in regional facilities is forecast to climb from 27% to 92% within five years, underscoring the appetite for labor-saving devices. Rural expansion benefits from edge-AI chips that work in low-bandwidth sites, enlarging the retail automation market reach.
Europe holds a significant share, led by Western economies investing in energy-efficient systems and circular packaging. Eastern markets are catching up as wages rise and cross-border chains modernize. Strict data-protection rules shape computer-vision deployments, pushing vendors to implement on-device anonymization. South America and the Middle East, and Africa, though smaller today, exhibit strong long-term potential. Brazil’s reforming tax environment encourages cash-to-digital migration, while Gulf states fund smart-city retail projects that bundle logistics automation and contactless payment infrastructure.

Competitive Landscape
The top five providers hold just above 30% of global revenue, indicating moderate concentration. NCR Corporation, Diebold Nixdorf, Zebra Technologies, Honeywell International, and Toshiba Global Commerce Solutions differentiate through broad portfolios and global service networks. NCR Voyix is moving production of self-checkout hardware to Ennoconn, freeing capital for its cloud platform, a sign that suppliers are prioritizing software valuation over fabrication scale[3]NCR Voyix Corporation, “Form 8-K: Manufacturing Outsourcing Agreement,” sec.gov.
Hardware specialists are partnering with AI software start-ups to embed analytics at the edge. Zebra’s Aurora suite links vision-guided robotics with AMRs, reflecting demand for single-vendor stacks that cut integration time. Acquisitions target robotics orchestration, predictive maintenance, and computer vision. Regional integrators compete on deployment speed and local regulations, fragmenting share beneath the global top tier.
Retailers prefer vendors able to supply end-to-end coverage spanning checkout, inventory, and fulfillment. This creates pressure on niche providers to align with ecosystems or specialise further. White-space opportunities remain in emerging markets where legacy infrastructure is thin. As edge-AI chips and 5G mature, late-adopting regions could leapfrog to advanced architectures, resetting competitive positioning in the retail automation market.
Retail Automation Industry Leaders
Datalogic S.P.A
Diebold Nixdorf, Incorporated
ECR Software Corporation
Emarsys eMarketing Systems AG
Fiserv Inc.
- *Disclaimer: Major Players sorted in no particular order

Recent Industry Developments
- May 2025: Zebra Technologies unveiled the Aurora VGR Assistant and Zebra Symmetry Fulfillment, linking vision-guided robots with AMRs to speed retail picking workflows.
- April 2025: Dematic opened a Saudi Arabia office to meet the rising Middle East demand for warehouse and store automation.
- March 2025: Zebra Technologies introduced the Aurora Velocity scan tunnel and the FS80 fixed industrial scanner at ProMat 2025 to boost high-speed package sortation.
- March 2025: Numina Group and KUKA Robotics partnered to deliver Batchbot, combining AMRs with Pick by Voice to raise retail order-picking productivity by up to 50%.
- March 2025: OCR Solutions released advanced ID scanning to curb self-checkout fraud by authenticating documents in real time.


Research Methodology Framework and Report Scope
Market Definitions and Key Coverage
Our study defines the retail automation market as revenue generated from hardware, software, and service offerings that allow store-front, warehouse, and omnichannel retail processes to run with minimal human labor. Covered technologies include self-checkout kiosks, cloud POS, barcode/RFID data capture, store or warehouse robotics, electronic shelf labels, and analytics platforms.
Scope Exclusions: We exclude pure e-commerce platform fees, generic marketing automation suites, and non-retail material handling equipment.
Segmentation Overview
- By Component
- Hardware
- Software and Services
- By End-User
- Grocery
- General Merchandise
- Hospitality
- By Implementation
- In-store Front-of-house
- Back-store / Warehouse
- Omnichannel Fulfilment / Micro-fulfilment Centers
- By Technology
- Point of Sale (POS) Systems
- Self-Checkout Kiosks
- Radio-Frequency Identification (RFID)/Barcode
- Robotics/Autonomous Mobile Robots (AMR)
- By Store Format
- Supermarkets
- Hypermarkets
- Convenience/Fuel
- Department Stores
- By Geography
- North America
- United States
- Canada
- Europe
- United Kingdom
- Germany
- France
- Italy
- Rest of Europe
- Asia-Pacific
- China
- Japan
- India
- Australia and New Zealand
- Rest of Asia-Pacific
- South America
- Brazil
- Argentina
- Rest of South America
- Middle East and Africa
- Middle East
- Saudi Arabia
- United Arab Emirates
- Turkey
- Rest of Middle East
- Africa
- South Africa
- Rest of Africa
- Middle East
- North America
Detailed Research Methodology and Data Validation
Primary Research
Mordor Intelligence analysts interviewed grocery, fashion, and convenience chains across North America, Europe, and Asia Pacific, along with solution vendors and integrators, to validate adoption rates, average selling prices, and automation priorities surfaced in desk research.
Desk Research
We began with tier-1 public data such as the US Census Monthly Retail Trade survey, Eurostat Retail Index, World Bank logistics indicators, and National Retail Federation briefs. Company filings, investor decks, patents, and respected news outlets added context on technology rollouts and pricing. Paid assets, such as Dow Jones Factiva for news flow, D&B Hoovers for vendor splits, and Volza customs logs for kiosk imports, tightened revenue and shipment estimates. The sources named are illustrative; many others informed data capture and cross-checks.
Market-Sizing & Forecasting
We start with a top-down pool built from global retail sales, addressable store counts, and automation penetration, then cross-check with sampled vendor roll-ups. Inputs include lane counts per store, kiosk ASP curves, robot installs per million orders, wage inflation, and contactless payment share. Forecasts rely on multivariate regression plus scenario analysis around labor and regulation. Gaps in bottom-up detail are bridged with conservative proxies approved during interviews.
Data Validation & Update Cycle
Outputs face anomaly scans, peer ratio checks, and a two-level analyst review before sign-off. Models refresh annually, with interim updates for material events such as major labor contracts or tariff shifts. A final pre-release scrub ensures buyers receive the latest view.
Why Mordor's Retail Automation Baseline Commands Reliability
Published numbers vary because each firm frames scope, base year, and exchange rates differently.
Other publishers often add marketing software, count pilot deals as full revenue, or hold static ASPs, whereas Mordor Intelligence keeps a retail-specific scope, live price files, and rolling currency updates.
Benchmark comparison
| Market Size | Anonymized source | Primary gap driver |
|---|---|---|
| USD 23.25 B (2025) | Mordor Intelligence | - |
| USD 24.36 B (2024) | Global Consultancy A | Includes marketing automation and pilot projects |
| USD 26.26 B (2024) | Trade Journal B | Adds logistics robotics outside retail |
| USD 27.62 B (2024) | Regional Consultancy C | Uses older FX rates and omits price erosion |
This comparison shows that Mordor's disciplined scope, dual-path modeling, and yearly refresh provide a transparent baseline managers can trust.


Key Questions Answered in the Report
What is the current value of the retail automation market?
The retail automation market stands at USD 26.13 billion in 2026.
How fast is the market expected to grow through 2031?
The market is projected to expand at a 12.38% CAGR, reaching USD 46.83 billion by 2031.
Which region is growing fastest?
Asia-Pacific is forecast to post a 13.72% CAGR between 2026 and 2031, the highest among all regions.
What technology segment is expanding most quickly?
Self-checkout kiosks are expected to rise at a 13.73% CAGR due to labor pressures and shopper preference for quick transactions.
Which end-user segment leads adoption?
Grocery accounts for 48.10% of 2025 revenue thanks to high transaction volumes and tight margins that favor efficiency gains.
Why are retailers integrating retail media with POS data?
Retail media monetization provides an additional 5-7% of e-commerce sales in high-margin advertising revenue, offsetting automation costs while enhancing targeted promotions.
Page last updated on:


