
Cloud Workflow Market Size and Share
Market Overview
| Study Period | 2020 - 2031 |
|---|---|
| Market Size (2026) | USD 7.53 Billion |
| Market Size (2031) | USD 15.68 Billion |
| Growth Rate (2026 - 2031) | 15.82 % |
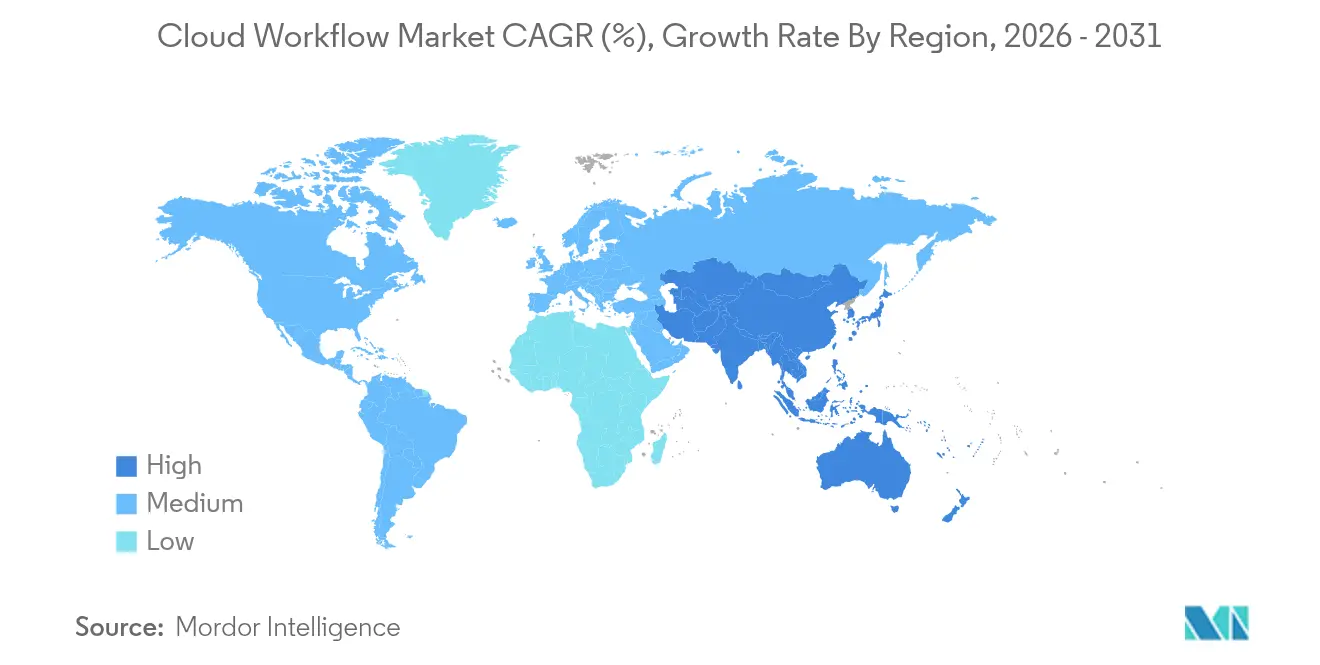
| Fastest Growing Market | Asia Pacific |
| Largest Market | North America |
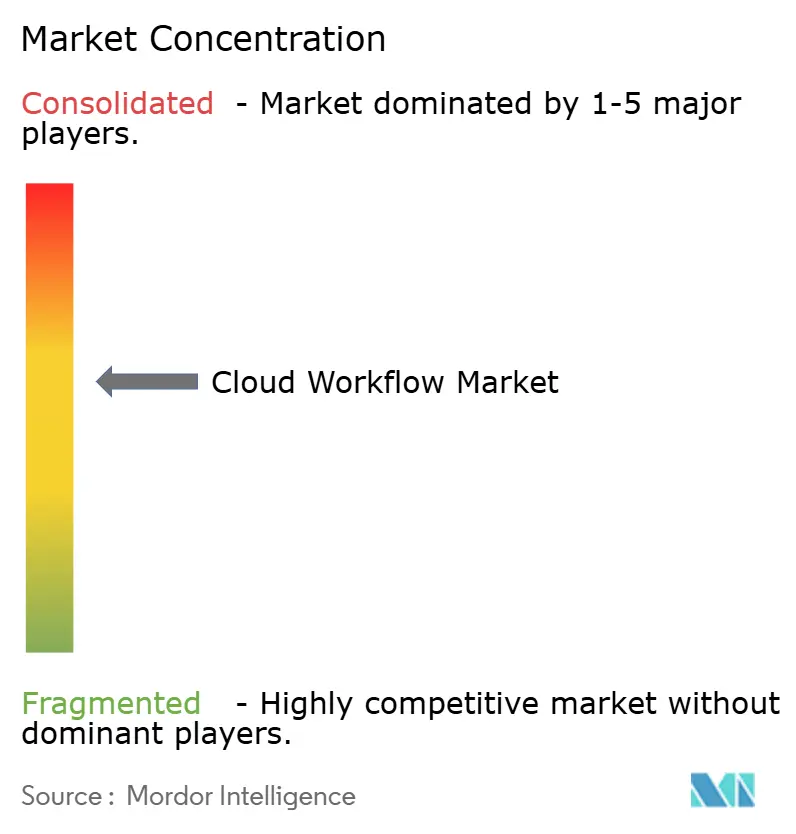
| Market Concentration | Medium |
Major Players *Disclaimer: Major Players sorted in no particular order Image © Mordor Intelligence. Reuse requires attribution under CC BY 4.0. | |
Cloud Workflow Market Analysis by Mordor Intelligence
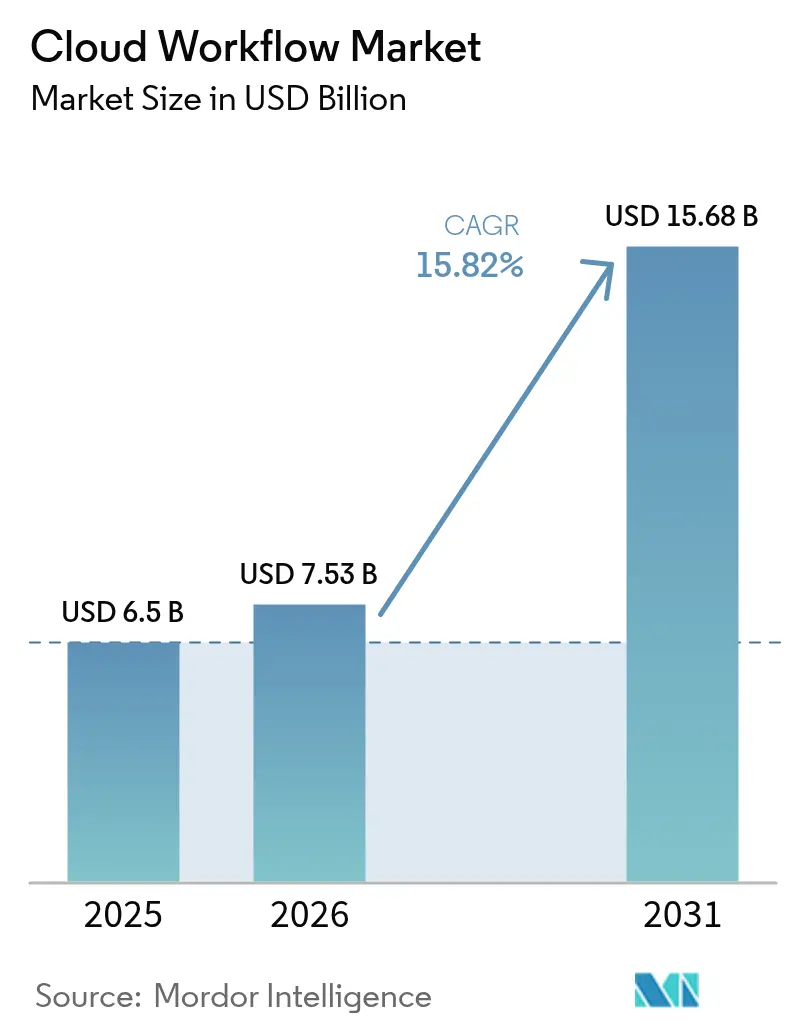
Cloud workflow market size in 2026 is estimated at USD 7.53 billion, growing from 2025 value of USD 6.50 billion with 2031 projections showing USD 15.68 billion, growing at 15.82% CAGR over 2026-2031. Strong demand stems from enterprises replacing legacy process tools with AI-enriched orchestration platforms that promise faster decision cycles, lower manual workload, and tighter regulatory alignment. Low-code design studios, now bundled into most leading suites, let non-technical users automate everyday tasks without compromising security controls. The spread of generative AI further raises platform utility, allowing conversational creation of flows and real-time anomaly detection. Vendors differentiate through industry-specific templates, sovereign-cloud alignment, and cross-platform interoperability to reduce vendor-lock risks. North America’s first-mover advantage keeps it the largest regional buyer, while Asia-Pacific’s public-sector digitization programs create the steepest growth curve.
Key Report Takeaways
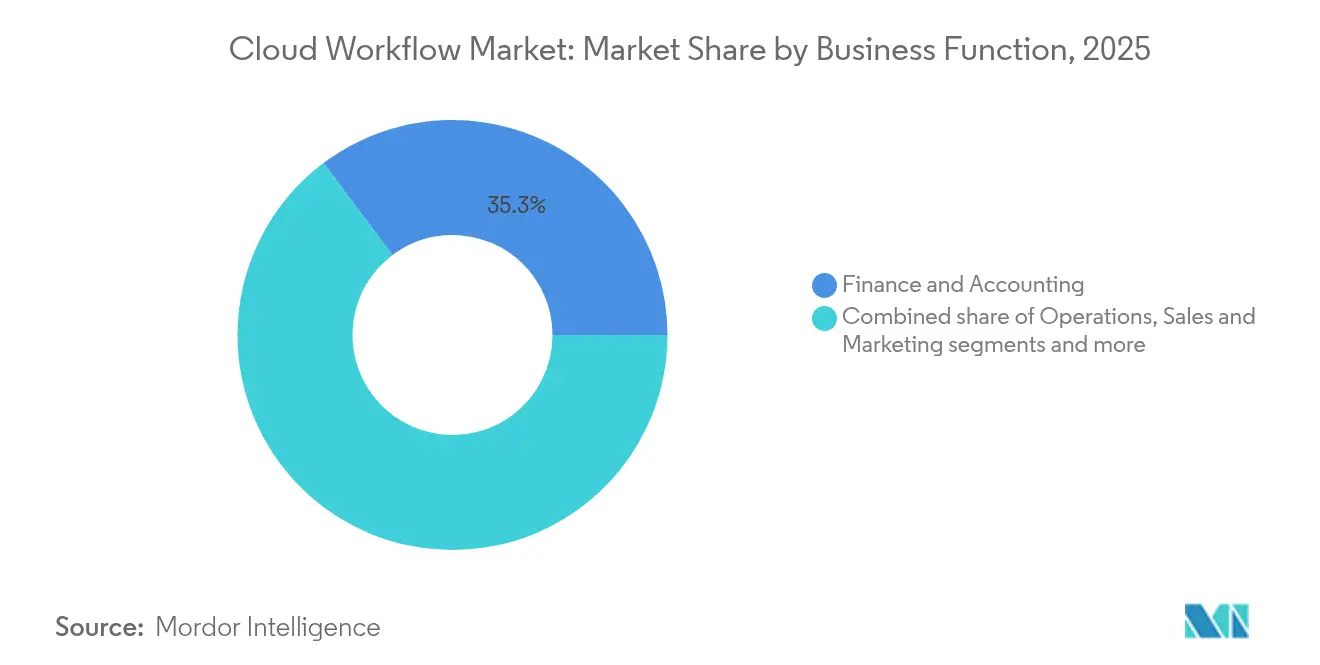
- By business function, Finance and Accounting led with 35.25% revenue share in 2025; Sales and Marketing is projected to expand at a 16.32% CAGR through 2031.
- By deployment model, Public Cloud held 66.10% of the cloud workflow market share in 2025, while Hybrid Cloud is forecast to grow at 17.02% CAGR to 2031.
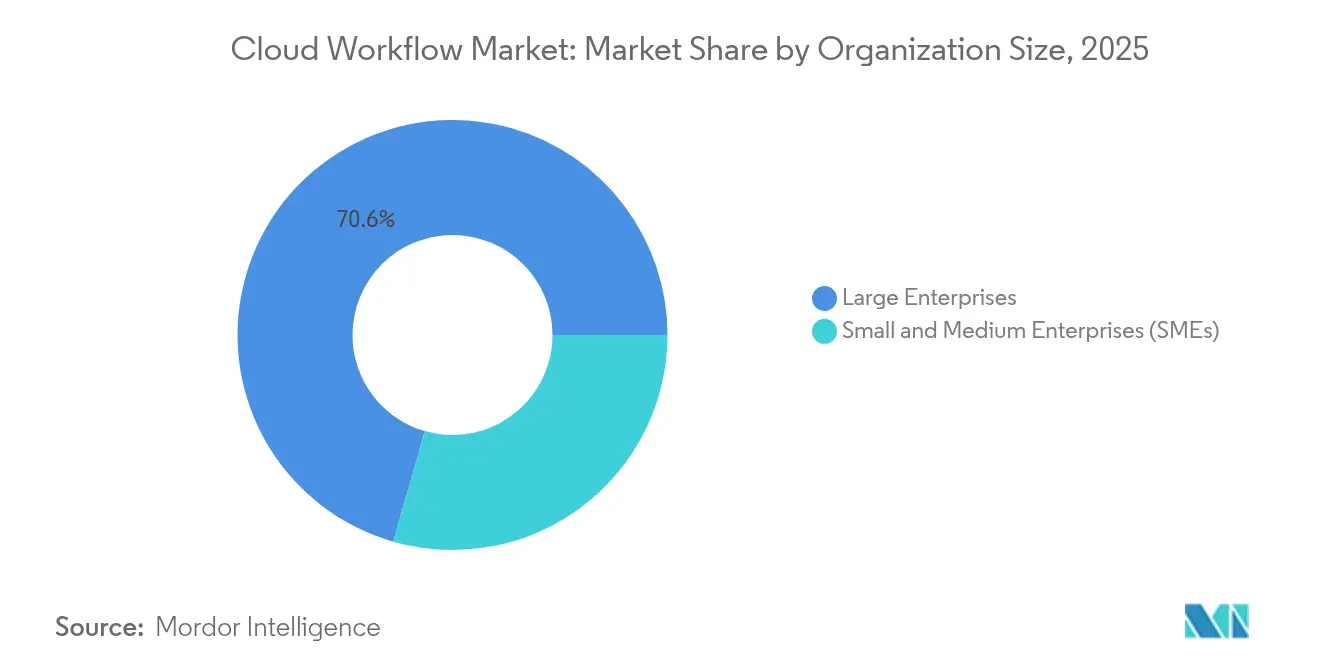
- By organization size, Large Enterprises accounted for 70.55% share of the cloud workflow market size in 2025 and Small and Medium Enterprises are advancing at an 17.45% CAGR through 2031.
- By end-user vertical, BFSI captured 31.75% of revenue in 2025, whereas Retail and E-Commerce is set to rise at a 15.92% CAGR to 2031.
- By geography, North America commanded 38.65% share of the cloud workflow market size in 2025 and Asia-Pacific is expected to post a 16.68% CAGR through 2031.
Note: Market size and forecast figures in this report are generated using Mordor Intelligence’s proprietary estimation framework, updated with the latest available data and insights as of 2026.
Market Trends and Insights
Drivers Impact Analysis of Cloud Workflow Market*
| Driver | (~) % Impact on CAGR Forecast | Geographic Relevance | Impact Timeline |
|---|---|---|---|
| Rapid migration to public and hybrid cloud infrastructure | +2.8% | Global, with North America and Europe leading adoption | Medium term (2-4 years) |
| Rise of low-/no-code platforms among business users | +3.2% | Global, particularly strong in North America and APAC | Short term (≤ 2 years) |
| AI-driven automation elevating ROI and analytics insight | +4.1% | Global, with early adoption in North America and Western Europe | Medium term (2-4 years) |
| Operational-cost pressure pushing workflow outsourcing | +2.5% | Global, with emphasis on cost-sensitive emerging markets | Long term (≥ 4 years) |
| Expansion of industry-specific sovereign cloud templates | +1.9% | APAC core, spill-over to MEA and Latin America | Long term (≥ 4 years) |
| Edge-native orchestration for latency-critical IoT flows | +1.6% | Global, with manufacturing hubs in APAC and Europe | Long term (≥ 4 years) |
| Source: Mordor Intelligence | |||
Rapid Migration to Public and Hybrid Cloud Infrastructure
Enterprises view cloud migration as fundamental to modernizing workflows that rely on elastic compute and global reach. Multi-cloud patterns give risk-averse industries flexibility to segregate sensitive workloads while tapping public-cloud economics for burst capacity. A 2023 IBM study found that 92% of executives aim to digitize and apply AI to their workflows by 2025. Asia-Pacific banks, guided by updated supervisory notices, now deploy regulated workloads on cloud platforms once off-limits, accelerating regional uptake. As more systems operate in cloud environments, each new integration raises network effects that amplify platform value. Sovereign-cloud blueprints in Australia, Japan, and Singapore illustrate how policy can shape architecture choices without stalling adoption.
Rise of Low-/No-Code Platforms Among Business Users
Low-code design tools push automation to the business front line. KPMG reports that every surveyed enterprise has achieved measurable ROI from low-code deployments, with 34% already running the technology inside core ERP workflows. Generative AI now turns text prompts into live flows, shrinking build cycles from weeks to hours. Democratization boosts agility but complicates governance, as a wider creator base increases variation in security posture. Platform vendors answer with policy-driven guardrails and unified monitoring that keep compliance teams in control. Microsoft’s deep integration of ServiceNow’s Now Assist into Teams shows how conversational experiences expand the user pool without rewriting back-end logic.
AI-Driven Automation Elevating ROI and Analytics Insight
Machine-learning enhancement transforms rule-based automations into adaptive, self-optimizing workflows. UiPath’s use of advanced language models reduced healthcare prior-authorization times by 50%, underscoring tangible savings. AI heat-maps detect bottlenecks in near real time, recommending fixes that operations managers can deploy in a click. Appian’s Autoscale runs up to 6 million workflows per hour under FedRAMP controls, proving that compliance and velocity are not mutually exclusive[1]Appian, “Introducing Appian Autoscale,” appian.com. Competitive advantage arises from the data exhaust of every execution, letting firms spot trends invisible to manual review. Paid AI add-ons therefore command premium pricing yet often pay back within a fiscal quarter.
Operational-Cost Pressure Pushing Workflow Outsourcing
With margins tight, companies externalize non-core processes to partners that bundle technology, talent, and outcome guarantees. Digital components lift contract value far beyond classic labor-arbitrage deals, creating room for co-innovation on top of base cost savings. Vendors assume KPIs such as cycle-time reduction or error-rate caps, aligning incentives with client objectives. Nevertheless, success hinges on upfront process re-design and clear joint-accountability frameworks; otherwise, automation merely shifts inefficiency outside the building.
Restraints Impact Analysis of Cloud Workflow Market*
| Restraint | (~) % Impact on CAGR Forecast | Geographic Relevance | Impact Timeline |
|---|---|---|---|
| Persistent data-security and privacy concerns | -2.1% | Global, with heightened impact in Europe due to GDPR | Short term (≤ 2 years) |
| Acute skill gaps in cloud-native workflow design | -1.8% | Global, particularly acute in emerging markets | Medium term (2-4 years) |
| Vendor lock-in and poor multi-cloud interoperability | -1.4% | Global, with emphasis on enterprises with complex IT landscapes | Medium term (2-4 years) |
| Escalating egress-fee economics impacting TCO | -0.9% | Global, with reduced impact as major providers cut fees | Short term (≤ 2 years) |
| Source: Mordor Intelligence | |||
Persistent Data-Security and Privacy Concerns
Organizations continue to weigh automation gains against exposure risks when data leaves internal boundaries. The Cloud Security Alliance warns that opaque data flows complicate residency compliance in jurisdictions such as the European Union[2]Cloud Security Alliance, “Data Residency in the Cloud Era,” cloudsecurityalliance.org. Healthcare providers in particular must prove chain-of-custody for protected health information across multi-cloud footprints. Fragmented statutes in Asia-Pacific add cost and delay, as each new project demands a fresh legal review. Providers respond with region-pinning, customer-managed encryption keys, and audit-ready logging, yet confidence builds slowly.
Acute Skill Gaps in Cloud-Native Workflow Design
A global talent shortfall drives up project costs and stretches timelines. Studies suggest that unfilled roles in cloud and automation may reach 85 million by 2030, eroding gains from faster software cycles. HashiCorp data shows 91% of practitioners report avoidable cloud spend due to sub-optimal configurations, much of it traceable to skill gaps. Upskilling efforts help but cannot close the gap overnight, leaving consultancies and managed-service providers to plug holes at premium rates.
*Our forecasts treat driver/restraint impacts as directional, not additive. The impact forecasts reflect baseline growth, mix effects, and variable interactions.
Cloud Workflow Market Segment Analysis
By Business Function:
Finance and Accounting Hold PrimacyFinance owns the largest slice of the cloud workflow market with 35.25% share in 2025. Compliance calendars, multi-entity consolidation, and audit trails make automated workflows indispensable to CFO teams. As generative AI matures, real-time anomaly spotting and auto-narrative reporting further raise adoption appetite. Sales and Marketing, while smaller, posts the fastest growth at 16.32% CAGR as revenue teams orchestrate omnichannel journeys and AI-led lead scoring. These gains should lift the overall cloud workflow market size for front-office flows to USD-denominated, double-digit growth every year through 2031. Cross-function templates blend finance approval gates with sales quoting, reflecting a trend toward end-to-end order-to-cash automation.
The cloud workflow industry also sees Operations modernize supply-chain coordination, and HR leaders automate recruitment funnels. UiPath’s October 2024 pact with SAP shows how cross-stack connectors help companies blend ERP and non-ERP data without manual extract scripts. Legal and procurement remain underpenetrated yet ripe, as contract-lifecycle stress mounts with global supply volatility.



By Deployment Model:
Hybrid Strategies Gain MomentumPublic cloud retains a 66.10% hold on the cloud workflow market in 2025. Yet hybrid architectures grow faster, clocking 17.02% CAGR as firms hedge sovereignty risks. Data-sensitive workloads anchor on-prem cores while elastic analytics run in the public layer. As egress fees drop, the cloud workflow market share of hybrid designs will rise steadily, giving platform vendors a fresh battleground over portability perks. The cloud workflow industry therefore prizes open APIs and policy-driven portability that let administrators shift workloads without re-authoring logic.
Private clouds remain for classified data or regulatory edge cases but attract less net-new spend. Google’s 2024 cut in cross-cloud transfer costs signals a broader shift toward fee relief, encouraging architecture choices based on performance rather than penalty avoidance.
By Organization Size:
SME Acceleration Reshapes DemandLarge enterprises still command 70.55% of spending, yet SMEs produce the highest velocity at 17.45% CAGR. Simplified subscriptions, pre-built flows, and embedded best-practice guards lower entry friction, aligning with lean IT budgets. Appian’s SMB cohort delivered double-digit cloud-subscription growth in 2024, proving willingness to pay for outcome-oriented tooling. As SME volume expands, vendors must rebalance packaging, moving from seat-based to usage-tier models that reward efficiency gains.
The vast unmet base among mid-market firms should add millions of new users to the cloud workflow market by 2031. Open Marketplace plug-ins for payroll, invoicing, and local tax filings draw interest from owners who need compliance assurance without hiring specialists.
By End-User Vertical:
BFSI Leads While Retail Gains SpeedBFSI continues to capture 31.75% of cloud workflow market size due to stringent risk and reporting mandates. Anti-money laundering flows, real-time fraud detection, and credit approvals anchor investment. Retail and E-Commerce, running at 15.92% CAGR, automates personalization, inventory updates, and returns processing. Healthcare gains momentum through HIPAA-compliant clinical flows such as UiPath’s medical-record summarizer, showing that specialized AI agents can unlock regulated sectors. Energy, telecom, and government round out adoption, each with unique compliance layers but similar need for traceability.
Horizontal platforms respond by shipping vertical starter kits that shorten time-to-value. ServiceNow’s telecom service-management pack and Appian’s life-science quality suite illustrate this move toward out-of-the-box compliance.
Geography Analysis
North America and Europe Cloud Workflow Market
North America controls 38.65% of 2025 spend, buoyed by Fortune 500 cloud-first mandates, deep venture capital activity, and supportive regulators who grant cloud usage approvals to banks and federal agencies. Tight labor markets accelerate automation investments as firms offset talent shortages with digital labor. Europe remains compliance-centric; GDPR spurs demand for data-sovereign architectures and meticulous audit controls. Localized regions inside hyperscaler footprints enable resident processing, keeping continental adoption on a steady upward path despite policy complexity.
APAC Cloud Workflow Market
Asia-Pacific delivers the fastest climb at 16.68% CAGR. Government stimulus programs, such as Singapore’s Digital Economy Blueprint and India’s Production-Linked Incentive updates, push companies toward cloud modernization. The Asian Development Bank projects that cloud computing could lift regional GDP by up to 0.7% between 2024 and 2028. Sovereign-cloud deals in Korea and Japan illustrate a pragmatic answer to residency concerns without forgoing hyperscaler speed. ServiceNow’s 2025 investment in inMorphis signals vendor commitment to build local talent pools and maintain culturally-relevant support.
MEA, South America and Oceania Cloud Workflow Market
The Middle East and Africa, though a smaller base, reports double-digit expansion as energy and public-sector entities digitize citizen services. The launch of region-hosted data centers by leading clouds removes a prior adoption hurdle. South America progresses unevenly; Brazil advances on the back of central-bank open-finance mandates while smaller economies lag until telecom bandwidth improves. Cross-market collaboration schemes, such as New Zealand’s All-of-Government Common Process Model that shares workflow blueprints with agencies, demonstrate how policy leadership can compress rollout time.

Regulatory Landscape
Regulation shaping cloud workflow adoption centers on privacy, cybersecurity, and AI governance requirements that affect how workflows are designed, monitored, and audited. In the European Union, the EU AI Act entered into force on August 1, 2024, with full application effective August 2, 2026, pushing workflow platforms to strengthen record-keeping, transparency, and control mechanisms around AI-assisted process decisions. Cybersecurity compliance pressure also increased with the NIS2 Directive transposition deadline of October 17, 2024, which raises expectations for incident handling and security-by-design across digital operations, including workflow engines and their connected integrations.
Standards guidance continues to shape control frameworks used by buyers and auditors, especially in North America. NIST released updated guidance for API protection in cloud-native systems on March 13, 2026, and finalized SP 800-18r2 on June 30, 2026, reinforcing supply chain risk management and secure system planning practices that translate into stricter governance for connectors, identity, and automation execution paths. Separately, Cloud Security Alliance research activity around EU AI governance and sovereignty themes points to operational needs for integrated documentation, audit-ready logging, and data-residency controls across multi-cloud workflow deployments.
Value Chain Analysis
The cloud workflow value chain begins with hyperscaler infrastructure and foundational cloud services (compute, storage, networking, identity, and data services) that host workflow runtimes and shape residency and reliability options. Workflow and automation software providers sit on top, covering enterprise suites and specialist platforms that increasingly embed generative AI, policy controls, and observability into design studios and execution engines. Integration providers and iPaaS layers supply connectors and data movement across ERP, CRM, ITSM, and industry systems, while marketplace distribution, including listings and co-sell motions, has become a key route to reach enterprises and mid-market buyers.
Downstream, systems integrators, consultancies, and managed service providers translate platform capability into end-to-end process change, covering governance, migration, and operating models such as Cloud Centers of Excellence and FinOps. Recent partnerships show tighter linkage between infrastructure, automation, and go-to-market: ServiceNow expanded its partnership with Google Cloud in January 2025 to place the Now Platform on Google Cloud Marketplace and extend coverage to distributed cloud deployments, while Boomi signed a multi-year strategic collaboration with AWS in May 2025 to address AI integration, automation, and SAP cloud migration needs. Agentic capabilities are also moving into vertical workflows, as seen in Amagi’s April 2026 launch of agentic media operations on Amagi NOW, which reinforces demand for specialized templates and integration into domain content and operations systems.
Competitive Landscape
Incumbent enterprise-software giants, born in ERP and ITSM, now position workflow as the nervous system of digital operations. They face specialist automation vendors whose pure-play focus yields rapid product cycles. A third axis involves hyperscalers embedding workflow engines into platform offerings, bundling compute credits with automation licenses to drive stickiness.
ServiceNow’s USD 2.85 billion Moveworks buy in March 2025 broadens its generative-AI talent pool and shores up conversational interfaces. UiPath stakes its claim on deep AI integration partnerships, as seen in its Google Cloud alliance that targets healthcare. Appian differentiates through FedRAMP-ready scalability that appeals to defense and civilian agencies. Microsoft and IBM fold orchestration features into broader cloud suites, betting on account depth rather than standalone feature parity.
White-space hotspots include edge-native orchestration, pre-validated sovereign-cloud stacks, and AI agents that self-tune workflows. Vendors invest in marketplaces where partners publish vertical accelerators, cutting delivery time for regulated customers. Pricing models evolve toward consumption-based tiers honored across on-prem, cloud, and edge, easing fears of lock-in. The race now centers on who can ship governance frameworks that let citizen developers innovate safely, solving the skill-gap problem at scale.
Cloud Workflow Industry Leaders
IBM Corporation
SAP SE
Pegasystems Inc.
Microsoft Corporation
Appian Corporation
- *Disclaimer: Major Players sorted in no particular order
Cloud Workflow Market Companies Covered in this Report
- Microsoft Corporation
- SAP SE
- ServiceNow Inc.
- IBM Corporation
- Appian Corporation
- Pegasystems Inc.
- Amazon Web Services Inc.
- Google LLC (AppSheet)
- Oracle Corporation
- Salesforce Inc. (Flow)
- Nintex UK Ltd
- K2 Software Inc.
- Kissflow Inc.
- Ricoh Company Ltd
- Micro Focus International PLC
- Integrify Inc.
- BP Logix Inc.
- UiPath Inc. (Cloud RPA)
- Workato Inc.
- Tray.io Inc.
- Smartsheet Inc.

Market Opportunities and Future Outlook
Enterprise buyers are moving from isolated automation to governed orchestration that can support AI agents, long-running processes, and human-in-the-loop approvals across hybrid and multi-cloud estates. That creates opportunity for vendors that package an end-to-end stack, orchestration, integration, AI agents, and governance, with strong identity controls (SSO/SCIM/RBAC), audit-ready logging, and policy enforcement aligned to compliance-heavy functions such as finance (35.25% revenue share in 2025) and regulated verticals like BFSI (31.75% share in 2025). The regulatory timeline is also generating near-term implementation work: the EU AI Act’s full application effective August 2, 2026, alongside NIS2-driven security posture expectations, increases demand for workflow platforms that can standardize documentation, data handling, and monitoring across automation portfolios.
Platform consolidation and agentic workflow tooling expansion are also showing up in 2026 product and ecosystem signals. Google announced ADK for Go 2.0 in June 2026 with graph-based orchestration and human-in-the-loop features, while Apache Airflow released version 3.3.0 in July 2026 with enhancements aimed at stateful task and asset handling, supporting durable execution patterns that fit enterprise workflow reliability needs. Service-led programs reinforce opportunity in operationalizing automation at scale, including Deloitte and ServiceNow publishing a 2026 workflow automation outlook focused on AI-ready architecture and process transformation, and KPMG reporting in April 2026 that over 80% of TMT companies prioritize optimization and automation of workflows, supporting continued investment in governed, cross-system orchestration rather than point automations.
Recent Industry Developments in Cloud Workflow Market
- July 2026: IBM announced expanded momentum for SAP Cloud ERP Private on IBM Power Virtual Server, highlighting co-engineering around AI-enabled modernization of ERP workloads. The update reinforces hybrid deployment patterns where regulated or performance-sensitive cores run on dedicated infrastructure while workflows integrate cloud-native analytics and automation services.
- April 2026: Pipefy announced a multi-year collaboration with Microsoft to accelerate AI initiatives for business orchestration and to distribute solutions through Microsoft Marketplace. Marketplace-first distribution and tighter Microsoft ecosystem integration add competitive pressure on standalone workflow tools that lack embedded identity, security, and admin controls.
- October 2024: UiPath signed a partnership with SAP to strengthen cross-stack connectors between automation workflows and enterprise ERP systems. Deeper SAP integration lowers friction in finance and back-office automations, supporting larger-scale workflow rollouts where audit trails and data integrity depend on reliable system-to-system orchestration.


Cloud Workflow Market Report Scope and Research Methodology
Market Definition and Coverage
For this methodology, the cloud workflow market covers cloud hosted software and related services that help organizations design, run, and monitor repeatable workflows across business apps and data sources.
Scope exclusions: We exclude on-premise workflow software and fully custom one-off scripts that are built for a single client and not sold as a repeatable offering.
Segments Covered in This Report
- By Business Function
- Operations
- Finance and Accounting
- HR and Talent Management
- Sales and Marketing
- Other Business Functions
- By Deployment Model
- Public Cloud
- Private Cloud
- Hybrid Cloud
- By Organization Size
- Large Enterprises
- Small and Medium Enterprises (SMEs)
- By End-User Vertical
- BFSI
- Telecommunications and IT
- Retail and E-Commerce
- Government
- Healthcare and Life Sciences
- Other End-User Verticals
- By Geography
- North America
- United States
- Canada
- Mexico
- Europe
- Germany
- United Kingdom
- France
- Italy
- Spain
- Rest of Europe
- Asia-Pacific
- China
- Japan
- India
- South Korea
- Australia
- Rest of Asia-Pacific
- South America
- Brazil
- Argentina
- Rest of South America
- Middle East and Africa
- Middle East
- Saudi Arabia
- United Arab Emirates
- Turkey
- Rest of Middle East
- Africa
- South Africa
- Egypt
- Nigeria
- Rest of Africa
- Middle East
- North America
Data Sources, Market Sizing, and Validation
Desk Research
Desk research was used to set the market boundaries and to build the first set of demand and supply indicators that can be checked year over year. We relied on public, non-paywalled sources, including US Bureau of Labor Statistics digital occupation data, US Census Bureau business and ICT indicators, Eurostat digital economy statistics, OECD ICT datasets, and World Bank macro series, to anchor enterprise activity, labor mix, and the direction of IT spending.
To keep the model realistic, we also reviewed company filings and investor presentations for revenue mix cues, product positioning, and pricing hints, then used reputable press coverage and association websites to capture adoption signals and regulatory context. Where needed, we used paid subscriptions focused on company financials and intelligence, news and financials, and patent databases to cross-check product launches, customer focus, and the pace of workflow related innovation. These examples are illustrative rather than exhaustive, and many other sources were also consulted to collect data, validate assumptions, and clarify open questions.
Primary Interviews and Surveys
Primary work was carried out through expert interviews and structured surveys with workflow platform providers, cloud service partners, systems integrators, and enterprise buyers who manage process automation. Because demand and pricing can vary by region and by vertical, we covered perspectives across APAC, EMEA, and the Americas, so assumptions on adoption pace, packaging, and average contract size could be adjusted before finalizing totals.
Distribution of primary research fieldwork respondents
| Company type | Respondent position | Region |
|---|---|---|
| Top tier: 26% | CXOs: 17% | APAC: 41% |
| Mid tier: 54% | Functional/Unit leaders: 25% | EMEA: 35% |
| Smaller Players: 20% | Managers: 58% | Americas: 24% |
Market-Sizing & Forecasting
Sizing started with a top-down build in which enterprise cloud application penetration and workflow tooling attach rates were used to reconstruct the addressable spend pool. We then distributed that pool by region using IT spending and digital adoption indicators.
To keep the totals grounded, we corroborated results with selective bottom-up checks, such as sampled provider revenue ranges, channel feedback on typical subscription bundles, and an ASP times active user or seat approximation where volumes could be responsibly inferred.
Inputs that mattered most included the mix of subscription versus usage-based pricing, adoption of low-code workflow builders, the pace of cloud migration in target industries, average workflow users per deployed account, and the share of deployments that require ongoing support services. Where bottom-up signals were patchy (for example, private firms with limited disclosures), gaps were handled using peer grouping and range-based assumptions that were pressure-tested during interviews. For forecasting, we used scenario analysis, where growth paths were adjusted using expectations shared by practitioners on cloud budget trends, automation priorities, and the rate of replacing legacy on-prem workflows.
Data Validation & Update Cycle
Outputs were checked through triangulation across independent signals, including vendor commentary, cloud adoption indicators, and regional enterprise spending direction, and then variances were reviewed before sign-off. When a number looked unusual, we re-checked unit assumptions like pricing progression, user counts, or the split between platform fees and services, and then followed up with select respondents if the change could not be explained.
Reports are refreshed annually, and interim updates are made when material events occur, such as a major pricing shift or a clear demand slowdown. Before delivery, a final analyst pass is completed so clients receive the most current view available at that time.
Mordor Intelligence's Cloud Workflow Market Sizing Compared With Other Published Estimates
Published market sizes for cloud workflow can look far apart because researchers often define the product scope differently, and they also vary in how they treat services, licensing types, and hybrid deployments. Differences in base year selection, currency conversion timing, and whether the estimate is built from usage adoption signals or from vendor revenue claims can also shift the final number.
The main gap comes from whether broader workflow automation suites and some on-premise plus cloud mixes are counted inside the same total, where Mordor Intelligence counts only cloud-hosted workflow platforms and closely allied support services that are sold as repeatable offerings. Another driver is how pricing is projected, since some estimates use straight-line growth on software spend instead of adjusting for shifts in subscription packaging and usage-based billing.
Benchmark comparison
| Source | Market Size | Gaps in Research Methodology |
|---|---|---|
| Mordor Intelligence | USD 7.53 B (2026) | |
| Industry Publisher A | USD 11.20 B (2024) | Uses a broader label of cloud workflow automation, which can fold in adjacent automation tools beyond workflow management, and it is not always clear how services and hybrid setups are treated. |
| Market Tracker B | USD 2.90 B (2024) | Leans toward a narrower vendor set and may exclude implementation and ongoing support revenue, which tends to understate the value captured when platforms are deployed at scale. |
The comparison points to scope and revenue capture as the main reasons the numbers spread, followed by different ways of handling pricing progression over the forecast period. By tying totals to observable adoption signals and repeatable unit assumptions, we keep a figure that can be revisited and updated using the same steps over time.


Key Questions Answered in the Report
What is the current size of the cloud workflow market?
The cloud workflow market is valued at USD 7.53 billion in 2026, growing toward USD 15.68 billion by 2031 at a 15.82% CAGR.
Which business function holds the largest adoption share?
Finance and Accounting leads with 35.25% share owing to stringent compliance and audit needs.
Why are hybrid deployments gaining traction?
Hybrid models balance data-sovereignty, latency, and cost considerations while avoiding vendor lock-in, driving a 17.02% CAGR through 2031.
How are SMEs influencing the cloud workflow market?
Low-code platforms remove technical barriers, allowing SMEs to adopt automation quickly and fuel an 17.45% CAGR in their segment.
Which region is expanding fastest?
Asia-Pacific shows the highest growth at 16.68% CAGR, supported by sovereign-cloud policies and government-led digitization programs.
What role does AI play in modern workflows?
Generative AI adds predictive insights and conversational build tools, cutting cycle times and boosting ROI, as seen in UiPath’s 50% reduction in healthcare authorization processing.
Page last updated on:





