Automation Testing Market Size and Share
Market Overview
| Study Period | 2020 - 2031 |
|---|---|
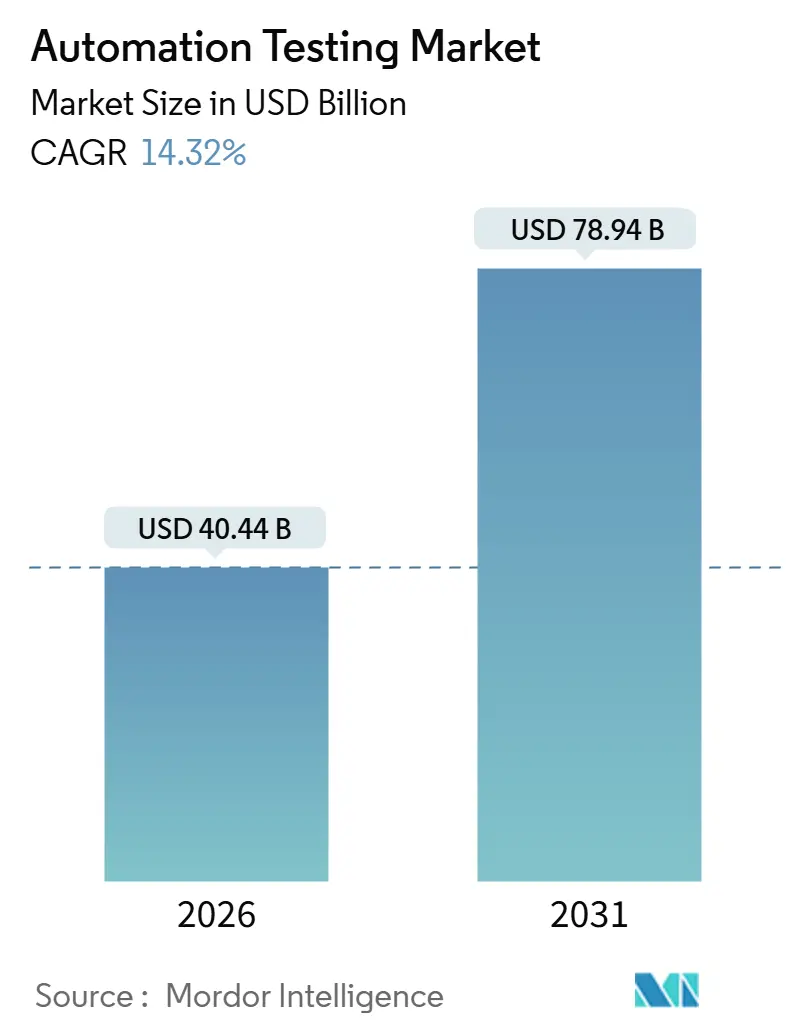
| Market Size (2026) | USD 40.44 Billion |
| Market Size (2031) | USD 78.94 Billion |
| Growth Rate (2026 - 2031) | 14.32% CAGR |
| Fastest Growing Market | Asia Pacific |
| Largest Market | North America |
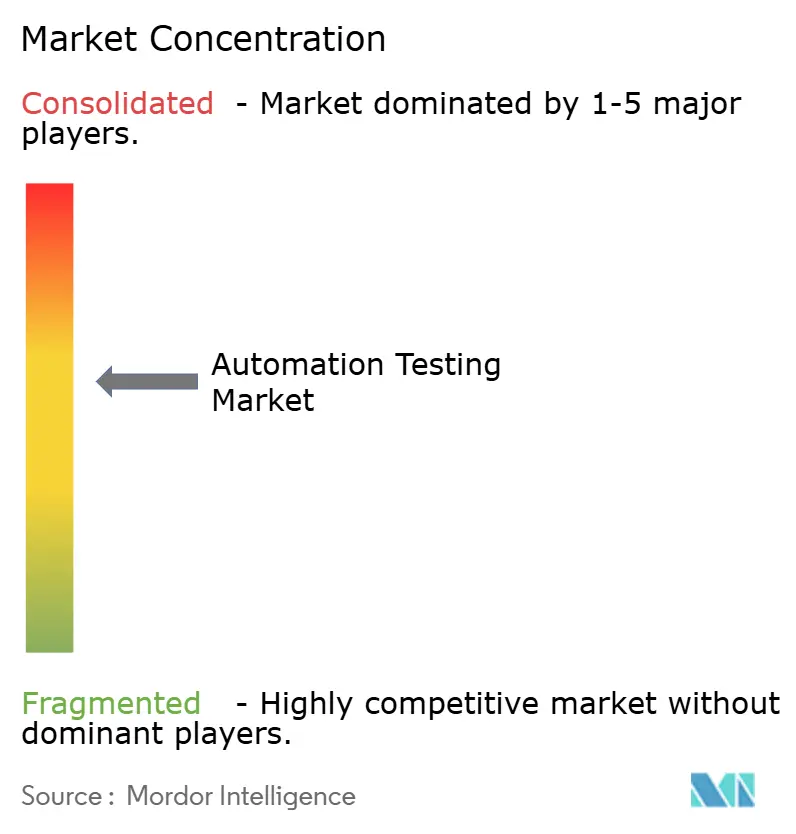
| Market Concentration | Medium |
Major Players *Disclaimer: Major Players sorted in no particular order Image © Mordor Intelligence. Reuse requires attribution under CC BY 4.0. | |
Automation Testing Market Analysis by Mordor Intelligence
The automation testing market size reached USD 40.44 billion in 2026 and is projected to attain USD 78.94 billion by 2031, reflecting a 14.32% CAGR across the forecast period. This expansion stems from enterprises shifting testing earlier in the software development life cycle, unifying continuous testing with DevOps pipelines, and embracing generative AI tooling that creates self-healing scripts in near real-time. Widespread demand for elastic cloud infrastructure, heightened security and accessibility mandates, and rising uptake of no-code platforms are broadening purchasing pools beyond traditional quality-assurance teams. Competitive dynamics are intensifying as incumbents embed AI into existing suites, while venture-backed specialists differentiate themselves through autonomous test-maintenance engines, all vying for a share as organizations modernize their legacy estates and migrate to microservices. Opportunities flourish where hybrid-cloud sovereignty, regulated-industry compliance, and device-level firmware validation intersect, prompting vendors to expand service portfolios alongside software licenses to reduce customer complexity and accelerate time-to-value.
Key Report Takeaways
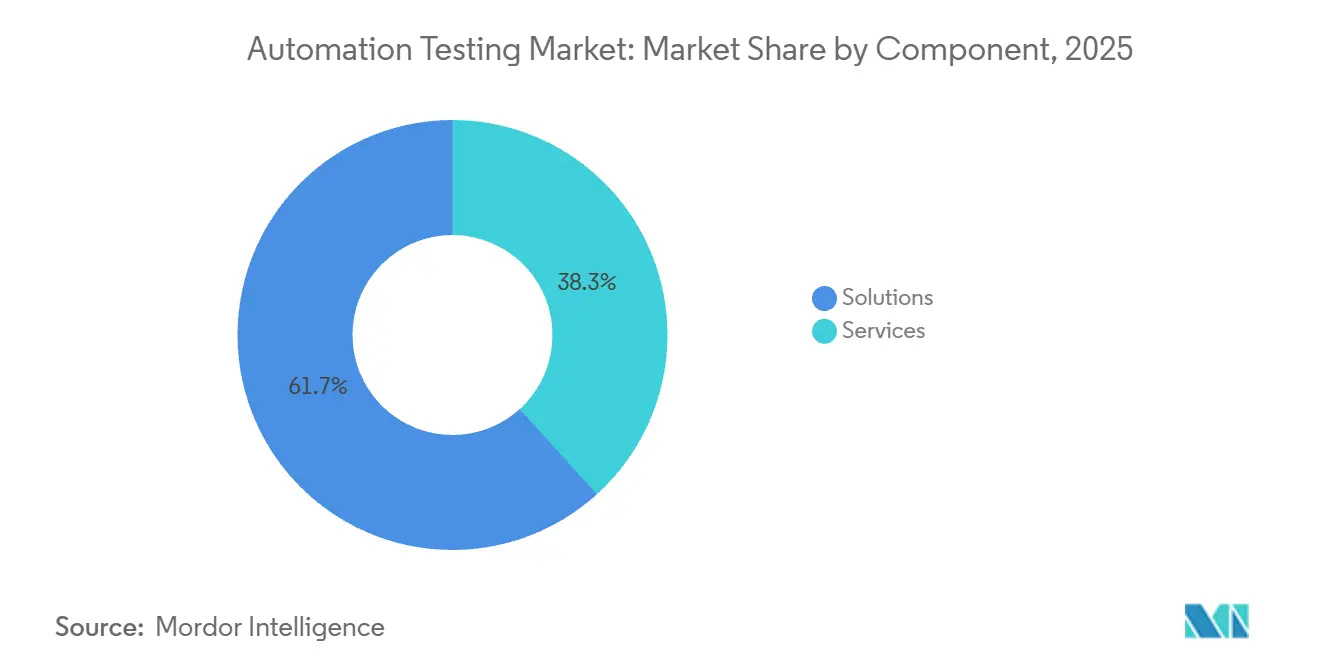
- By component, solutions led with 61.72% revenue share in 2025; services are forecast to grow at a 15.23% CAGR through 2031.
- By testing type, functional testing accounted for 58.33% of demand in 2025, while non-functional testing is projected to expand at a 16.94% CAGR through 2031.
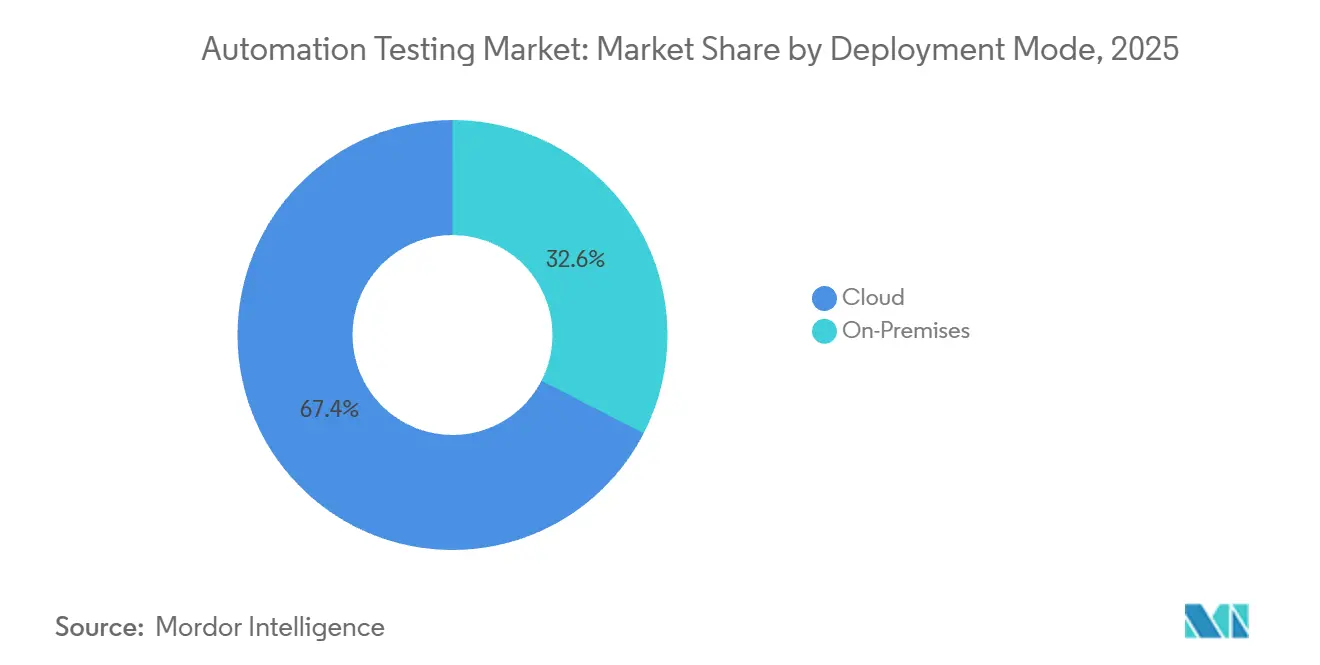
- By deployment mode, cloud deployment captured a 67.44% share in 2025, whereas the hybrid cloud is set to rise at a 17.41% CAGR through 2031.
- By end-user industry, information technology and telecommunications led with 24.61% spending in 2025; healthcare and life sciences is expected to grow at a 16.67% CAGR through 2031.
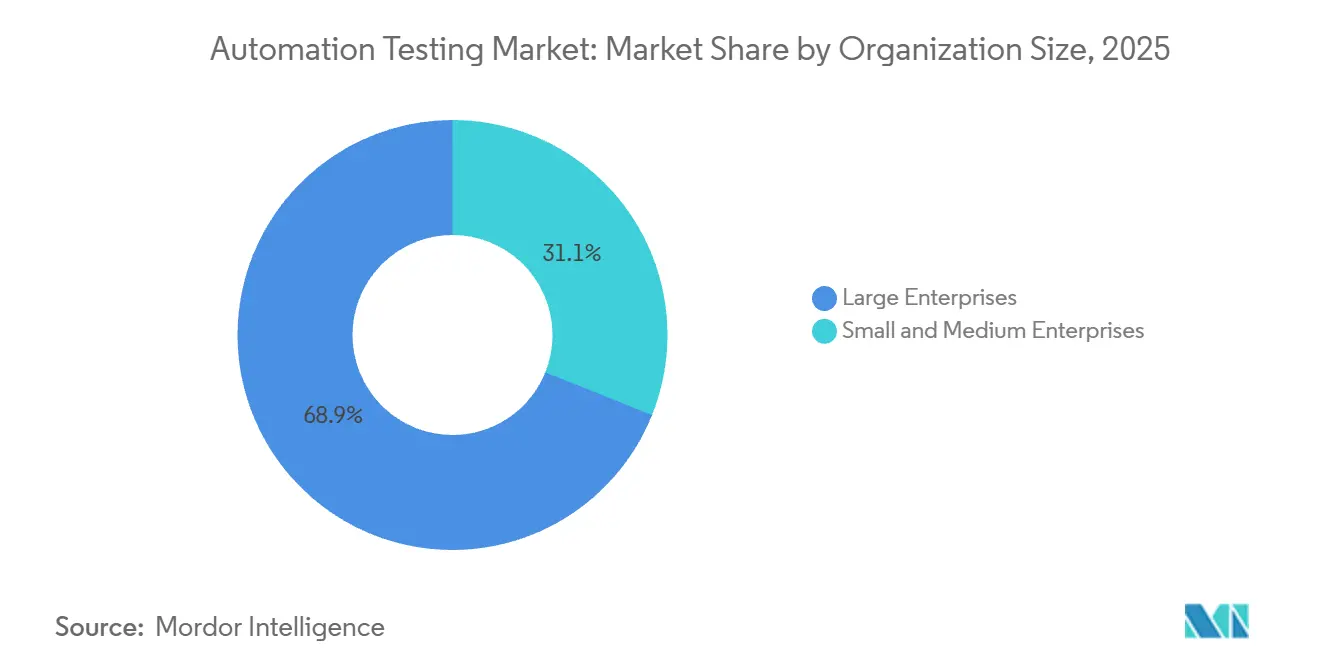
- By organization size, large enterprises held 68.93% share in 2025, but small and medium enterprises are advancing at a 17.34% CAGR to 2031.
- By interface, web testing constituted 52.21% of activity in 2025; API and microservices testing is forecast to expand at a 16.81% CAGR to 2031.
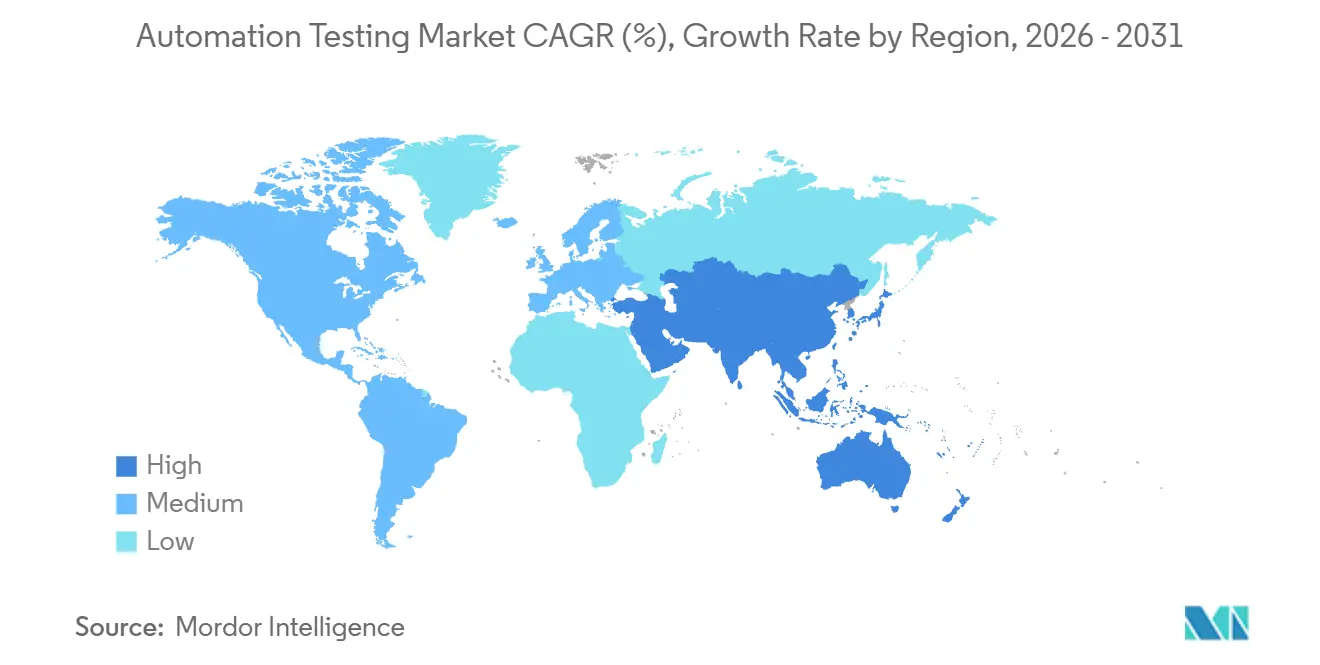
- By geography, North America led with 39.54% revenue share in 2025; Asia-Pacific is expected to post the fastest regional CAGR of 16.13% through 2031.
Note: Market size and forecast figures in this report are generated using Mordor Intelligence’s proprietary estimation framework, updated with the latest available data and insights as of January 2026.
Market Trends and Insights
Drivers Impact Analysis of Automation Testing Market*
| Driver | (~) % Impact on CAGR Forecast | Geographic Relevance | Impact Timeline |
|---|---|---|---|
| Rising Adoption of Agile and DevOps for Continuous Testing | +2.1% | Global, concentrated in North America and Europe | Medium term (2-4 years) |
| AI-Driven Test-Creation and Maintenance Tools | +1.8% | North America, Europe, Asia Pacific core markets | Short term (≤ 2 years) |
| Expansion of Cloud-Native and Microservices Architectures | +1.5% | Global, led by North America and Asia Pacific | Medium term (2-4 years) |
| Low-Code or No-Code Automation Democratizing QA | +1.3% | Global, rapid uptake in Asia Pacific and Latin America | Short term (≤ 2 years) |
| Digital-Accessibility Mandates (WCAG 3) | +0.9% | North America, Europe, Australia | Long term (≥ 4 years) |
| On-Device Regression Needs for Edge and IoT Firmware | +0.7% | Asia Pacific manufacturing hubs, North America, Europe | Long term (≥ 4 years) |
| Source: Mordor Intelligence | |||
Rising Adoption of Agile and DevOps for Continuous Testing
Organizations embed automated regression suites directly into continuous-integration pipelines, compressing release cycles from quarterly to weekly cadences. Microsoft reported a 43% year-over-year rise in parallel test jobs on Azure DevOps in 2025, indicating a shift from manual approvals toward policy-as-code gating.[1] “Azure DevOps Blog,” Microsoft Corporation, microsoft.com Higher delivery velocity narrows windows for exploratory testing, pushing teams to automate smoke, integration, and end-to-end scenarios once reserved for human judgment. Docker’s 2024 survey noted that 68% of DevOps practitioners run automated tests on every commit, up from 51% a year earlier. As a result, test platforms integrate natively with Git repositories and observability stacks, surfacing defect telemetry in real time and creating demand for unified DevOps toolchains.
AI-Driven Test-Creation and Maintenance Tools
Generative AI turns natural-language requirements into executable scripts and self-heals selectors when UI elements change, trimming maintenance costs that historically consumed up to 40% of QA budgets. IBM’s watsonx Code Assistant converts COBOL business logic into test cases for mainframe workloads. Tricentis folded natural-language authoring into its platform via the Waldo and Virtuoso acquisitions, enabling testers to describe scenarios in plain English and receive Selenium scripts in minutes. Applitools Visual AI flags pixel-level regressions and reduced false-positive alerts by 60% during pilot projects. These advances allow enterprises to expand coverage without proportional head-count growth, shifting QA engineers toward risk-based prioritization.
Expansion of Cloud-Native and Micro-Services Architectures
Decomposing monoliths into microservices multiplies API contracts and inter-service dependencies. Google Cloud’s 2025 DevOps report found teams operating more than 50 microservices see a 3.2-times higher defect-escape rate when relying solely on end-to-end tests. Tools such as Pact enable consumer-driven contract verification, while BrowserStack’s Kubernetes-native orchestration spins up ephemeral browsers alongside application pods, cutting infrastructure costs by 40%. Sauce Labs’ integration with Azure Kubernetes Service permitted 10,000 concurrent Selenium sessions and slashed regression runtime from eight hours to 22 minutes. Test platforms therefore must support API-first workflows and ephemeral environments.
Low-Code or No-Code Automation Democratizing QA
Visual builders and record-and-playback interfaces let business analysts author tests without scripting. Katalon’s StudioAssist suggests test steps as users interact with apps, halving script-creation time. LambdaTest HyperExecute auto-retries flaky tests and distributes jobs across cloud nodes, achieving 95% pass-rate stability for fintech clients. Rainforest QA expands crowd-testing with Spanish and Portuguese localization, attracting Latin American SMEs. Democratization removes engineering bandwidth as a gating factor, speeding validation immediately after backlog refinement sessions.
Restraints Impact Analysis of Automation Testing Market*
| Restraint | (~) % Impact on CAGR Forecast | Geographic Relevance | Impact Timeline |
|---|---|---|---|
| High Up-Front Tool and Skills Investment | -1.2% | Global, acute in emerging markets and SMEs | Short term (≤ 2 years) |
| Legacy-System Integration Complexity | -0.9% | North America and Europe, especially BFSI and manufacturing | Medium term (2-4 years) |
| Data-Privacy Hurdles for Cloud-Based Testing | -0.6% | Europe (GDPR), China (PIPL), healthcare and finance | Long term (≥ 4 years) |
| Rapid AI-Framework Obsolescence Risk | -0.5% | Global, concentrated in early-adopter enterprises | Short term (≤ 2 years) |
| Source: Mordor Intelligence | |||
High Up-Front Tool and Skills Investment
Enterprise-grade frameworks require license fees, infrastructure provisioning, and staff upskilling, forming a capital barrier for SMEs. PwC’s 2025 survey indicated 42% of smaller firms cite budget constraints as the chief obstacle to automated security testing. The talent gap compounds the hurdle, with LinkedIn’s 2024 report showing demand for automation engineers outstripping supply by a factor of 2.3 in North America. Firms unable to fund competitive salaries or long-term subscriptions delay automation programs, perpetuating manual bottlenecks that slow releases and raise defect-escape rates.
Legacy-System Integration Complexity
Modern test suites struggle to connect with COBOL mainframes and proprietary middleware, lacking standard APIs. IBM’s 2024 Mainframe Modernization Survey revealed 63% of financial institutions still run COBOL cores, with only 18% possessing automated regression suites.[2]“watsonx Code Assistant,” IBM Corporation, ibm.com Manufacturing clients spend up to 40% of test budgets maintaining integration layers between Selenium scripts and SAP GUI transactions, stretching update cycles to six weeks. Organizations therefore operate parallel manual and automated processes, diluting return on investment and fostering resistance to further automation.
*Our forecasts treat driver/restraint impacts as directional, not additive. The impact forecasts reflect baseline growth, mix effects, and variable interactions.
Automation Testing Market Segment Analysis
By Component:
Services Expand as Complexity RisesSolutions accounted for a 61.72% automation testing market share in 2025, reflecting enterprises' reliance on packaged functional, performance, and security modules that plug directly into DevOps pipelines. Services, however, are projected to capture the fastest-growth lane with a 15.23% CAGR through 2031 as buyers outsource script maintenance and hybrid-cloud integration to specialists, shifting quality assurance from fixed headcount to on-demand expertise. Managed providers update regression packs in lockstep with continuous-delivery sprints, shrinking lead times and freeing internal teams to focus on risk prioritization.
The automation testing market size tied to services is growing as regulatory audits demand traceability matrices, driving demand for consulting hours that map test cases to compliance clauses under the GDPR and ISO 13485.[3]“European Accessibility Act,” European Commission, ec.europa.eu Vendors bundle advisory, framework tuning, and managed execution into outcome-based contracts, converting what once were capital purchases into operating expenses that scale with release velocity.


By Testing Type:
Non-Functional Gains MomentumFunctional suites retained a 58.33% market share in automation testing in 2025, confirming their foundational role in validating user workflows. Non-functional categories, performance, security, and accessibility are set to expand at a 16.94% CAGR, the fastest clip in this segmentation, as zero-trust architectures and WCAG 3 mandates elevate latency, vulnerability, and usability metrics to board-level risk registers.
Organizations integrate Apache JMeter load scripts and static-analysis scans into the same dashboards that track functional coverage, correlating service-level objectives with defect trends. As breaches and slow page loads inflict brand damage that exceeds functional defects, procurement teams allocate larger budgets to non-functional tooling, shifting the automation testing market size toward balanced spending across the two categories.
By Deployment Mode:
Hybrid Cloud Balances Agility and SovereigntyPublic cloud captured a commanding 67.44% share of deployments in 2025, powering elastic browser grids and device farms that execute thousands of parallel tests. Hybrid cloud, nevertheless, records the fastest trajectory with a 17.41% CAGR, as financial, healthcare, and public-sector buyers route sensitive workloads to on-premises nodes while dispatching low-risk checks to public regions.
BrowserStack’s Azure integration synchronizes results between private Jenkins servers and cloud Selenium grids, reducing infrastructure costs by 35% and demonstrating the economic benefits of federated orchestration. The dual-location model future-proofs compliance with emerging data-residency rules, ensuring the automation testing market size reflects a steady shift toward mixed deployment topologies.
By End-User Industry:
Healthcare and Life Sciences AccelerateInformation technology and telecommunications led spending with a 24.61% automation testing market share in 2025, driven by telcos validating 5G network slices and API gateways. Healthcare and life sciences, however, are forecast to outpace all other verticals at a 16.67% CAGR, as FDA 21 CFR Part 11 and ISO 13485 compel the automated validation of electronic health record interfaces and medical device firmware.
Telemedicine providers embed continuous performance tests to maintain video quality during peak appointment windows, while hospitals implement accessibility scans to ensure patient portals meet WCAG standards. The resulting compliance pressure and interoperability complexity drive new investment into automated suites, increasing the automation testing market size allocated to healthcare projects above historical norms.
By Organization Size:
SMEs Narrow the GapLarge enterprises commanded 68.93% automation testing market share in 2025, leveraging enterprise licenses and in-house device labs to sustain broad coverage. Small and medium-sized enterprises represent the fastest-growing cohort, with a 17.34% CAGR, as no-code builders and pay-as-you-go SaaS solutions strip away entry barriers.
LambdaTest HyperExecute auto-retries flaky tests and distributes jobs across cloud nodes, letting resource-constrained teams deliver stable releases without dedicated QA engineers. Crowd-testing models supplement automated suites, providing real-user feedback in regional languages. These dynamics broaden the automation testing market size by extending adoption into the long tail of businesses previously priced out of enterprise toolchains.
By Interface:
API and Microservices Validation SurgesWeb UI checks still dominate the automation testing market with a 52.21% share in 2025, yet API and microservices suites are projected to grow the fastest at a 16.81% CAGR as enterprises decompose monoliths and enforce contract integrity on every commit.
Postman and Pact snapshots catch schema drift early, preventing downstream breakages, while Kubernetes-native grids spin up ephemeral browsers alongside service pods to validate end-to-end flows without persistent infrastructure. Device-farm demand persists for mobile and IoT, but unified orchestration that sequences API, UI, and embedded tests within one workflow distinguishes leading platforms, ensuring the automation testing market size increasingly reflects multi-interface complexity.
Geography Analysis
North America Automation Testing Market
North America contributed 39.54% of the 2025 revenue, supported by mature DevOps adoption, federal accessibility mandates, and venture funding that accelerates the rollouts of AI-native platforms. United States enterprises integrate GitHub Copilot and IBM watsonx into pipelines, auto-generating unit and integration tests on every commit. Canadian banks automate regression checks to satisfy regulatory resilience guidelines, while Mexican manufacturers embed testing into supply-chain portals that exchange customs data with U.S. authorities.
APAC Automation Testing Market
Asia Pacific is projected to record the fastest expansion at a 16.13% CAGR through 2031. India’s Digital Public Infrastructure programs demand validation of Aadhaar and UPI APIs at a national scale. China enforces PIPL data-sovereignty rules, prompting hybrid-cloud grids located within national borders. Japanese industrial conglomerates partner with HeadSpin device labs to vet automotive firmware across climate zones, and Australian agencies require WCAG-aligned testing for citizen portals, driving adoption of accessibility tools from Deque Systems and Applitools.
EMEA and LATAM Automation Testing Market
Europe maintains robust demand as the European Accessibility Act and GDPR converge, necessitating automated validation and data anonymization. German automakers test ADAS software under edge-latency scenarios, the United Kingdom’s financial sector hires managed-service providers to automate disaster-recovery test runs, and French healthcare groups validate HL7 FHIR data exchanges under national digital-health initiatives. Middle East and Africa investment concentrates in smart-city and fintech platforms, while Latin American growth benefits from localization features in no-code tools that broaden SME participation.

Competitive Landscape
The top 10 vendors account for approximately half of the global revenue, resulting in a moderate concentration in the automation testing market. Incumbents such as IBM, Microsoft, and OpenText leverage cross-portfolio bundling to establish a foothold within large accounts, embedding AI assistants into established ALM footprints. Tricentis, mabl, and Applitools pursue a shared approach via autonomous maintenance engines that cut script-update cycles by up to 70%. Acquisition activity accelerates as vendors fill capability gaps. Tricentis added Waldo and Virtuoso for mobile and no-code authoring, while SmartBear acquired Stoplight to expand its API design coverage.
Cloud providers partner with orchestration specialists to reduce infrastructure friction. BrowserStack integrates live and automated testing into Visual Studio Code, and Sauce Labs debuts Kubernetes-native scheduling that slashes runtime for high-parallel pipelines. Device-farm specialists HeadSpin and Perfecto differentiate themselves with real hardware for over-the-air testing, targeting edge- and IoT use cases that are underserved by generic browser grids. Patent filings highlight a strategic focus on model-based generation and visual AI algorithms, with Tricentis and Applitools leading, respectively.
Compliance certifications emerge as competitive levers, especially ISO/IEC 29119 conformity and traceability mapping for regulated verticals. Vendors also embed observability hooks, correlating test failures with APM metrics from Datadog or New Relic to accelerate incident triage. As AI models mature, rapid obsolescence risk spurs roadmaps emphasizing model-agnostic frameworks and pluggable LLM back ends, insulating customers from technology churn.
Automation Testing Industry Leaders
IBM Corporation
OpenText Corporation (Micro Focus)
Capgemini SE
Tricentis USA Corp
SmartBear Software Inc.
- *Disclaimer: Major Players sorted in no particular order
Automation Testing Market Companies Covered in this Report
- IBM Corporation
- OpenText Corporation (Micro Focus)
- Capgemini SE
- Tricentis USA Corp
- SmartBear Software Inc.
- Parasoft Corporation
- Cigniti Technologies Ltd.
- Keysight Technologies Inc.
- Sauce Labs Inc.
- Accenture plc
- Microsoft Corporation
- Katalon Inc.
- BrowserStack Inc.
- LambdaTest Inc.
- Leapwork A/S
- Applitools Ltd.
- Ranorex GmbH
- Worksoft Inc.
- Perfecto (Perforce Software Inc.)
- Functionize Inc.
- Testim.io Ltd.
- Virtuoso QA Ltd.
- Eggplant (Keysight)
- mabl Inc.
- HeadSpin Inc.

Recent Industry Developments in Automation Testing Market
- December 2025: Perfecto by Perforce expanded its device lab with 300 IoT endpoints, adding smart-home and industrial sensors to support over-the-air firmware-testing requirements for edge deployments.
- October 2025: Tricentis completed its acquisition of Virtuoso QA, integrating natural-language test authoring into the Tricentis Continuous Testing Platform and broadening reach to business analysts.
- September 2025: BrowserStack partnered with Microsoft to embed BrowserStack Live and Automate inside Visual Studio Code, enabling cross-browser tests directly from developers’ IDE.
- August 2025: LambdaTest raised USD 45 million in Series C funding led by Premji Invest, earmarking capital to extend HyperExecute into Europe and Latin America for SME clients.


Automation Testing Market Report Scope and Research Methodology
Market Definition and Coverage
Our study defines the automation testing market as the annual revenue generated by commercial off-the-shelf software tools and allied professional or managed services that automatically design, execute, and analyze functional as well as non-functional test cases across web, mobile, desktop, API, and embedded interfaces. The valuation captures licenses, subscriptions, support fees, and service billings accrued throughout the software development life cycle by vendors and service providers selling to enterprises of every size.
Scope exclusion: spend on purely manual testing engagements or proprietary frameworks used only for in-house cost recovery is kept outside the boundary.
Segments Covered in This Report
- By Component
- Solutions
- Functional Testing
- API Testing
- Security Testing
- Compliance Testing
- Usability Testing
- Load and Performance Testing
- Other Solutions
- Services
- Professional Services
- Managed Services
- Solutions
- By Testing Type
- Functional
- Non-Functional
- Performance
- Security
- Usability
- By Deployment Mode
- On-Premises
- Cloud
- Public
- Private
- Hybrid
- By End-User Industry
- IT and Telecommunications
- BFSI
- Healthcare and Life Sciences
- Retail and E-Commerce
- Transportation and Logistics
- Manufacturing
- Government and Public Sector
- Energy and Utilities
- Other End-User Industries
- By Organization Size
- Large Enterprises
- Small and Medium Enterprises
- By Interface
- Web
- Mobile
- Desktop
- API / Micro-Services
- IoT / Embedded
- By Geography
- North America
- United States
- Canada
- Mexico
- South America
- Brazil
- Argentina
- Rest of South America
- Europe
- Germany
- United Kingdom
- France
- Italy
- Spain
- Russia
- Rest of Europe
- Asia Pacific
- China
- Japan
- South Korea
- India
- Australia
- New Zealand
- Rest of Asia Pacific
- Middle East
- United Arab Emirates
- Saudi Arabia
- Turkey
- Rest of Middle East
- Africa
- South Africa
- Nigeria
- Kenya
- Rest of Africa
- North America
Data Sources, Market Sizing, and Validation
Primary Research
Interviews with tool vendors, QA service providers, DevOps leads, and software architects across North America, Europe, Asia-Pacific, and the Middle East validate adoption metrics, price realization bands, and pain points around test coverage. Structured surveys with BFSI, healthcare, and retail technology heads add demand-side granularity and confirm the pace at which manual suites are being displaced.
Desk Research
Mordor analysts begin with public datasets that signal software delivery intensity and test demand, such as OECD ICT investment tables, U.S. Bureau of Labor Statistics developer employment trends, and national broadband penetration records that proxy digital service proliferation. Industry associations like the Cloud Native Computing Foundation, ETSA, and the World Quality Report supplement these with adoption ratios for Agile, DevOps, and CI/CD practices. Company 10-Ks, investor decks, and product catalogs expose pricing tiers and contract sizes, while patent libraries parsed through Questel reveal shifts toward AI-enabled self-healing frameworks. Paid databases, including D&B Hoovers for vendor financials and Dow Jones Factiva for deal flow, round out the desk work.
These sources let us benchmark tool shipments, service day rates, and regional digitalization baselines before any modeling; the list above is illustrative, and many other repositories are referenced to cross-check values, fill gaps, and sharpen assumptions.
Market-Sizing & Forecasting
A top-down build starts by reconstructing the potential spend pool from enterprise software outlays and developer workforce counts, which are mapped to test automation penetration rates discussed during primary calls. Select bottom-up roll-ups, sampled license shipments, channel checks, and average selling price ranges stress test the totals before reconciliation. Key variables tracked include CI/CD pipeline density, average number of releases per app, cloud migration ratio, AI-driven feature additions, and typical service hours per project. Multivariate regression against these drivers underpins the 2025-2030 forecast; scenario analysis adjusts for macro spending swings and currency shifts when needed.
Data Validation & Update Cycle
Outputs undergo variance checks against independent spend trackers, quarterly vendor earnings, and regional ICT indicators. Findings move through senior analyst review, after which we re-contact high-impact sources if anomalies persist. Models refresh every twelve months, with interim updates triggered by major M&A, pricing pivots, or regulation that materially alters demand.
How Mordor Intelligence's Automation Testing Market Size Compares to Other Published Estimates
Published estimates often differ because each firm chooses unique market boundaries, price stacks, and refresh cadences. Our disciplined scope, dual-path modeling, and annual recalibration minimize those variances and give clients a figure they can trace back to verifiable drivers.
Key gap drivers include: some publishers fold manual testing or broader quality assurance services into totals; others apply flat price escalators without sampling live contracts; a few project growth on historical CAGR norms rather than pipeline density and release frequency. Mordor reports the base case, aligns currencies to calendar year averages, and updates variables every cycle.
Benchmark comparison
| Market Size | Anonymized source | Primary gap driver |
|---|---|---|
| USD 35.29 B (2025) | Mordor Intelligence | - |
| USD 20.60 B (2025) | Global Consultancy A | Excludes managed services and uses conservative DevOps penetration assumptions |
| USD 41.67 B (2025) | Trade Journal B | Blends manual testing revenues and applies aggressive price inflation across tool tiers |
The comparison shows that when scope creep or overly narrow definitions are stripped away, Mordor's balanced approach delivers a reliable, transparent baseline that decision makers can reproduce with clear variables and repeatable steps.


Key Questions Answered in the Report
What is the projected value of the automation testing market in 2031?
It is expected to reach USD 78.94 billion, supported by a 14.32% CAGR over the forecast period.
Which segment shows the fastest growth within automation testing?
Hybrid-cloud deployment is forecast to expand at a 17.41% CAGR as organizations balance agility with data sovereignty.
Why is non-functional testing gaining momentum?
Heightened security, performance, and accessibility mandates push enterprises to automate non-functional checks, driving a projected 16.94% CAGR for the segment.
How are SMEs adopting automation testing tools?
No-code platforms and pay-as-you-go SaaS models lower entry barriers, enabling SMEs to automate critical workflows without dedicated QA teams.
Which regions will lead future market expansion?
Asia Pacific is projected to record the highest growth, driven by digital-public-infrastructure mandates in India and data-residency regulations in China.
What role does generative AI play in automation testing?
Generative AI auto-creates and self-heals test scripts, reducing maintenance overhead and allowing teams to expand coverage without increasing head-count.
Page last updated on:


