Professional Services Automation Market Size and Share
Market Overview
| Study Period | 2020 - 2031 |
|---|---|
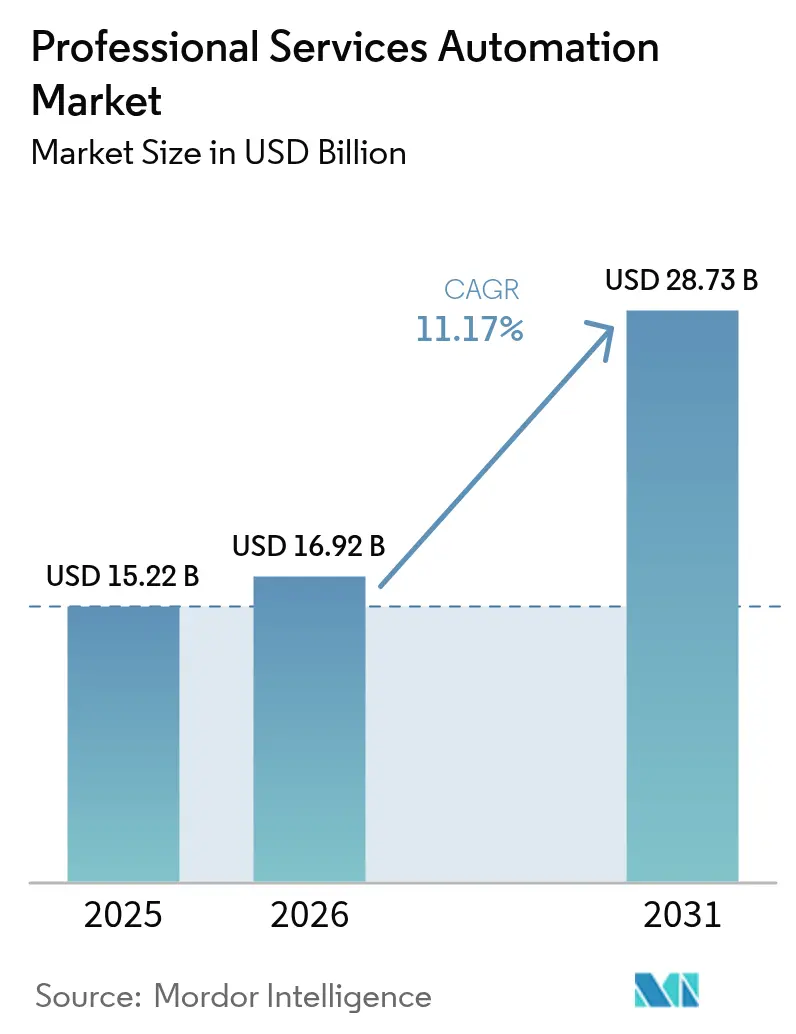
| Market Size (2026) | USD 16.92 Billion |
| Market Size (2031) | USD 28.73 Billion |
| Growth Rate (2026 - 2031) | 11.17% CAGR |
| Fastest Growing Market | Asia Pacific |
| Largest Market | North America |
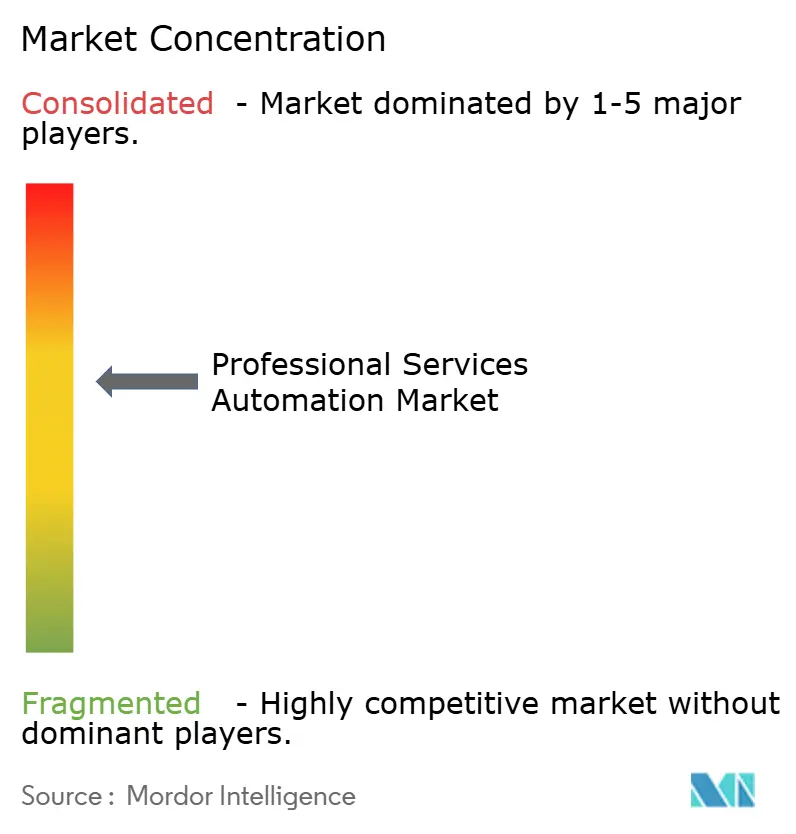
| Market Concentration | Medium |
Major Players *Disclaimer: Major Players sorted in no particular order Image © Mordor Intelligence. Reuse requires attribution under CC BY 4.0. | |
Professional Services Automation Market Analysis by Mordor Intelligence
The Professional Services Automation market size is expected to grow from USD 15.22 billion in 2025 to USD 16.92 billion in 2026 and is forecast to reach USD 28.73 billion by 2031 at 11.17% CAGR over 2026-2031. Cloud-first transformation, AI-driven workflow orchestration, and the need for unified project-to-cash visibility anchor this expansion. Firms race to embed predictive analytics that guide staffing, margin management, and client outcomes, while outcome-based billing models spur richer performance measurement capabilities. A 69.3% cloud deployment footprint in 2024 proves that scalable, subscription-based delivery now underpins most new implementations, and AI modules that surface utilization risks before month-end close accelerate decision cycles. As talent shortages persist, vendors differentiate through low-code configuration, embedded best-practice templates, and tight ERP/CRM connectors that de-risk complex rollouts. Competitive advantage hinges on platform breadth: suites that combine project management, resourcing, billing, and analytics in one workspace capture larger seat counts and drive expansion revenue.
Key Report Takeaways
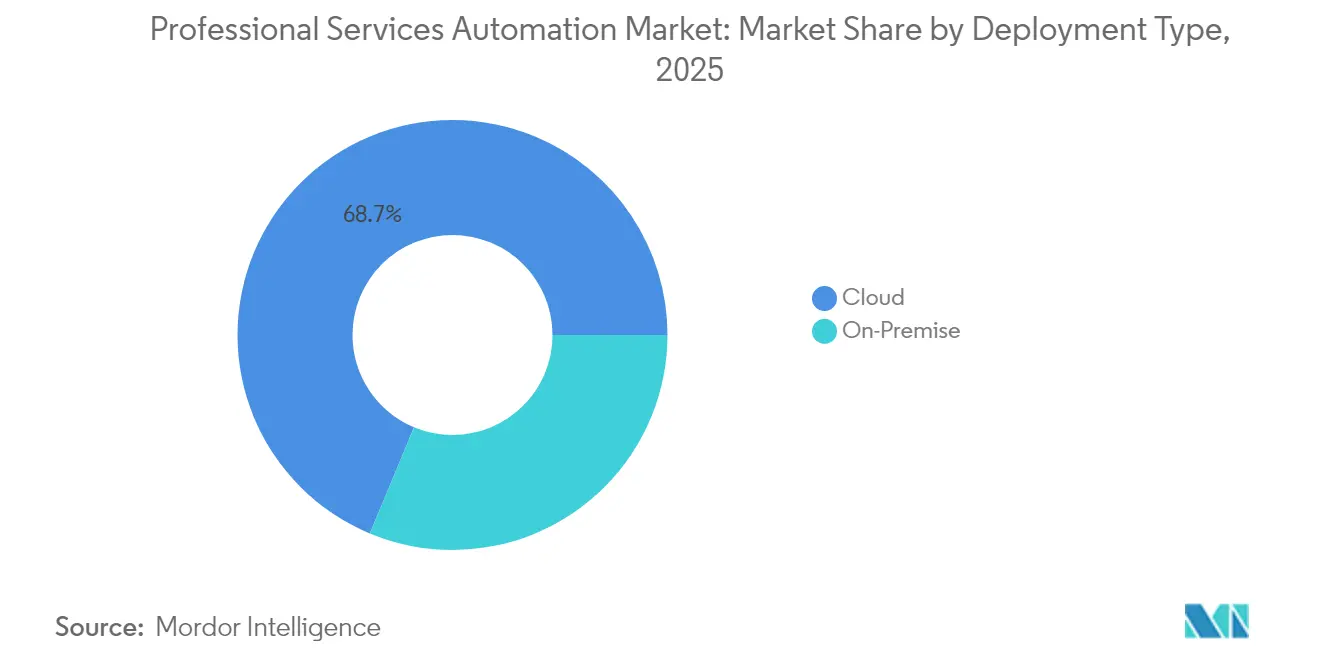
- By deployment type, cloud commanded 68.72% revenue share in 2025 and is projected to grow at a 12.88% CAGR through 2031.
- By component, solutions accounted for 61.12% of 2025 revenue, while the services segment is forecast to expand at a 13.35% CAGR to 2031.
- By enterprise size, large enterprises contributed 59.25% of 2025 revenue, whereas SMEs are set to grow at a 14.95% CAGR through 2031.
- By functionality module, project and resource management led with 34.28% share in 2025; business analytics and reporting is advancing fastest at a 15.21% CAGR to 2031.
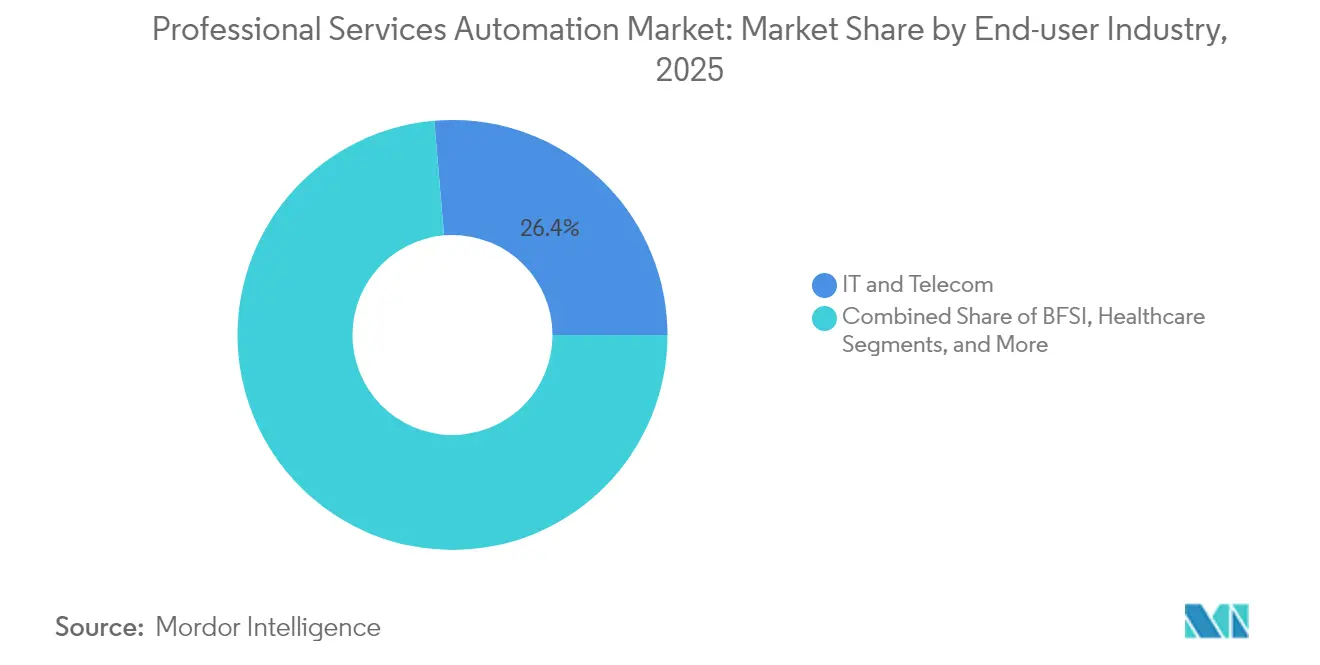
- By end-user industry, IT and telecom held 26.35% of 2025 revenue, while consulting and advisory is projected to post the highest 13.74% CAGR through 2031.
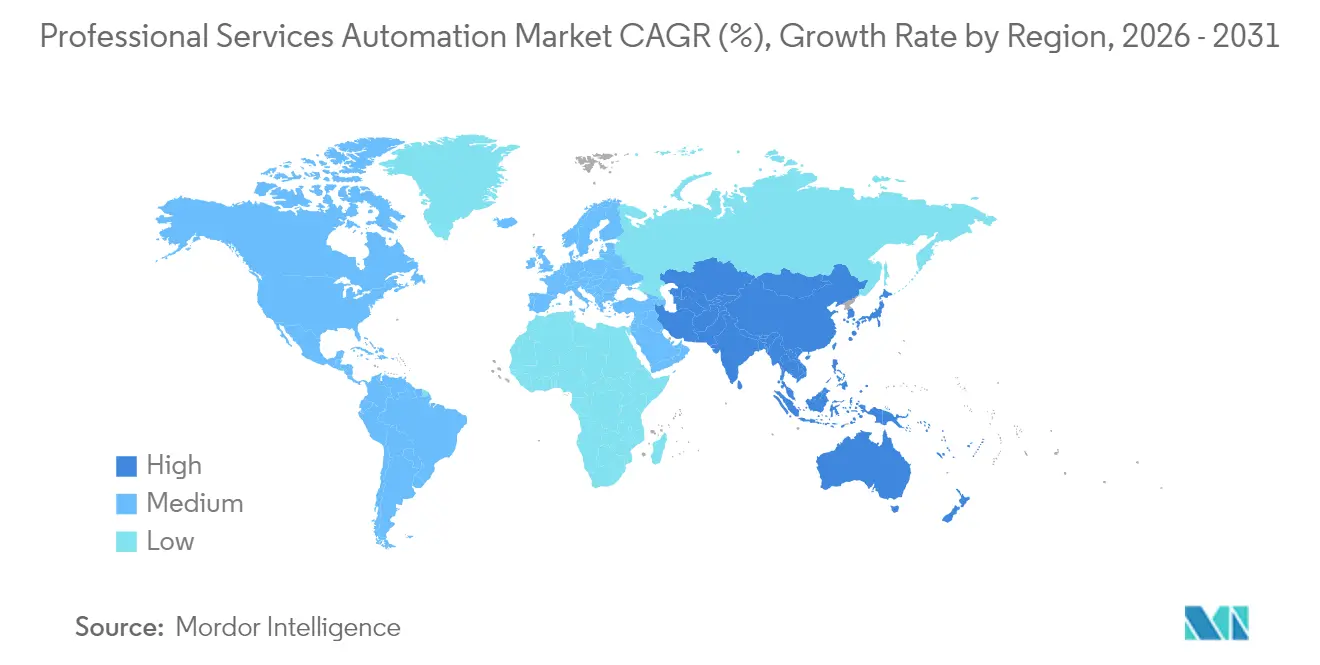
- By geography, North America captured 37.74% of 2025 revenue, but Asia-Pacific is expected to expand at a 14.08% CAGR through 2031.
Note: Market size and forecast figures in this report are generated using Mordor Intelligence’s proprietary estimation framework, updated with the latest available data and insights as of 2026.
Global Professional Services Automation Market Trends and Insights
Drivers Impact Analysis*
| Driver | (~) % Impact on CAGR Forecast | Geographic Relevance | Impact Timeline |
|---|---|---|---|
| Cloud PSA adoption among SMEs | +2.8% | Global, concentration in APAC and Europe | Medium term (2-4 years) |
| Drive for real-time resource and margin visibility | +2.1% | North America and EU, expanding to APAC | Short term (≤ 2 years) |
| ERP/CRM integration momentum | +1.9% | Global, led by North America | Medium term (2-4 years) |
| Shift to outcome-based service models | +1.7% | North America and EU core markets | Long term (≥ 4 years) |
| AI-driven predictive staffing analytics | +2.3% | Global, early adoption in North America | Medium term (2-4 years) |
| Source: Mordor Intelligence | |||
Cloud PSA Adoption Among SMEs
Small and medium enterprises propel the most dynamic growth in the professional services automation market as public-sector digitization grants and easy SaaS onboarding dismantle historical infrastructure hurdles. Singapore’s Productivity Solutions Grant reimburses up to 50% of subscription fees, letting micro-firms access capabilities once reserved for global consultancies. [1]SCS CPA, “PSG for Xero | Claim Up to 50% Grant | Cloud Accounting,” scs-cpa.com A referral flywheel forms as early wins showcase productivity boosts, and subscription pricing converts upfront CAPEX into manageable OPEX, giving vendors recurring cash flows that fund feature velocity. Jana Small Finance Bank cut turnaround time by 65-70% after deploying UiPath’s automation suite. Such results validate the thesis that even a 10-seat firm can wield enterprise-grade orchestration, reshaping competitive parity across professional services segments.
Drive for Real-Time Resource and Margin Visibility
Macroeconomic volatility forces firms to expose utilization gaps and margin leaks in real time rather than at quarterly review. BeyondTrust lifted resource utilization 20% after adopting Certinia PSA, pairing granular skills matrices with live feedback loops. Dashboards that surface over-allocated engineers or under-funded milestones curb cost overruns before they erode profitability. As more project teams work across time zones, instantaneous variance alerts allow managers to re-sequence tasks without breaching delivery windows. Embedded AI simulators pressure-test resourcing scenarios, ensuring that rate-card discounts or scope changes do not dilute forecasted gross margin.
ERP/CRM Integration Momentum
The professional services automation market relies on bidirectional data flow with core finance and customer systems; otherwise, project-to-cash remains fragmented. ServiceNow and Oracle now stream records between Workflow Data Fabric and Oracle Autonomous Database to synchronize contracts, costs, and invoices in near real-time. When milestone completion data is published directly into revenue recognition ledgers, billing latency collapses, and CFOs gain accurate day-zero cash forecasting. However, heterogeneous legacy stacks push implementation timelines as data governance and process realignment create cross-functional dependencies that smaller firms sometimes underestimate.
AI-Driven Predictive Staffing Analytics
Resource planning shifts from reactive to anticipatory as vendors embed context-aware algorithms. Oracle NetSuite’s SuiteProjects Pro evaluates historical burn rates and skill inventory to propose staffing options that maximize utilization. [2]Oracle NetSuite, “NetSuite 2025.1 Features New Procurement Solution,” netsuite.com Workday’s Agent System of Record houses AI agents beside human consultants, enabling hybrid teams where bots tackle repetitive reconciliations while specialists focus on advisory tasks. These advances shorten bench time, elevate billable hours, and align learning paths with emergent demand—each reinforcing platform stickiness.
Restraints Impact Analysis*
| Restraint | (~) % Impact on CAGR Forecast | Geographic Relevance | Impact Timeline |
|---|---|---|---|
| Data-privacy concerns in multi-tenant clouds | -1.4% | EU (GDPR), expanding globally | Short term (≤ 2 years) |
| Integration complexity with legacy stacks | -1.8% | Global, acute in large enterprises | Medium term (2-4 years) |
| Scarcity of PSA-skilled implementation talent | -1.1% | North America and EU | Medium term (2-4 years) |
| Vendor consolidation and lock-in risk | -0.9% | Global, concentrated in mid-market | Long term (≥ 4 years) |
| Source: Mordor Intelligence | |||
Data-Privacy Concerns in Multi-Tenant Clouds
GDPR imposes strict residency and consent rules that intensify scrutiny of shared-tenant architectures handling client records, project notes, and employee timesheets. Regulated advisory practices now negotiate data-processing addendums that stipulate encryption keys, regional failover, and audit-ready logging. While hyperscale clouds boast SOC 2 and ISO-27001 attestations, some clients still prefer single-tenant or EU sovereign zones, delaying pure-cloud migrations and marginally dampening professional services automation market adoption in the short term.
Integration Complexity with Legacy Stacks
Decades-old ERP deployments often lack modern APIs, forcing middleware workarounds that inflate project costs. The Revlon ERP collapse highlighted the financial risk of under-scoped integration efforts. Projects frequently run dual-process modes—manual spreadsheets for payroll alongside emerging PSA workflows—until cut-over, prolonging change fatigue. Scarcity of specialists versed in both COBOL-era financials and contemporary PSA schemas further strains timelines and raises contract rates, tempering the otherwise robust trajectory of the professional services automation market.
*Our forecasts treat driver/restraint impacts as directional, not additive. The impact forecasts reflect baseline growth, mix effects, and variable interactions.
Segment Analysis
By Deployment Type: Cloud Dominance Accelerates
Cloud deployments represented 68.72% of the professional services automation market size in 2025 and are slated to grow at 12.88% CAGR to 2031, reflecting a decisive pivot from on-premise custom builds. Automatic patching, elastic compute, and subscription pricing align with distributed workforce realities and CFO mandates to shift CAPEX to OPEX. On-premise PSA persists in highly regulated niches that mandate behind-firewall data residency, but even there, hybrid adjacency—analytics or mobile time capture in the cloud—gains traction. Platform vendors deepen alliances with AWS and Microsoft to tap global availability zones and shared AI accelerators. These moves compress implementation cycles from quarters to weeks, broadening the total addressable professional services automation market.
Traditional vendors that once relied on perpetual licenses now craft phased migration toolkits, offering data migration utilities and dual-running options that limit downtime. Emerging entrants born in the cloud exploit this inertia by promising zero-footprint deployment, consumption-based billing, and in-product walk-throughs suited to teams without dedicated IT support. As a result, cloud PSA adoption not only displaces legacy tools but can also catalyze first-time PSA buyers in emerging economies, extending the professional services automation market footprint.


By Component: Services Growth Reflects Implementation Complexity
While Solutions retained 61.12% revenue in 2025, the Services segment is expanding at 13.35% CAGR, mirroring the rise in enterprise-wide rollouts that demand process re-engineering, data cleanup, and user enablement. Every new AI module or ERP connector creates a downstream need for configuration, integration, and governance frameworks, and customers often lack the bandwidth to manage this layer themselves. Systems integrators, therefore, carve premium consulting revenue, shaping roadmaps, configuring role-based dashboards, and staging phased cut-overs.
Because successful adoption hinges on behavior change, change-management specialists orchestrate communications, role-play sessions, and KPI dashboards that sustain momentum post go-live. Vendors such as Thirdera became early movers, delivering Workflow Data Fabric accelerators for ServiceNow customers. The services upturn bolsters average contract value and underpins recurring expansion bookings, solidifying long-term vendor-client relationships within the professional services automation market.
By Enterprise Size: SME Segment Drives Market Expansion
Large enterprises commanded 59.25% of the professional services automation market share in 2025, leveraging volume discounts and complex functionality. Yet SMEs are charting a 14.95% CAGR through 2031 as low-touch onboarding, pay-as-you-grow tiers, and government subsidies create a frictionless runway. Cloud provisioning eliminates multi-week hardware procurement, while guided setup wizards cut implementation times to days, letting a 30-person creative agency track billable hours and deliverables with minimal overhead.
Government stimulus amplifies this motion: Singapore covers up to 50% of qualifying software spend, while India’s upcoming Digital MSME scheme earmarks budget for productivity tooling. Vendors respond with starter editions that bundle core project management, time capture, and invoicing, then upsell AI analytics and client portals as firms scale. This land-and-expand strategy enlarges the bottom-up funnel of the professional services automation market, securing future enterprise conversions.
By End-user Industry: IT and Telecom Leadership with Consulting Acceleration
IT and Telecom contributed 26.35% revenue in 2025, capitalizing on inherent tech fluency and project-centric delivery models. Implementations often integrate agile sprint boards, DevOps metrics, and real-time cost tracking. Consulting and Advisory, however, is the fastest riser at 13.74% CAGR, propelled by clients’ insistence on transparent scope, KPI-tied fees, and auditable deliverables. Firms embed PSA dashboards in client portals to expose milestone progress, resource burn, and change-request impacts, reinforcing trust.
BFSI accelerates adoption to automate stringent compliance workstreams: First Citizens Bank automated 23 processes via Pega RPA, carving substantial back-office savings. Healthcare, legal, and AEC sectors likewise converge on PSA for authority trail, audit readiness, and cross-disciplinary scheduling, demonstrating versatility across professional services verticals. Each verticalization spawns pre-configured templates, expanding the professional services automation market into nuanced industry workflows.
By Functionality Module: Analytics Growth Signals Intelligence Shift
Project and Resource Management owned 34.28% of the professional services automation market size in 2025, yet Business Analytics and Reporting is surging at 15.21% CAGR. Financial exception detection, driver-based forecasting, and natural-language query interfaces transform static reports into conversational insight engines. Oracle NetSuite now inserts generative AI prompts into its search bar so project managers can ask, “Where will gross margin land this quarter if utilization drops 3%?”. Such capabilities drive seat expansion beyond project controllers to finance, HR, and sales personas.
Time and Expense, Billing, and Knowledge Management remain foundational, but AI-based scenario planners, capacity heat-maps, and automated statement-of-work generators redefine strategic value. Vendors that prioritize open analytics APIs, model explainability, and cross-platform connectors elevate their differentiation, fostering a growth flywheel that reinforces subscription renewals and upsell within the professional services automation market.
Geography Analysis
North America contributed 37.74% of the professional services automation market size in 2025, anchored by mature IT consulting ecosystems, Sarbanes-Oxley controls, and early AI pilot budgets. Headquarters proximity grants many vendors live feedback loops and design-partner engagements that accelerate feature rollouts. Early adopters now progress from departmental pilots to enterprise-wide consolidations, focusing on utilization optimization, advanced profitability modeling, and AI-assisted proposal generation. Although saturation tempers volume growth, cross-selling into analytics, mobile expense, and talent marketplaces sustains revenue lift.
Asia-Pacific is on track for the fastest 14.08% CAGR, backed by government grants, rising wage pressure, and a vibrant SaaS developer base. Japan saw a 157% spike in electronic contract inquiries in 2024, signaling widespread digitization momentum. India’s SaaS firms target an 8% global share by 2028, translating into dual-role participation as both buyers and builders of PSA capabilities. Singapore’s Productivity Solutions Grant and Australia’s focus on AI productivity further energize the regional pipeline. Vendors localize tax, compliance, and language packs to capture these diverse micro-markets.
Europe offers steady uptake tempered by GDPR anxieties. Many advisory practices pursue private-cloud or EU-sovereign deployments, elongating sales but enlarging deal size once procurement hurdles clear. Workday’s GBP 550 million UK investment includes local AWS regions and apprenticeship programs, easing data-residency fears and talent shortages. ESG reporting mandates also catalyze PSA enhancements that capture carbon impact and diversity metrics, positioning the professional services automation market as an enabler of regulatory compliance. Meanwhile, the Middle East and Africa begin to deploy PSA for megaproject oversight—think smart-city builds and infrastructure rollouts—though connectivity gaps and scarce admin talent slow mass adoption.

Regulatory Landscape
Professional services automation (PSA) platforms operate under cross-cutting privacy, cybersecurity, and sector rules because they handle client data, employee timesheets, contracts, invoices, and delivery artifacts across cloud environments. In the United States, federal-aligned requirements shape procurement and controls for PSA used by government contractors and regulated service providers, anchored by frameworks such as FISMA and NIST guidance. In May 2026, NIST published SP 800-172 Rev. 3 to strengthen security requirements for protecting Controlled Unclassified Information (CUI) in nonfederal systems, reinforcing demand for auditable access controls, logging, and encryption practices across PSA deployments.
Cloud assurance programs also influence vendor roadmaps and buyer due diligence. In June 2026, FedRAMP launched its consolidated rules for 2026, emphasizing standardized security assessment and cloud-native control expectations for providers serving US federal agencies. This raises the bar for PSA vendors and their hosting stacks when targeting public sector and adjacent regulated customers. In Europe, GDPR continues to drive data residency and processing addenda in multi-tenant PSA contracts. The European Commission proposed the Digital Networks Act in 2026 to simplify and standardize governance across parts of the connectivity ecosystem, which adds another layer of compliance attention for PSA users and integrators operating across EU markets.
Value Chain Analysis
The PSA value chain starts with upstream cloud infrastructure and platform services (IaaS/PaaS), identity and security tooling, and adjacent enterprise systems (ERP/financials, CRM, HRIS) that supply master data for project-to-cash execution. PSA software vendors productize core modules (project and resource management, time and expense, billing, revenue recognition, and analytics) and increasingly add AI-assisted capabilities, low-code configuration, and packaged connectors to reduce integration friction. Distribution relies on direct enterprise sales, digital and SaaS-led motions for SMEs, and partner ecosystems, including systems integrators and specialist consultancies, that handle requirements mapping, data migration, integration, and change management for complex rollouts.
Downstream value concentrates in implementation services, ongoing managed services, and integration middleware that keeps finance, delivery, and customer records synchronized. Integration complexity with legacy stacks and shortages of PSA-skilled talent create bottlenecks that expand the role of SIs and certified partners, particularly in large enterprises and regulated industries. In the broader automation domain, ecosystem initiatives show how collaboration is used to incubate and commercialize automation use cases, including PSA International (PSA Ventures) and Saudi Arabia's NIDLP, which announced a February 2025 collaboration to identify and develop MVPs for port automation and sustainable supply chains. That example points to how innovation pipelines and partner programs can accelerate adoption of automation platforms and adjacent services capabilities.
Competitive Landscape
The professional services automation market manifests moderate fragmentation: a mix of incumbent suites, best-of-breed challengers, and horizontal ERP vendors layering PSA modules atop financial cores. ConnectWise and Kaseya retain loyal MSP footprints, yet cloud-native contenders like NinjaOne and HaloPSA court mid-market buyers through intuitive UX and rapid onboarding workflows. Feature parity narrows, forcing incumbents to bundle AI, security, and client-portal extensions.
Strategic M&A reshapes positioning. ServiceNow agreed to acquire Moveworks for USD 2.85 billion to embed conversational AI and search into its workflow stack. Oracle, SAP, and Microsoft extend adjacent capabilities rather than pursue outright PSA takeovers, preferring pre-built connectors and co-selling motions. This cooperative-competitive dynamic spawns joint innovation roadmaps—AWS contributes generative models to ServiceNow’s Now Assist suite while Microsoft surfaces PSA insights inside Teams chat.
White-space opportunities flourish in vertical PSA (law, audit, architecture) and AI-first assistants that draft statements of work or predict scope-creep risk. Vendors win share by exposing open APIs, offering usage-based pricing, and cultivating partner marketplaces that crowdsource integrations. Enterprise buyers elevate vendor viability, roadmap clarity, and data-ownership terms in RFP scoring, compelling suppliers to publish transparent governance charters. As AI regulation emerges, trust layers—model lineage, audit trails, bias mitigation—will separate contenders from pretenders within the professional services automation market.
Professional Services Automation Industry Leaders
Autotask Corporation
Kantata (Mavenlink + Kimble Apps)
Clarizen Inc.
Deltek Inc.
Certinia (FinancialForce.com, Inc.)
- *Disclaimer: Major Players sorted in no particular order

Market Opportunities and Future Outlook
Agentic and role-based AI layers are emerging as a key whitespace for differentiation as PSA shifts from administrative tracking toward active orchestration of delivery and financial operations. Product launches in 2026 reflect this direction: Certinia introduced Veda in April 2026 with pre-packaged, role-based agents, and Kantata introduced an Expertise Agent in June 2026 positioned to orchestrate actions across project, resource, and financial management systems. These releases broaden opportunities for vendors to sell higher-value automation tied to utilization, margin controls, and faster project-to-cash cycles, while also generating services demand for configuration, governance, and integration into ERP/CRM data flows.
Compliance-driven workflow automation and invoicing digitization also support monetization paths, particularly for cross-border service firms that need tax, e-invoicing, and audit-ready documentation embedded into delivery operations. Kantata's December 2025 partnership with Avalara to integrate e-invoicing directly into its PSA platform provides a concrete example of compliance packaging within the application layer, rather than relying on manual back-office processes or custom integration. Coupled with the market's cloud footprint (cloud deployments represented 68.72% of revenue in 2025), these moves reinforce opportunities around standardized connectors, policy-driven controls, and packaged compliance features that shorten implementation timelines and reduce operational leakage for both large enterprises and fast-growing SMEs.
Recent Industry Developments
- April 2026: Certinia launched Veda, an AI operations engine designed to automate professional services workflows such as success planning, business reviews, and account summaries. The release indicates a shift from PSA as a system of record toward agent-led execution layers that can be packaged into higher-value tiers and expand wallet share within existing accounts.
- December 2025: Kantata partnered with Avalara to deliver integrated e-invoicing capabilities within its PSA platform. The integration supports compliance-oriented billing workflows across geographies and reduces manual tax and invoicing steps that contribute to revenue leakage and delayed cash collection.
- November 2025: Kantata announced a strategic partnership with Provus to integrate AI-powered services estimation, pricing, and quoting with its PSA platform. By connecting presales and delivery data flows, the partnership targets fewer handoffs and tighter control over scope, pricing discipline, and downstream margin performance.


Research Methodology Framework and Report Scope
Market Definition and Coverage
This market covers professional services automation (PSA) software used by service-based firms to run the project-to-cash cycle, including planning, staffing, time and expense capture, billing, and related reporting. We treat revenues as PSA suite licenses, subscriptions, and support tied to these functions.
Scope exclusions: standalone task tools, generic ERP rollouts without PSA modules, and internal home-grown tools are not counted.
Segmentation Overview
- By Deployment Type
- Cloud
- On-Premise
- By Component
- Solutions
- Services
- By Enterprise Size
- Large Enterprises
- Small and Medium Enterprises (SMEs)
- By End-user Industry
- IT and Telecom
- BFSI
- Architecture, Engineering, and Construction
- Healthcare
- Legal Services
- Consulting and Advisory
- Other End-user Industries
- By Functionality Module
- Project and Resource Management
- Billing and Invoicing
- Time and Expense Tracking
- Business Analytics and Reporting
- Others
- By Geography
- North America
- United States
- Canada
- Mexico
- South America
- Brazil
- Argentina
- Chile
- Rest of South America
- Europe
- Germany
- United Kingdom
- France
- Italy
- Spain
- Russia
- Rest of Europe
- Asia-Pacific
- China
- India
- Japan
- South Korea
- Malaysia
- Singapore
- Australia
- Rest of Asia-Pacific
- Middle East and Africa
- Middle East
- United Arab Emirates
- Saudi Arabia
- Turkey
- Rest of Middle East
- Africa
- South Africa
- Nigeria
- Egypt
- Rest of Africa
- Middle East
- North America
Data Sources, Market Sizing, and Validation
Desk Research
Desk research was used to set the market perimeter and to anchor key adoption and spending signals around software used in professional services delivery. We leaned on public source types such as US SEC filings and annual reports, US Bureau of Labor Statistics employment series for professional and business services, US Census and BEA data for services output, and OECD and World Bank indicators on IT spending and business formation.
We also reviewed association and standards bodies materials, including project management and IT service management publications, along with reputable press, product documentation, and investor presentations, to understand packaging and common modules sold together. Where available, paid company financials subscriptions and a patent database helped cross-check revenue splits and product direction. These examples are not exhaustive, and we also used other public sources for data collection, validation, and clarification.
Primary Interviews and Surveys
Primary work was used to confirm what gets purchased as PSA in real deals and what stays as adjacent tools, then to pressure-test adoption assumptions by company size and industry use case. We spoke with a mix of PSA buyers and implementers, as well as channel and consulting respondents, across APAC, EMEA, and the Americas so regional pricing and the pace of cloud migration could be reflected in the model.
Distribution of primary research fieldwork respondents
| Company type | Respondent position | Region |
|---|---|---|
| Top tier: 33% | CXOs: 18% | APAC: 43% |
| Mid tier: 49% | Functional/Unit leaders: 25% | EMEA: 33% |
| Smaller Players: 18% | Managers: 57% | Americas: 24% |
Market-Sizing & Forecasting
Sizing starts with a top-down build where the addressable demand pool is reconstructed from the number of service-delivery organizations, their likely PSA penetration, and the typical annual software spend per user or per firm. This demand is then mapped into regions and core industries. To keep the output realistic, we corroborated totals with selective bottom-up checks, such as sampling vendor revenue disclosures, partner channel inputs, and a volume times ASP view for common user bands.
Key inputs included the share of cloud deployments versus on-premise, average user counts per services firm, renewal and expansion behavior in subscriptions, and module attach patterns across project management, resource planning, and billing. We also used macro signals such as services sector hiring and IT budget direction. Where bottom-up signals were missing for smaller vendors or niche verticals, we filled gaps with conservative penetration assumptions and then reviewed those assumptions against primary feedback.
Forecasts were built using scenario analysis supported by a light multivariate regression check. Drivers such as cloud adoption pace, services headcount, and software price progression were adjusted based on what interviewees described in procurement and implementation cycles. If the model output drifted too far from observed deal sizes or typical contract shapes, we revised inputs and re-validated.
Data Validation & Update Cycle
Validation is done by comparing outputs against independent signals, including regional enterprise software growth, services sector expansion indicators, and observable pricing ranges for PSA subscriptions. Outliers are flagged, and assumptions are revisited when regional splits or growth rates do not line up with interview feedback or recent public disclosures.
Before sign-off, the model goes through multi-step analyst reviews, and we re-contact respondents when a major variance cannot be explained through documented inputs. The report is refreshed annually, and interim updates are made when material events occur, such as sharp macro shifts or notable packaging changes. Right before delivery, we complete a final pass so the latest updated view is used throughout the published numbers.
Mordor Intelligence's Professional Services Automation Market Size Compared With Other Published Estimates
Published PSA market numbers often do not match because studies do not always count the same revenue streams, and the base year can also shift across reports. Differences also come from how cloud subscriptions are treated versus one-time licenses, plus how quickly price and adoption assumptions are refreshed.
A common gap driver in PSA is scope. Some estimates fold in broader services revenue such as implementation and consulting, while others include generic ERP modules as PSA even when PSA functionality is not purchased as a clear suite. Currency conversion timing and the way ASP progression is applied across regions can also move the total up or down, particularly when cloud migration accelerates faster in one region than another.
Benchmark comparison
| Source | Market Size | Gaps in Research Methodology |
|---|---|---|
| Mordor Intelligence | USD 16.92 B (2026) | |
| Global Consultancy A | USD 13.47 B (2025) | Uses a 2025 base and presents a software-only view with a different module list, which can omit some project-to-cash features that are bundled in broader PSA suites, thereby lowering the captured spend. |
| Industry Publisher B | USD 14.41 B (2025) | Anchors on a 2025 base year and may blend a wider set of applications and regional price paths, so the year-on-year scaling to later years depends more on forecast assumptions than on deal-shape checks. |
The spread is mainly explained by base-year choice and by whether adjacent services and non-PSA modules are pulled into the total, followed by how subscription pricing is carried forward by region. By keeping PSA tied to the project-to-cash suite revenue and then cross-checking adoption and pricing with interviews before finalizing the year mapping, this set of choices is applied consistently by Mordor Intelligence.


Key Questions Answered in the Report
What is fueling double-digit growth in the professional services automation market?
Cloud delivery, AI-powered analytics, and a shift toward outcome-based billing collectively drive the 11.17% CAGR forecast to 2031.
Which deployment model leads the professional services automation industry today?
Cloud holds 68.72% market share, thanks to faster implementation cycles and OPEX-friendly subscription terms.
How fast is the SME segment expanding within the professional services automation market?
SMEs are projected to grow at 14.95% CAGR through 2031 as subsidies and SaaS pricing remove entry barriers.
Which functionality module is growing the quickest?
Business Analytics and Reporting is advancing at 15.21% CAGR because firms want predictive insights beyond basic project tracking.
Why is Asia-Pacific seen as the most attractive regional opportunity?
Government digitization grants, rising labor costs, and an expanding SaaS developer ecosystem push Asia-Pacific to a 14.08% CAGR forecast.
Page last updated on:


