Data Center Automation Market Size and Share
Market Overview
| Study Period | 2020 - 2031 |
|---|---|
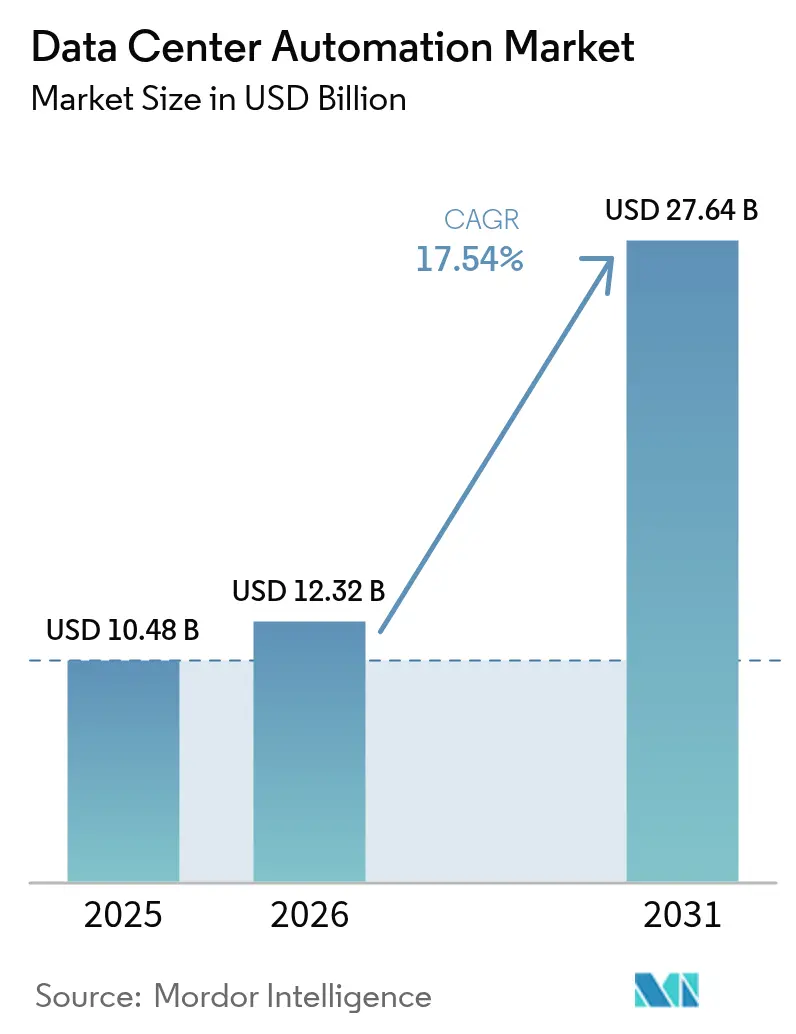
| Market Size (2026) | USD 12.32 Billion |
| Market Size (2031) | USD 27.64 Billion |
| Growth Rate (2026 - 2031) | 17.54% CAGR |
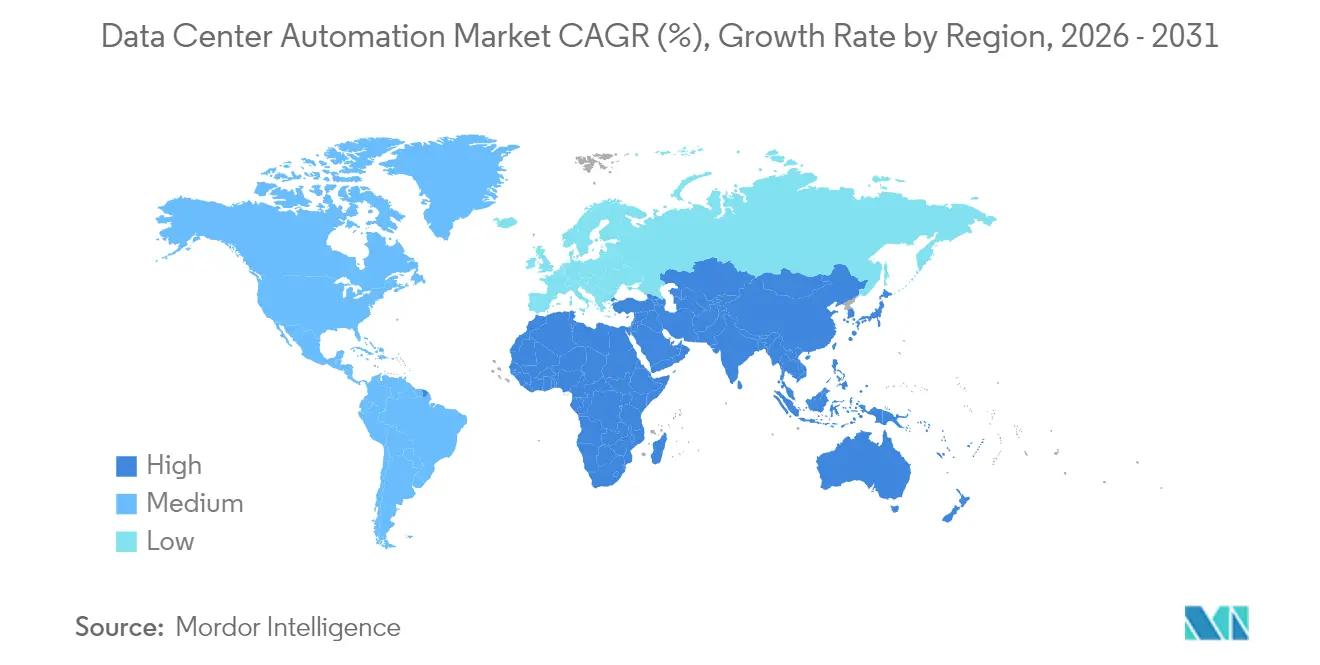
| Fastest Growing Market | Asia Pacific |
| Largest Market | North America |
| Market Concentration | Medium |
Major Players *Disclaimer: Major Players sorted in no particular order Image © Mordor Intelligence. Reuse requires attribution under CC BY 4.0. | |
Data Center Automation Market Analysis by Mordor Intelligence
The data center automation market size in 2026 is estimated at USD 12.32 billion, growing from 2025 value of USD 10.48 billion with 2031 projections showing USD 27.64 billion, growing at 17.54% CAGR over 2026-2031. Rising reliance on cloud platforms, surging AI workloads, and growing pressure to reduce energy footprints are moving automation from an operational convenience to a board-level mandate. Hyperscale build-outs have intensified the need for software-defined orchestration that maintains service quality while trimming power bills. In parallel, modular designs and liquid-cooling rollouts demand fine-grained, real-time controls that only automated systems can deliver. Competitive intensity is accelerating as vendors embed AI engines that self-tune infrastructure and predict hardware failures, yielding measurable savings on labor, energy, and downtime. Further, the U.S. Department of Energy reports that data center electricity demand could double or triple by 2028, with AI applications driving much of this growth, creating urgent pressure for automation solutions that can optimize energy usage. Adoption is further strengthened by maturing grid-interactive programs that pay operators to shift loads, turning energy flexibility into a revenue stream.[1]U.S. Department of Energy, “DOE Releases New Report Evaluating Increase in Electricity Demand from Data Centers,” energy.gov
Key Report Takeaways
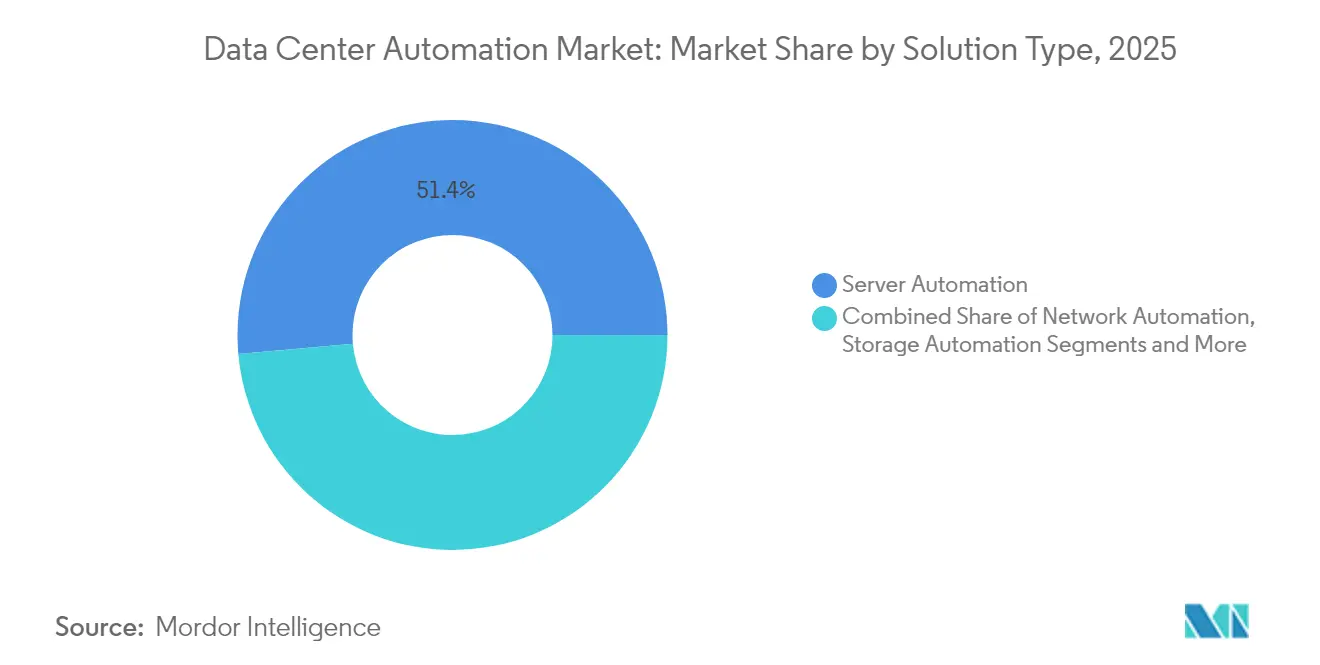
- By solution, Server Automation held 51.40% of the data center automation market share in 2025, while Network Automation is projected to expand at a 18.82% CAGR to 2031.
- By data center tier, Tier 3 facilities accounted for 44.95% share of the data center automation market size in 2025, but Tier 4 is advancing at an 18.02% CAGR through 2031.
- By deployment mode, cloud platforms captured 51.60% of the data center automation market size in 2025 and are forecast to grow at a 21.65% CAGR between 2026-2031.
- By data center type, colocation providers led with a 54.70% share of the data center automation market size in 2025, whereas hyperscalers are climbing at a 19.02% CAGR.
- By geography, North America dominated with 46.05% of the data center automation market share in 2025; Asia-Pacific is poised for a 19.05% CAGR through 2031.
Note: Market size and forecast figures in this report are generated using Mordor Intelligence’s proprietary estimation framework, updated with the latest available data and insights as of 2026.
Global Data Center Automation Market Trends and Insights
Drivers Impact Analysis*
| Driver | (~) % Impact on CAGR Forecast | Geographic Relevance | Impact Timeline |
|---|---|---|---|
| Cloud and hyperscale build-outs | +1.8% | North America, Asia-Pacific, Europe | Medium term (2-4 years) |
| Energy-efficient and sustainable operations | +1.5% | Global (with emphasis on Europe and North America) | Long term (≥ 4 years) |
| AI/ML workload automation | +1.2% | North America, Asia-Pacific | Short term (≤ 2 years) |
| Hybrid and multi-cloud complexity | +1.0% | Global | Medium term (2-4 years) |
| Grid-interactive incentive programs | +0.9% | North America, Europe | Long term (≥ 4 years) |
| Edge localization in emerging economies | +0.8% | Asia-Pacific, Latin America, Middle East | Medium term (2-4 years) |
| Source: Mordor Intelligence | |||
Surge in cloud and hyperscale build-outs
Hyperscale campuses scheduled for 2025 investment exceed USD 250 billion, creating an automation imperative that spans capacity planning, thermal management, and live migration of workloads. Operators are designing facilities around AI-driven controllers able to allocate compute, power, and cooling resources in seconds, matching service-level demands while shaving operator intervention to a minimum. Capital-intensive expansions are now coupled with modular blocks that ship pre-wired and pre-tested, so orchestration software must instantly discover, baseline, and integrate each block. Global vendors are responding with intent-based platforms that enforce policies across thousands of assets, turning build-out velocity into a competitive weapon.
Demand for energy-efficient and sustainable operations
Datacenters currently use 1-3% of global electricity, and projections suggest the share could rise to 5% by 2030 if AI uptake accelerates. Strict initiatives such as the Climate Neutral Data Centre Pact in Europe set a PUE ceiling of 1.3 for new builds, prompting operators to adopt automation that continually tunes airflows, fan speeds, and workload placements. AI-enhanced controls have already trimmed cooling power by up to 40% in early deployments, and operators showcasing verifiable carbon reductions are attracting hyperscale tenants that must hit their own ESG targets. Automated sustainability reporting is further lowering compliance overheads and improving transparency with regulators.
Rising AI/ML workload automation needs
Model training clusters push rack densities beyond 30 kW, compared with 8 kW for conventional deployments. Automation therefore shifts from simple scheduling to dynamic power governance, orchestrated liquid-cooling loops, and rapid rebalancing to avoid thermal hotspots. Platforms integrate telemetry from GPUs, immersion tanks, and power shelves to forecast bursts and pre-empt throttling. Enterprises are packaging these capabilities into turnkey AI infrastructure pods managed entirely through API calls, ensuring that scarce AI capacity is utilized at maximum efficiency while safeguarding uptime commitments.[2]European Data Centre Association, “Climate Neutral Data Centre Pact,” eudca.org
Complexity of hybrid and multi-cloud architectures
More than 64% of IT teams operate hybrid clouds. Each added platform multiplies configuration items and compliance checkpoints, making manual oversight infeasible. Infrastructure-as-code approaches allow teams to store every resource definition in version-controlled templates, after which automated pipelines deploy, validate, and remediate deviations. Enterprises are standardizing on unified orchestration layers that maintain consistent policies for firewalls, identity, and service mapping across on-premises and public clouds, reducing audit gaps and supporting rapid service launches in new regions.
Restraints Impact Analysis*
| Restraint | (~) % Impact on CAGR Forecast | Geographic Relevance | Impact Timeline |
|---|---|---|---|
| Legacy system interoperability hurdles | -0.8% | Global (higher impact in North America, Europe) | Medium term (2-4 years) |
| Cyber-security and compliance risks | -0.7% | Global | Short term (≤ 2 years) |
| NetOps / automation talent shortage | -0.6% | Global (acute in North America, Europe) | Medium term (2-4 years) |
| Power and water scarcity in major hubs | -0.5% | North America, Europe, Asia-Pacific | Long term (≥ 4 years) |
| Source: Mordor Intelligence | |||
Legacy system interoperability hurdles
Many operators still run proprietary hardware with limited APIs, forcing costly custom connectors before modern orchestration can take hold. Network teams often hesitate to automate core switches that handle mission-critical traffic, fearing outages from mis-configured scripts. Lack of design standardization across legacy estates further complicates rollouts because templates built for one site rarely port cleanly to another. Vendors are responding with extensive plugin marketplaces and AI-based discovery tools that reverse-engineer device configurations, yet migration timelines remain protracted for organizations with deep technical debt
Heightened cyber-security and compliance risks
Automated workflows introduce new attack vectors via poorly secured APIs, stored credentials, and botched role-based access controls. Regulators are tightening the rules: financial institutions operating in the EU must satisfy the Digital Operational Resilience Act, which mandates rapid incident reporting and detailed change tracking. Operators are pivoting to zero-trust models, embedding continuous verification and immutable logs within automation platforms. Parallel investments in compliance automation lower audit costs yet expose the scarcity of staff qualified to interpret overlapping standards.
*Our forecasts treat driver/restraint impacts as directional, not additive. The impact forecasts reflect baseline growth, mix effects, and variable interactions.
Segment Analysis
By Solution: Network Automation Pushes Toward Intent-Based Control
Network Automation is the fastest-growing segment with a 18.82% CAGR projected through 2031, although Server Automation retained 51.40% of the data center automation market share in 2025. Growth in network-focused platforms mirrors the proliferation of micro-services, container clusters, and east-west traffic patterns that overwhelm manual command-line changes. Enterprises are shifting to controllers that translate business intent into device configurations, then verify outcomes through closed-loop telemetry. This shift unlocks programmable QoS, micro-segmentation, and automatic rollback capabilities that reduce downtime incidents.
In the medium term, orchestration suites are converging previously separate functions- configuration management, performance analytics, and compliance checks- into unified toolchains governed by role-based access. AI-powered diagnostics pinpoint latency roots and suggest remediations, shortening mean time to resolution. As a result, senior leadership now views network automation as a strategic investment rather than a cost center. Momentum is expected to continue as 30% of enterprises aim to automate at least half of their network activities by 2026, setting the foundation for widespread intent-based networking adoption.


By Data Center Tier: Tier 4 Facilities Set the Pace for Autonomous Operations
Tier 3 facilities commanded 44.95% of the data center automation market size in 2025, but Tier 4 deployments are on track for an 18.02% CAGR thanks to stringent 99.995% uptime expectations. Operators of Tier 4 campuses rely on orchestrated failover processes, real-time health scoring, and self-healing mesh architectures. Automated diagnostics inspect redundant paths and environmental sensors thousands of times per minute, triggering pre-emptive part swaps or load transfers.
Conversely, Tier 1 and Tier 2 sites pursue selective automation, often focusing on backup scheduling and patch management, due to budget limits. Yet falling software costs and modular controller designs are lowering entry barriers. Disaster-recovery orchestration is becoming a universal priority: Automated runbooks now test failover sequences monthly without human intervention, fulfilling audit requirements while safeguarding revenue. These capabilities gradually narrow the operational disparities between tier levels and raise baseline expectations across the industry.
By Deployment Mode: Cloud Platforms Cement Leadership
Cloud deployments accounted for 51.60% of the data center automation market size in 2025 and exhibit the strongest growth trajectory at 21.65% CAGR through 2031. By 2025, 83% of business workloads are expected to be in the cloud, further accelerating the adoption of cloud-based automation platforms. Enterprises favor cloud-native automation for its rapid provisioning, continuous upgrades, and elastic licensing. Security concerns that once favored on-premise installations are receding as providers secure advanced compliance attestations, zero-trust architectures, and integrated key-management services.
Hybrid models are becoming mainstream as organizations seek consistent policy enforcement across locations. Vendors are shipping unified control planes that abstract physical boundaries, letting engineers manage edge clusters, private clouds, and public clouds through identical Terraform or Ansible templates. On-premise solutions persist for bespoke latency goals or sovereign mandates, yet the march toward software-defined everything places long-term momentum squarely with cloud-delivered orchestration.

By Data Center Type: Hyperscalers Accelerate Automation Spending
Colocation providers held 54.70% share of the data center automation market size in 2025, but hyperscalers are gaining at a 19.02% CAGR as they roll out giant campuses supporting AI services. These operators often exceed 5,000 servers per hall and demand fully autonomous provisioning that brings racks online within minutes of arrival. Investment in digital twins and AI-driven energy optimization lets hyperscalers fine-tune PUE in real time, directly impacting profit margins at scale.
Enterprises and edge sites apply automation to overcome limited onsite staffing. Remote operation suites package zero-touch deployment, anomaly alerts, and hardware lifecycle tracking, enabling centralized teams to administer hundreds of micro-sites. Meanwhile, colocation firms differentiate by offering automation-ready suites, DCIM integrations, and sustainability dashboards that customers can feed into corporate ESG reports. Across all facility types, software-defined infrastructure is normalizing a code-centric culture that values repeatability, compliance, and speed-to-service.
Geography Analysis
North America retained 46.05% of the data center automation market share in 2025, benefiting from deep cloud adoption and access to large capital pools. Power constraints in core corridors such as Northern Virginia sharpen the focus on grid-interactive automation that maximizes every available megawatt. Federal research indicating that data-center electricity demand may double by 2028 magnifies interest in platforms that minimize idle consumption and monetize flexibility through demand-response programs. Corporate sustainability narratives further encourage aggressive deployment of AI-guided cooling and capacity-planning tools.
Asia-Pacific is the fastest-growing territory with a 19.05% CAGR expected between 2026-2031. National initiatives in China, Japan, and India incentivize local cloud zones and edge build-outs, magnifying the need for automation that can compensate for labor shortages. Large-scale projects, including multi-billion-dollar investments in Thailand and Indonesia, bundle liquid-cooling and renewable power sources, demanding orchestration layers able to harmonize disparate technologies from day one.
Europe combines mature colocation hubs with tight environmental regulation, creating a crucible for advanced sustainability automation. Commitments to achieve climate-neutral facilities by 2030 push operators to deploy continuous-optimization engines that maintain sub-1.3 PUE targets and verify renewable-energy usage. Incentives for demand-response participation and heat-re-use schemes reinforce the business case. Growing activity in the Middle East and Africa mirrors this momentum: flagship projects in Saudi Arabia, the United Arab Emirates, and South Africa require net-zero proof points and autonomous operation to overcome remote-site staffing limitations, positioning automation as a prerequisite for securing financing and tenants.

Regulatory Landscape
Regulation and standards are increasingly steering automation requirements toward auditable telemetry, resilience KPIs, and sustainability reporting. In the European Union, Commission Delegated Regulation (EU) 2024/1364 introduces mandatory data center reporting for operators at or above 500 kW IT power demand, covering energy, water, and heat utilization, and it also tightens colocation transparency, including customer-specific metrics with a reporting deadline referenced as 15 May 2026. Alongside this, cyber-resilience and operational traceability requirements, including EU financial-entity obligations under the Digital Operational Resilience Act, raise the need for automated change tracking, immutable logging, and incident response workflows within automation toolchains.
Standards activity is accelerating and is pushing buyers toward interoperable, KPI-driven operations frameworks. ISO/IEC TS 8236-1:2025 and ISO/IEC TS 8236-2:2025, published September 2025, formalize provisioning and optimization KPIs spanning IT equipment and facility infrastructure. ISO/IEC TS 22237-31:2026, published 3 February 2026, defines resilience and fault-tolerance KPIs for data center infrastructure. At the national level in Europe, Standard Norge published NEK EN 50600-3-1:2026 on 19 May 2026, emphasizing management and operational processes tied to resilience, capacity planning, and energy efficiency, which reinforces demand for automation platforms that can standardize operations across sites and generate compliance-ready evidence.
Competitive Landscape
The data center automation market is moderately concentrated, with legacy infrastructure giants such as Cisco, VMware (Broadcom), and Microsoft contending with focused specialists. Consolidation is reshaping the field: established providers pursue acquisitions that add infrastructure-as-code capabilities, closed-loop telemetry, or AI performance engines. Strategic partnerships—exemplified by collaborations between automation software vendors and hyperscale owners—deliver validated stacks that shorten customer deployment cycles.
Emerging firms target high-growth niches, including intent-based networking, compliance automation, and energy optimization. Hyperscale cloud providers embed proprietary automation layers inside their IaaS portfolios, bundling orchestration as an intrinsic part of compute and storage services, which pressures standalone software vendors to differentiate on multi-cloud reach and on-premise interoperability. Technology roadmaps emphasize machine-learning algorithms that predict component failures, forecast capacity bottlenecks, and recommend energy-aware workload scheduling. Vendors capable of translating these insights into demonstrable opex savings and sustainability metrics are positioned to expand their share.
Competition is also shaped by talent scarcity: suppliers that offer turnkey managed automation services or “automation-as-a-service” propositions reduce customers’ hiring burden and accelerate time-to-value. Hardware manufacturers now bundle smart telemetry chips, making their gear “plug-and-automate” ready and deepening ecosystem lock-in. The coming years will likely see a bifurcation between full-stack orchestration platforms and highly modular toolchains, with buyers selecting architectures that best fit organizational maturity and compliance posture.
Data Center Automation Industry Leaders
VMware Inc.
Cisco Systems Inc.
IBM Corporation
Microsoft Corporation
Hewlett Packard Enterprise Company
- *Disclaimer: Major Players sorted in no particular order

Market Opportunities and Future Outlook
Energy and water transparency obligations, rising AI rack densities, and multi-site operating models are opening whitespace for automation platforms that unify IT orchestration with facilities control and compliance reporting. In the EU, reporting requirements under Commission Delegated Regulation (EU) 2024/1364 increase the value of always-on monitoring, automated data quality checks, and tenant-aware reporting for colocation operators, creating demand for software that can bridge DCIM-style telemetry with infrastructure-as-code, policy enforcement, and audit trails. Standardization also reduces integration friction for multivendor estates, with ISO/IEC TS 8236-1:2025 and ISO/IEC TS 8236-2:2025 providing a KPI backbone for provisioning and capacity planning, and ISO/IEC TS 22237-31:2026 defining resilience KPIs that can be embedded into automated runbooks and service-level governance.
A second opportunity area is the shift toward higher autonomy in physical operations, where control loops expand from basic threshold-based alarms into model-predictive optimization across cooling, power, and airflow. Real-world pilots and product launches during 2026 reinforce this direction: the UAE Ministry of Energy and Infrastructure, Khazna Data Centers, Agility, and Phaidra launched an AI efficiency pilot to deploy AI control across selected Khazna campuses, and vendors introduced autonomy-focused platforms for continuous facility operations, including PassiveLogic Level 3 Autonomy and Noda agentic automation for building operations. At the same time, enterprise and hyperscale buyers are converging on programmable infrastructure interfaces (such as DMTF Redfish) and quality management initiatives (TIA work on the Data Center Excellence, DCE 9000 standard) to reduce bespoke integrations, supporting broader movement toward API-first, closed-loop automation across compute, network, storage, and facility layers.
Recent Industry Developments
- June 2026: Cisco unveiled Cisco Cloud Control at Cisco Live as a unified platform for humans and AI agents to manage and automate IT infrastructure, with integrations spanning major cloud ecosystems such as AWS and Microsoft. The launch underscores a shift from task-level automation to agentic operations where cross-domain workflows (networking, security, and observability) can be coordinated through a single control plane.
- May 2026: Broadcom announced VMware Cloud Foundation 9.1 positioned for production AI and highlighted automated fleet operations scaling to up to 5,000 hosts. This strengthens the role of private-cloud automation in AI deployments by packaging lifecycle management, policy control, and operational consistency into the core virtualization platform many enterprises already use.
- April 2024: IBM announced plans to acquire HashiCorp to combine HashiCorp infrastructure-as-code workflows with IBM hybrid cloud and automation capabilities. The acquisition plan deepens consolidation around automation toolchains and accelerates vendor efforts to deliver integrated provisioning, governance, and compliance controls across hybrid environments.


Research Methodology Framework and Report Scope
Market Definition and Coverage
For this study, the data center automation market covers revenues earned from software and related services that automate provisioning, monitoring, orchestration, and policy based operations across compute, storage, and networking in data centers.
Scope exclusions: We exclude data center construction and fit-out, facility hardware sales, and pure managed hosting or colocation rental fees that are not tied to automation software usage.
Segmentation Overview
- By Solution
- Server Automation
- Network Automation
- Storage/Database Automation
- Orchestration and Configuration Mgmt.
- Performance and Compliance Mgmt.
- By Data Center Tier Type
- Tier 1 and 2
- Tier 3
- Tier 4
- By Deployment Mode
- On-premise
- Cloud
- By Data Center Type
- Hyperscalers/Cloud Server Providers
- Colocation Providers
- Enterprise and Edge
- By Geography
- North America
- United States
- Canada
- Mexico
- Europe
- United Kingdom
- Germany
- France
- Italy
- Spain
- Rest of Europe
- Asia-Pacific
- China
- Japan
- India
- Singapore
- Australia
- Malaysia
- Rest of Asia-Pacific
- South America
- Brazil
- Chile
- Argentina
- Rest of South America
- Middle East
- United Arab Emirate
- Saudi Arabia
- Turkey
- Rest of Middle East
- Africa
- South Africa
- Nigeria
- Rest of Africa
- North America
Data Sources, Market Sizing, and Validation
Desk Research
Desk research helped set clear definitions and collect the baseline indicators used to build the market model. We referenced non-paywalled public sources such as the International Energy Agency for electricity demand context, the US Energy Information Administration for energy price direction, the International Telecommunication Union for internet and traffic indicators, and the World Bank for macro and investment indicators that influence data center build activity.
We also used sources such as customs and trade statistics portals for high-level import and export signals tied to data center equipment flows, peer reviewed journals for automation and operations best practices, and data center association websites for terminology and adoption themes. To sanity check supplier direction, we reviewed SEC filings, annual reports, and investor presentations, and supplemented with paid subscriptions for company financials and intelligence, news and financials, and patent databases. The sources listed here are illustrative only, and we used additional public and paid references for data collection, validation, and clarification.
Primary Interviews and Surveys
Primary work focused on confirming how buyers define automation, which modules are commonly deployed, and how pricing changes with scale, deployment mode, and support needs. We spoke with operators, integrators, and solution specialists across APAC, EMEA, and the Americas to close gaps from desk research and recheck assumptions before finalizing totals.
Distribution of primary research fieldwork respondents
| Company type | Respondent position | Region |
|---|---|---|
| Top tier: 26% | CXOs: 12% | APAC: 44% |
| Mid tier: 59% | Functional/Unit leaders: 31% | EMEA: 29% |
| Smaller Players: 15% | Managers: 57% | Americas: 27% |
Market-Sizing & Forecasting
Sizing started with a top-down build that reconstructs the addressable spend by linking data center operations needs to adoption of automation software and services across enterprise, colocation, hyperscale, and edge environments. The demand pool was shaped using practical indicators such as data center capacity additions, expansion activity in cloud and colocation, workload virtualization and container usage, typical software spend intensity by facility type, and the split between on-premises and cloud delivered automation.
To keep totals realistic, we corroborated results with selective bottom-up checks. These included sampled supplier revenue splits, channel checks with integrators, and simple module volume times ASP checks for common automation functions. When direct splits were not available, we filled gaps through peer benchmarking of similar automation modules, then applied conservative capture ratios reviewed in interviews.
Forecasts were produced using scenario analysis anchored to capacity and workload outlooks, then adjusted for expected pricing and packaging changes. Inputs such as AIOps adoption, staffing constraints in operations teams, energy efficiency programs, and refresh cycles of orchestration platforms were used as directional levers, and the final forecast path was aligned to what respondents described as executable budgets.
Data Validation & Update Cycle
Outputs were checked against independent signals, including the pace of data center capacity growth, major cloud and colocation expansion announcements, and reported software revenue direction from relevant public filings. When a sharp jump or dip appeared without support from these signals, we revisited the underlying assumptions and ran targeted follow-ups to confirm whether the change was temporary or structural.
Before sign-off, the model goes through multi-step analyst review so unit assumptions, currency treatment, and regional roll ups remain consistent across years. Reports are refreshed annually, and interim updates are triggered by material events such as pricing shifts, regulation led reporting changes, or step changes in deployment patterns. Right before delivery, an analyst completes a final pass to ensure the latest updated view is reflected.
Mordor Intelligence's Global Data Center Automation Market Market Size Compared With Other Published Estimates
Different market values for data center automation often appear even when the topic name looks similar. The spread usually comes from differences in how each publisher defines automation, the reference year, and how adoption and pricing assumptions are carried into the forecast.
Some published figures include broader operational spend, including managed services and facility related categories that sit next to software. For Mordor Intelligence, revenue is counted only when it is tied to automation software and integrated orchestration used to provision, monitor, and optimize compute, storage, and network resources. Facility build, stand-alone hardware, and rack rental fees sit outside scope.
Benchmark comparison
| Source | Market Size | Gaps in Research Methodology |
|---|---|---|
| Mordor Intelligence | USD 12.32 B (2026) | |
| Global Consultancy A | USD 11.61 B (2025) | The value is stated for an earlier year, and the public scope description is high level, which can shift what modules and service elements are counted and how ASP progression is applied. |
| Industry Publisher B | USD 12.09 B (2025) | The sizing is anchored to solution buckets (storage, network, server), which can double count overlapping orchestration layers when platforms are bundled, and it uses a different base year for currency and adoption assumptions. |
The comparison indicates that base year selection and scope treatment for bundled platforms versus adjacent services explain most of the variance. With clear inclusion rules and repeatable checks against capacity growth and adoption signals, the final number remains traceable across regions and over time.


Key Questions Answered in the Report
What is the current size of the data center automation market?
The market is valued at USD 12.32 billion in 2026 and is projected to grow steadily through the decade.
Which region leads spending on automation?
North America holds 46.05% of global spending due to mature cloud adoption and intensive AI build-outs that require sophisticated orchestration.
Why is network automation gaining momentum?
Hybrid architectures and micro-services multiply configuration changes; intent-based controllers translate policy into device commands, cutting outages and manual effort.
How does automation improve sustainability performance?
AI-enabled platforms continuously tune cooling and workload placement, which can reduce energy use by up to 40% and help meet stringent PUE targets
What deployment model is expanding fastest?
Cloud-delivered automation grows at a 21.65% CAGR because it offers elastic scaling, rapid feature updates, and strong compliance coverage.
How are talent shortages influencing adoption patterns?
Enterprises unable to hire enough NetOps staff increasingly rely on turnkey managed automation services and low-code tools to maintain growth without adding headcount
Page last updated on:


