Wind Turbine Generator Market Size and Share
Market Overview
| Study Period | 2021 - 2031 |
|---|---|
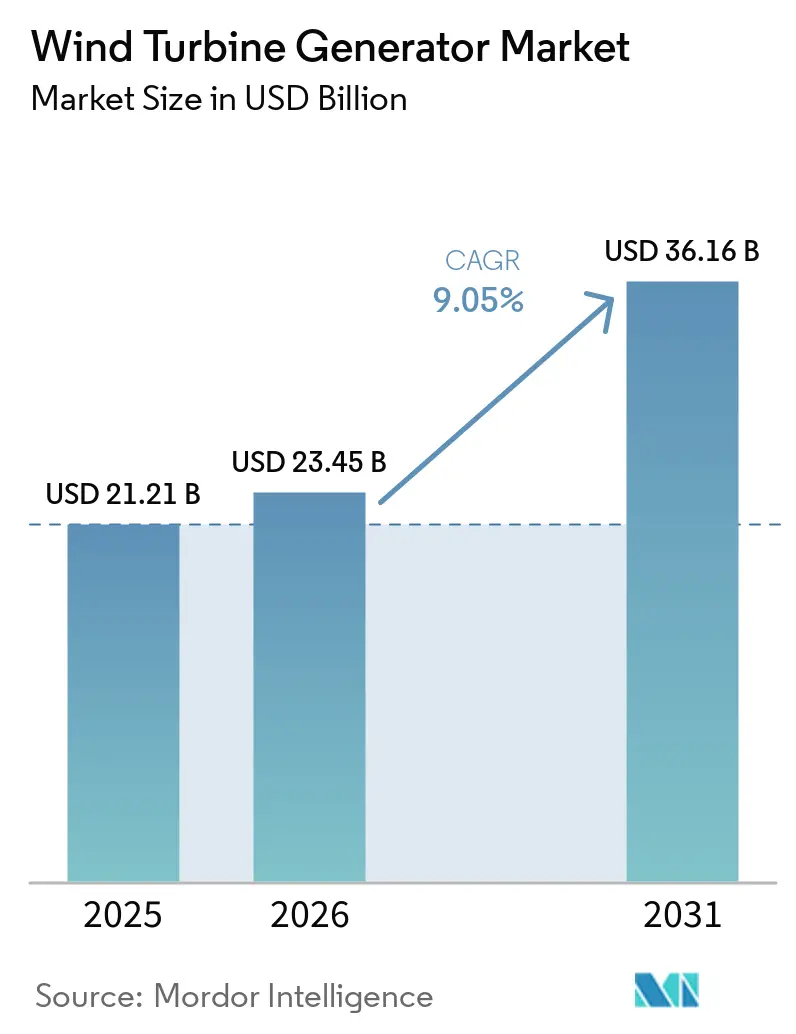
| Market Size (2026) | USD 23.45 Billion |
| Market Size (2031) | USD 36.16 Billion |
| Growth Rate (2026 - 2031) | 9.05% CAGR |
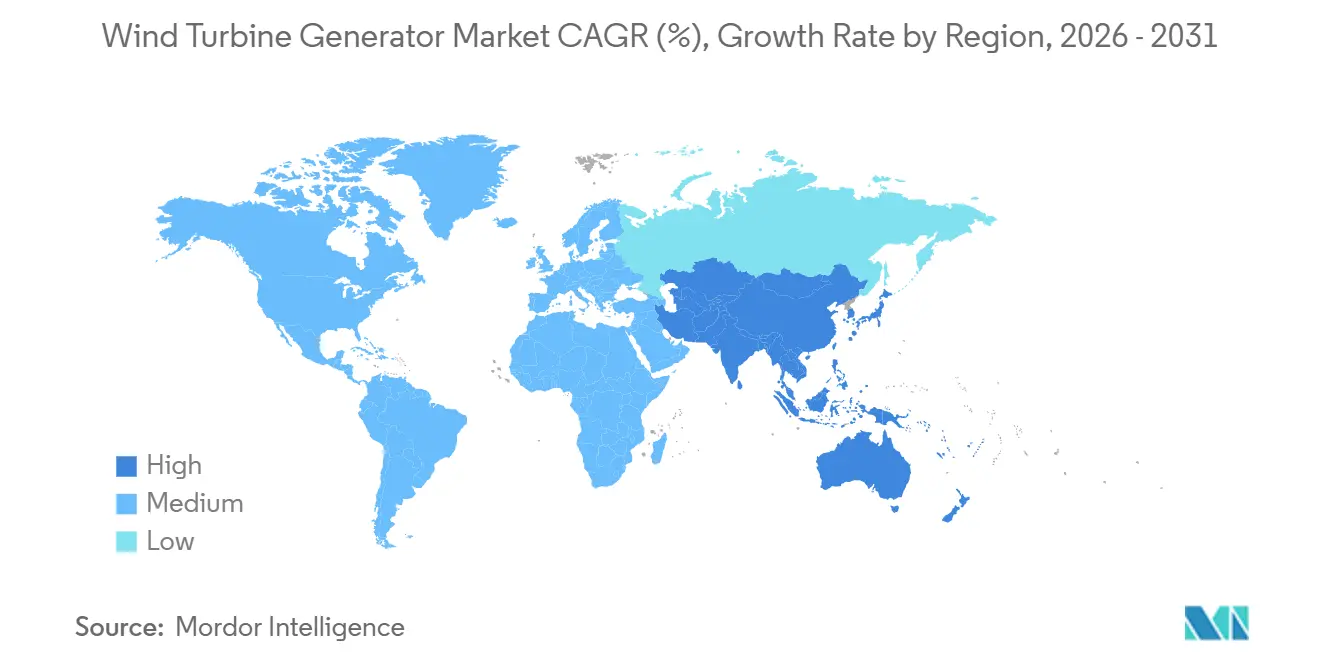
| Fastest Growing Market | Asia Pacific |
| Largest Market | Asia Pacific |
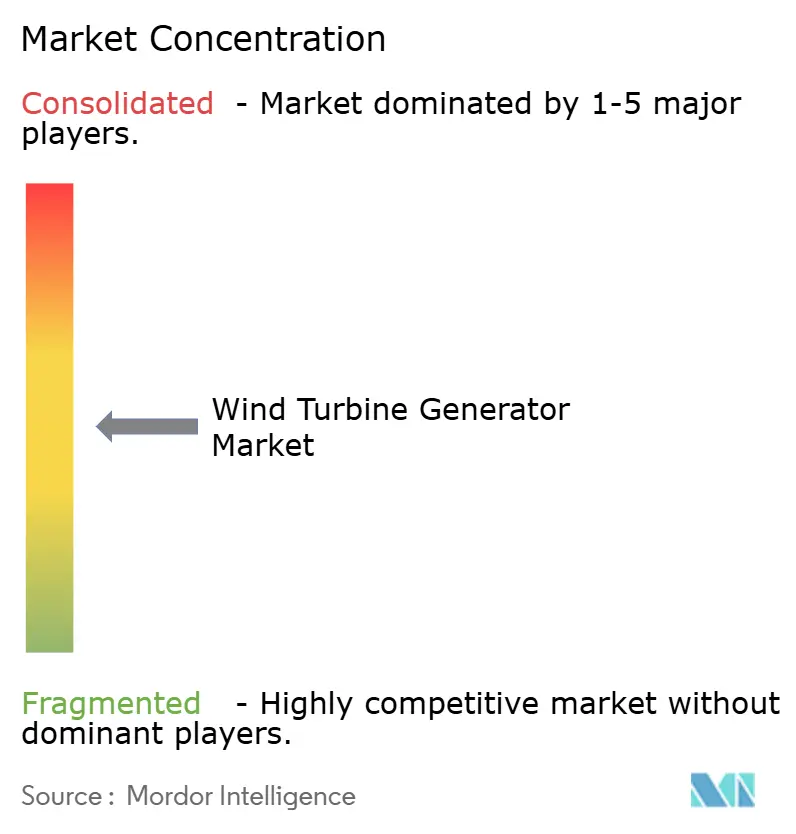
| Market Concentration | Medium |
Major Players *Disclaimer: Major Players sorted in no particular order Image © Mordor Intelligence. Reuse requires attribution under CC BY 4.0. | |
Wind Turbine Generator Market Analysis by Mordor Intelligence
The Wind Turbine Generator Market size is expected to grow from USD 21.21 billion in 2025 to USD 23.45 billion in 2026 and is forecast to reach USD 36.16 billion by 2031 at 9.05% CAGR over 2026-2031. Rising demand for performance-optimized generator architectures, stricter grid-stability mandates, and the rapid commercial rollout of lightweight offshore platforms underpin this expansion. Doubly-Fed Induction Generators (DFIG) still anchor most onshore builds, yet Permanent-Magnet Synchronous Generator (PMSG) adoption is accelerating as recycled rare-earth inputs lower costs and as direct-drive designs cut gearbox downtime. Floating offshore pilots in China and Norway prove that generator mass below 8 tonnes per megawatt stabilizes platforms in 50-meter water depths, opening new deep-water lease areas. Corporate power-purchase agreements totaling 215 GW of turbine orders in 2025 are tilting procurement toward variable-speed generators that align output with hourly data-center demand.
Key Report Takeaways
- By generator type, DFIG platforms led with 54.9% wind turbine generator market share in 2025, while High-Temperature Superconducting designs are forecast to post a 15.6% CAGR to 2031.
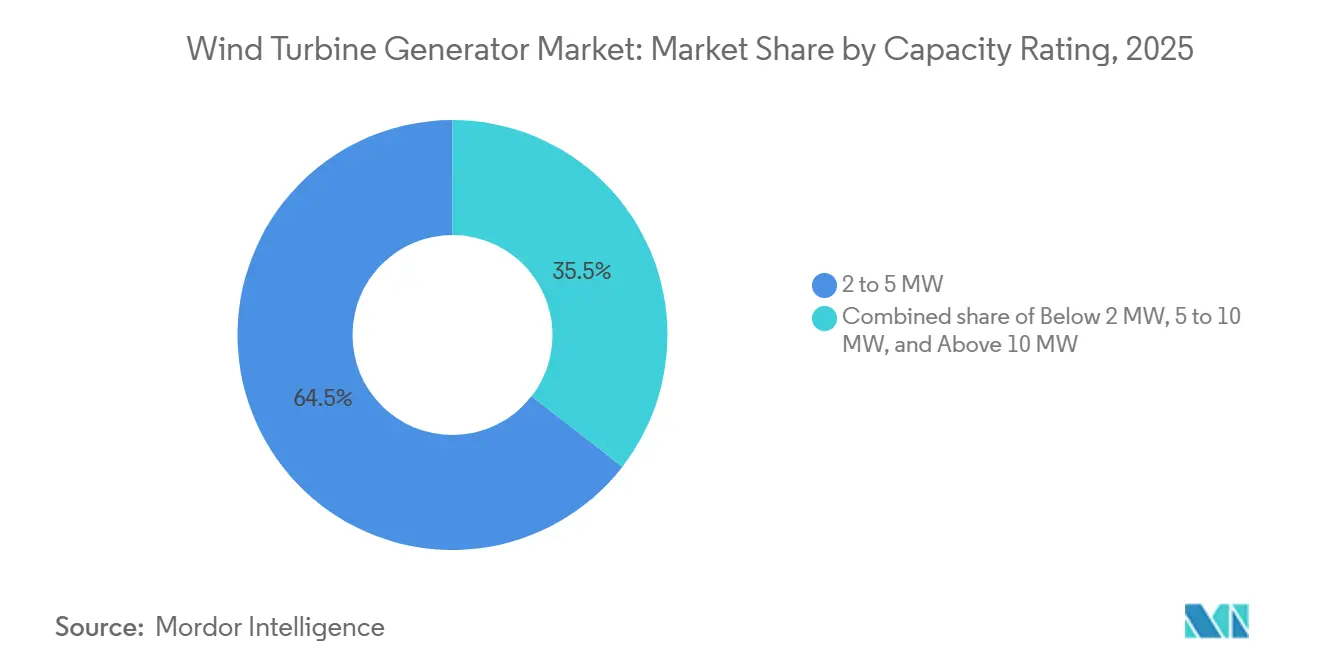
- By capacity rating, the 2 to 5 MW band commanded 64.5% of the wind turbine generator market size in 2025 and the 5 to 10 MW segment is projected to expand at a 12.0% CAGR between 2026-2031.
- By application, onshore builds accounted for 72.0% of 2025 installations; floating-offshore projects are advancing at a 17.5% CAGR through 2031.
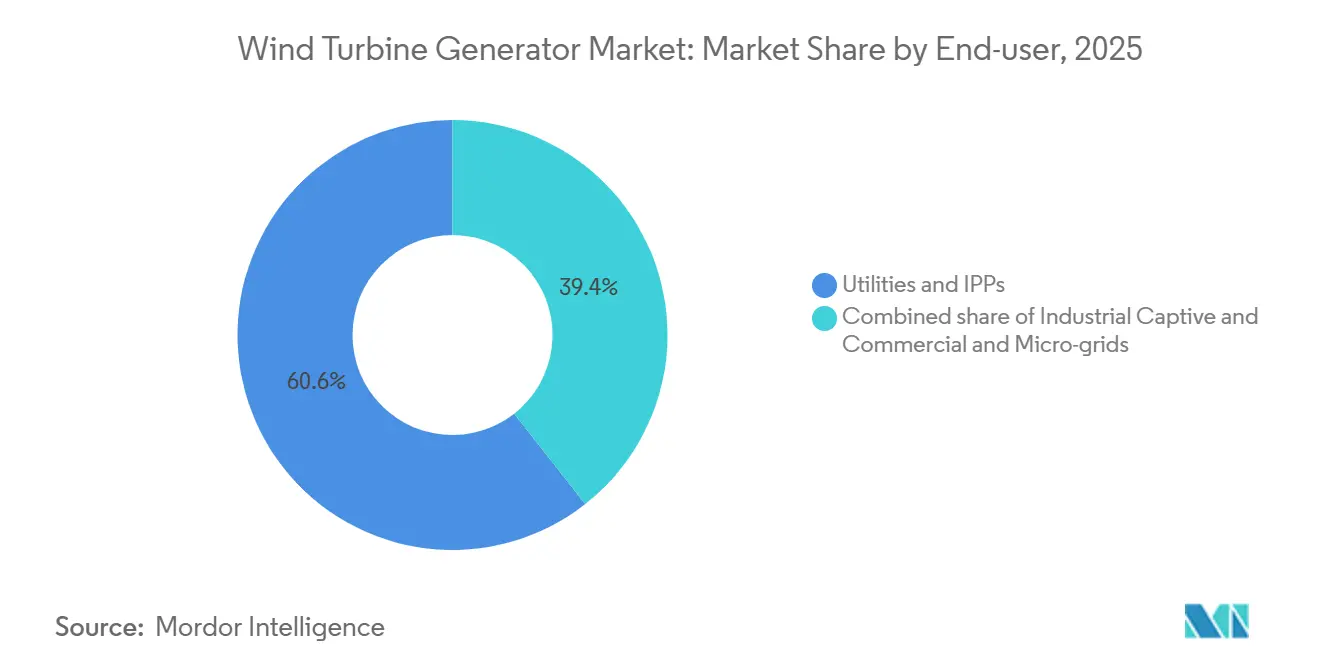
- By end-user, utilities and independent power producers held 60.6% of 2025 demand, while commercial micro-grids are set to grow at 12.8% CAGR to 2031.
- By geography, Asia-Pacific led with 42.8% revenue share in 2025 and is expected to maintain a 9.7% CAGR through 2031.
Note: Market size and forecast figures in this report are generated using Mordor Intelligence’s proprietary estimation framework, updated with the latest available data and insights as of January 2026.
Global Wind Turbine Generator Market Trends and Insights
Drivers Impact Analysis*
| Driver | (~) % Impact on CAGR Forecast | Geographic Relevance | Impact Timeline |
|---|---|---|---|
| Rapid cost reductions in PMSG technology | +1.8% | Global, with early adoption in Europe & China | Medium term (2-4 years) |
| Offshore wind targets boosting high-capacity direct-drive demand | +2.1% | Europe, Asia-Pacific (China, Taiwan, Japan), emerging in North America | Long term (≥ 4 years) |
| Grid-code revisions mandating advanced variable-speed generators | +1.3% | Europe (Ireland, Turkey, Germany), North America, Asia-Pacific | Short term (≤ 2 years) |
| Corporate PPAs accelerating utility-scale installations | +1.6% | North America, Europe, expanding to APAC | Medium term (2-4 years) |
| Repowering schemes creating retrofit demand | +1.1% | North America (US), Europe (Germany, Denmark, Spain) | Short term (≤ 2 years) |
| Floating offshore pilots driving lightweight generator designs | +1.4% | Europe (Norway, UK), Asia-Pacific (China, South Korea) | Long term (≥ 4 years) |
| Source: Mordor Intelligence | |||
Rapid Cost Reductions in PMSG Technology
PMSG system prices fell 22% between 2024 and early 2026 as Chinese and European manufacturers optimized magnet circuits and scaled automated winding lines. Secondary rare-earth supply from recycled hard-disk drives added 4,200 tonnes of neodymium in 2025, softening spot prices that had spiked to USD 160 per kilogram a year earlier [1]Financial Times, “Recycled Rare-Earths Steady Magnet Markets,” ft.com. Goldwind and Ming Yang leveraged captive magnet plants to offer PMSG nacelles at USD 210,000 per megawatt, undercutting European quotes by 15% and winning 68% of Asia-Pacific orders in 2025. Modular stators on Siemens Gamesa’s 5. X platform trimmed assembly labor 30%, making direct-drive viable in markets that lack heavy-lift cranes [2]Siemens Gamesa, “5.X Platform Technical Report,” siemensgamesa.com. Longer offshore service intervals now exceeding 18 months favor gearless PMSG machines that avoid costly jack-up interventions.
Offshore Wind Targets Boosting Direct-Drive Demand
The European Union installed 22.5 GW offshore in 2025, with 78% using direct-drive PMSGs rated above 12 MW to meet two-year maintenance windows [3]European Wind Energy Association, “EU Offshore Installations 2025,” ewea.org. China field-tested 17 MW and 20 MW prototypes that retired gearbox failure modes responsible for one-third of offshore downtime. Vestas booked 4.2 GW of V236-15 MW orders that achieved 94% capacity factors in North Sea pilots, eight points above comparable DFIG fleets. Hywind Tampen capped nacelle mass at 120 tonnes, a threshold met by compact PMSG units with segmented ironless rotors. New IEC 61400-3-2 floating rules reinforce preference for direct-drive models with fewer rotating parts and lower torsional resonance risk.
Grid-Code Revisions Requiring Variable-Speed Operation
Ireland now requires turbines to ride through 0.15 per-unit voltage dips for 625 milliseconds, pushing developers toward full-converter PMSG or advanced DFIG systems [4]EirGrid, “Ireland Grid Code Version 5.0,” eirgrid.com. Turkey applied similar low- and high-voltage ride-through rules in mid-2025, adding USD 45,000 per megawatt in extra power electronics. Germany capped ramp rates at 10% of rated power per minute, which variable-speed platforms satisfy through precise inverter control. Spanish plants equipped with these generators captured 92% of new grid slots in 2025 compared with 61% for fixed-speed units. Alignment with ISO 50001 energy-management goals further cements utility preference for variable-speed models.
Corporate PPAs Driving Utility-Scale Rollouts
Corporate PPAs exceeded 215 GW of turbine orders in 2025, and buyers now demand variable-speed machines that can firm power to sub-hourly schedules. RWE signed a 1.5 GW deal with a European data-center operator, selecting DFIG turbines able to modulate ±5% of forecast output and cut balancing costs. Iberdrola insisted on real-time SCADA links, a feature that embedded PMSG inverters provide at lower integration cost. Clearway favored 5 MW-plus machines that compress land footprints and tenant payments. Predictive analytics warranties covering 25 years have become standard in 68% of signed corporate contracts.
Restraints Impact Analysis*
| Restraint | (~) % Impact on CAGR Forecast | Geographic Relevance | Impact Timeline |
|---|---|---|---|
| Rare-earth supply volatility inflating PMSG costs | -1.4% | Global, acute in Europe & North America dependent on imports | Medium term (2-4 years) |
| Transmission interconnection delays | -2.2% | North America (US, Canada), emerging in India & Brazil | Long term (≥ 4 years) |
| Crane weight limits restricting large onshore units | -0.8% | North America, Europe (mature markets with infrastructure constraints) | Short term (≤ 2 years) |
| Insurance premium hikes from bearing-failure risk in typhoon zones | -0.6% | Asia-Pacific (Taiwan, Japan, Philippines, Vietnam) | Short term (≤ 2 years) |
| Source: Mordor Intelligence | |||
Rare-Earth Supply Volatility Inflating PMSG Costs
Neodymium prices climbed to USD 160 per kilogram in early 2025 after export curbs on Chinese magnet alloys, boosting PMSG bills of material by USD 80,000 per megawatt. Europe and North America rely on imports for more than 90% of rare-earth needs, exposing projects to currency swings and political risk. Recycling added a temporary buffer, yet the secondary supply covered only 12% of global magnet demand last year. Lighter High-Temperature Superconducting generators avoid magnets but remain cost-intensive due to cryogenic systems. Until diversified mines in Australia, Canada, and Tanzania are fully commissioned after 2028, PMSG price uncertainty will pressure tender budgets.
Transmission Interconnection Delays
The United States queue swelled to 2,600 GW in 2024, translating into average waits of 5.2 years and a 3-5 percentage-point hit on project internal rates of return. Regional grid operators withdrew 47 GW of wind capacity in 2025 after upgrade-cost allocations topped USD 200 per kilowatt. India faced an 18 GW backlog in Gujarat and Rajasthan despite fast-track measures, while Brazil missed transmission targets by 4.9 GW in the Northeast region. FERC Order 2023 will trim U.S. study times by 18 months, but legacy applications appear locked into slower processes until at least 2027. Stalled interconnection access pushes developers toward repowering, floating offshore, and captive industrial micro-grids that bypass congested nodes.
*Our forecasts treat driver/restraint impacts as directional, not additive. The impact forecasts reflect baseline growth, mix effects, and variable interactions.
Segment Analysis
By Generator Type: Superconducting Designs Gain Momentum
The wind turbine generator market size for High-Temperature Superconducting (HTS) units is small today, yet it will expand at a 15.6% CAGR through 2031 as floating developers chase nacelle mass below 8 tonnes per megawatt. DFIG systems retained 54.9% market share in 2025 thanks to lower capital cost and extensive service networks. The adoption of Permanent Magnet Synchronous Generators (PMSG) is growing rapidly, especially in offshore turbines with capacities exceeding 12 MW. The removal of the gearbox in these turbines reduces maintenance needs and extends service intervals. Conventional synchronous units satisfy niche grid-forming roles, and switched-reluctance concepts remain pre-commercial.
HTS prototypes like the 3.6 MW EcoSwing generator achieved an 11-tonne-per-megawatt ratio and removed rare-earth magnets, cutting material exposure by USD 65,000 per machine. DFIG upgrades are now needed to meet stricter low-voltage ride-through codes, eroding their cost edge. PMSG direct-drive units dominate the 5-10 MW bracket, where segmented stators allow road-legal transport and on-site assembly. Conventional synchronous machines still equip micro-grids that need black-start capability, but batteries are narrowing that advantage. Switched-reluctance noise issues above 80 decibels limit deployment near communities, delaying broader uptake.
By Capacity Rating: Mid-Range Turbines Prevail as Large Models Advance
The 2 to 5 MW class represented 64.5% of 2025 installations and continues to align with 800-tonne mobile crane limits on most onshore sites. The 5 to 10 MW segment will grow at 12.0% CAGR after 2026 as repowering programs favor fewer units that triple energy output per foundation and cut civil works in half. Machines above 10 MW grabbed 14% of offshore orders last year as developers chase capacity factors beyond 50%.
Jack-up day rates near USD 270,000 incentivize 15 MW units that cut vessel time 40% compared with three smaller turbines. Modular nacelle splits let 7 MW onshore models meet road-weight regulations by trucking six stator sections. Insurance limits in typhoon zones cap coverage at USD 18 million per turbine, which discourages single-unit capacities above 15 MW in East Asia. Sub-2 MW turbines persist where distribution-utility rules cap behind-the-meter wind at 2 MW and where community aesthetics drive demand for lower hub heights.


By Application: Floating-Offshore Installations Accelerate
Onshore applications delivered 72.0% of 2025 generator demand, buoyed by lower balance-of-plant costs. Fixed-bottom offshore wind continues to be the primary deployment model. However, floating offshore wind capacity, while still in the early stages of commercialization, is expected to grow at a CAGR of 17.5% through 2031. New IEC floating standards and deep-water lease auctions in Scotland and South Korea will quintuple the floating pipeline by 2028.
Floating-offshore designs impose tighter dynamic-load envelopes that favor segmented PMSG stators and soon HTS rotors. Onshore machines above 6 MW face transport and crane limits, channeling true mega-wattage growth offshore. Fixed-bottom developers opt for direct-drive gearless platforms to avoid gearbox maintenance that demands jack-up vessels. Distributed onshore schemes in India and Brazil still rely on 3-4 MW units to stay within regional grid caps.
By End-User: Industrial Captives Diversify Procurement
Utilities and independent power producers captured 60.6% of 2025 orders as they bundled multi-GW corporate PPAs with data-center and commodity firms. Industrial captives and commercial micro-grids will expand at 12.8% CAGR through 2031, driven by large steel, cement, and chemical plants seeking carbon-neutral accreditation.
Captive installations hit 4.2 GW in 2025, leveraging accelerated tax depreciation and black-start generator options that restore factory processes within 90 seconds of grid loss. Utilities continue to dominate offshore commitments, since 1 GW-plus projects require billion-dollar balance sheets and deep grid-integration expertise. Micro-grid interconnection caps under 2 MW in many U.S. states force factories to adopt multiple small turbines, sustaining limited demand for sub-2 MW generators despite their higher levelized costs.
Geography Analysis
Asia-Pacific held 42.8% of the 2025 wind turbine generator market revenue and is forecast to expand at 9.7% CAGR to 2031. China’s >100 GW annual installation run rate and its prototype 17 MW floating units underpin regional leadership. India added 6.3 GW in 2025 after fast-tracking 9 GW of grid upgrades, though a second-tier backlog in Rajasthan persists. Japan and South Korea now mandate Class T certified turbines to satisfy insurers after typhoon-related bearing failures. Vietnam and the Philippines signed 2.8 GW of contracts in cyclone zones, all specifying PMSGs with real-time condition monitoring.
Europe is installing 22.5 GW offshore under the REPowerEU policy that targets 120 GW by 2030. Germany repowered 680 MW of onshore capacity, tripling megawatt density per site without adding new grid nodes. The United Kingdom’s 10 GW floating offshore leases stipulate nacelle mass below 8 tonnes per megawatt, a criterion that accelerates HTS generator adoption. Nordic interconnectors enable export of surplus offshore power and sustain capacity factors near 94% on fully exposed North Sea arrays. France advanced 3.2 GW of Brittany and Normandy projects that adopt 15 MW direct-drive machines to minimize visual impact.
In North America, the U.S. added 11.2 GW despite the 2,600 GW interconnection queue and is banking on FERC Order 2023 to unlock 38 GW by 2028. Canada closed 2.4 GW of contracts centered in Alberta and Saskatchewan, where 5 MW-plus machines lower service person-hours. Brazil’s 828 MW Dom Inocêncio wind farm and Argentina’s 230 MW Esquina do Vento leveraged 40% capacity factors to win long-dated PPAs. In the Middle East and Africa, Saudi Arabia’s 3 GW mega-farm set a record 1.33 cents per kilowatt-hour tariff and selected 7.7 MW PMSG turbines that withstand desert heat.

Competitive Landscape
The wind turbine generator market remains moderately concentrated. Regional champions Suzlon and Ming Yang retain commanding positions at home through local financing and supply chains. Competitive differentiation pivots on generator mass-to-power ratios: Vestas’ V236-15 MW delivers 7.8 tonnes per megawatt, lighter than Siemens Gamesa’s SG 14-236 DD, enabling cheaper jack-up vessels and faster offshore campaigns.
Chinese disruptors lower PMSG prices 15% below Western quotes by vertically integrating magnet production. GE Vernova embeds low-voltage ride-through to 0.12 per-unit voltage in its Cypress series, surpassing Irish grid standards and winning priority dispatch. After EUR 1.7 billion warranty charges, Siemens Gamesa doubled down on 25-year availability guarantees that now back 68% of corporate PPAs, locking USD 1.8 billion of service revenue and raising client switching costs. Nordex filed 14 patents on field-replaceable stator segments that slash repowering crane expenses 40%, addressing a USD 1.2 billion retrofit market. Only six OEMs held full IEC 61400-3-2 floating certificates in 2025, limiting the pool of qualified suppliers in the 17.5% CAGR segment and reinforcing incumbent moats.
Wind Turbine Generator Industry Leaders
Goldwind
Envision Energy
Ming Yang Smart Energy
Vestas Wind Systems A/S
GE Vernova
- *Disclaimer: Major Players sorted in no particular order

Recent Industry Developments
- March 2025: RWE and Norges Bank Investment Management partnered to develop Nordseecluster and Thor offshore projects, underscoring investor appetite for North Sea wind.
- January 2025: BP agreed to sell its U.S. onshore wind portfolio (1.7 GW) to LS Power, signaling a strategic pivot toward core hydrocarbons.
- November 2024: Acciona Energía purchased two 150 MW Texas farms for USD 202.5 million, expanding its North American footprint beyond 3 GW.
- October 2024: Brookfield Renewable bought a 12.45% stake in four U.K. offshore farms from Ørsted for USD 2.3 billion, its first British offshore entry.


Global Wind Turbine Generator Market Report Scope
A wind turbine generator (WTG) is a renewable energy system that converts wind's kinetic energy into electrical power. It uses rotor blades to capture wind, a drivetrain (with or without a gearbox) to transfer rotational energy, and a generator to produce electricity through electromagnetic induction. The system is supported by a tower and managed by advanced control systems to ensure efficiency and safety, making it an important technology for sustainable, low-carbon power generation.
The Wind Turbine Generator Market is segmented by generator type, capacity rating, application, end-user, and geography. By generator type, the market is segmented into permanent magnet synchronous generators (PMSG), doubly-fed induction generators (DFIG), conventional synchronous generators, conventional induction generators, switched reluctance generators, and high-temperature superconducting (HTS) generators. By capacity rating, the market is segmented into below 2 MW, 2–5 MW, 5–10 MW, and above 10 MW. By application, the market is segmented into onshore, offshore fixed-bottom, and floating offshore installations. By end-user, the market is segmented into utilities and independent power producers (IPPs), industrial captive users, and commercial and micro-grid operators. The report also covers market size and forecasts for the wind turbine generator market across major countries in key regions, including North America, Europe, Asia-Pacific, South America, and the Middle East and Africa (MEA). For each segment, the market sizing and forecasts are provided in terms of value (USD).
| Permanent-Magnet Synchronous Generator (PMSG) |
| Doubly-Fed Induction Generator (DFIG) |
| Conventional Synchronous Generator |
| Conventional Induction Generator |
| Switched Reluctance Generator |
| Below 2 MW |
| 2 to 5 MW |
| 5 to 10 MW |
| Above 10 MW |
| Onshore |
| Offshore (Fixed-bottom) |
| Floating Offshore |
| Utilities and IPPs |
| Industrial Captive |
| Commercial and Micro-grids |
| North America | United States |
| Canada | |
| Mexico | |
| Europe | Germany |
| United Kingdom | |
| France | |
| Italy | |
| NORDIC Countries | |
| Russia | |
| Rest of Europe | |
| Asia-Pacific | China |
| India | |
| Japan | |
| South Korea | |
| ASEAN Countries | |
| Rest of Asia-Pacific | |
| South America | Brazil |
| Argentina | |
| Rest of South America | |
| Middle East and Africa | Saudi Arabia |
| United Arab Emirates | |
| South Africa | |
| Egypt | |
| Rest of Middle East and Africa |
| By Generator Type | Permanent-Magnet Synchronous Generator (PMSG) | |
| Doubly-Fed Induction Generator (DFIG) | ||
| Conventional Synchronous Generator | ||
| Conventional Induction Generator | ||
| Switched Reluctance Generator | ||
| By Capacity Rating | Below 2 MW | |
| 2 to 5 MW | ||
| 5 to 10 MW | ||
| Above 10 MW | ||
| By Application | Onshore | |
| Offshore (Fixed-bottom) | ||
| Floating Offshore | ||
| By End-user | Utilities and IPPs | |
| Industrial Captive | ||
| Commercial and Micro-grids | ||
| By Geography | North America | United States |
| Canada | ||
| Mexico | ||
| Europe | Germany | |
| United Kingdom | ||
| France | ||
| Italy | ||
| NORDIC Countries | ||
| Russia | ||
| Rest of Europe | ||
| Asia-Pacific | China | |
| India | ||
| Japan | ||
| South Korea | ||
| ASEAN Countries | ||
| Rest of Asia-Pacific | ||
| South America | Brazil | |
| Argentina | ||
| Rest of South America | ||
| Middle East and Africa | Saudi Arabia | |
| United Arab Emirates | ||
| South Africa | ||
| Egypt | ||
| Rest of Middle East and Africa | ||


Key Questions Answered in the Report
What is the projected value of the wind turbine generator market by 2031?
The market is forecast to reach USD 36.16 billion by 2031, expanding at a 9.05% CAGR between 2026-2031.
Which generator type holds the largest share today?
Doubly-Fed Induction Generators led with 54.9% market share in 2025, driven by lower upfront costs and established service networks.
Why are Permanent-Magnet Synchronous Generators gaining traction offshore?
PMSG units eliminate gearboxes, reduce maintenance visits, and deliver higher capacity factors, making them ideal for large offshore turbines.
How will floating-offshore projects influence generator design?
Strict mass limits below 8 tonnes per megawatt favor lightweight PMSG and emerging superconducting generators that stabilize floating platforms.
What is the main bottleneck for new wind projects in North America?
Transmission interconnection queues of 2,600 GW push average wait times above five years, delaying procurement and lowering project returns.
Page last updated on:


