Market Overview
| Study Period | 2021 - 2031 |
|---|---|
| Forecast Data Period | 2026 - 2031 |
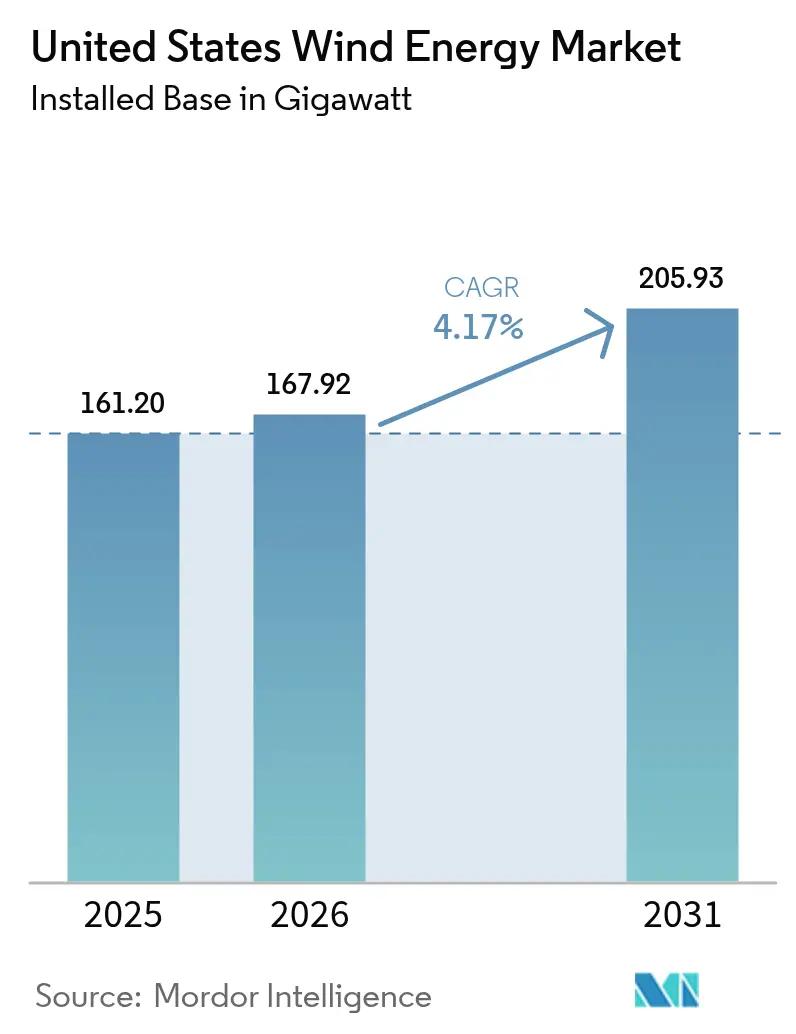
| Base Year Market Size (2025) | 161.20 gigawatt |
| Market Volume (2026) | 167.92 gigawatt |
| Market Volume (2031) | 205.93 gigawatt |
| Growth Rate (2026 - 2031) | 4.17% CAGR |
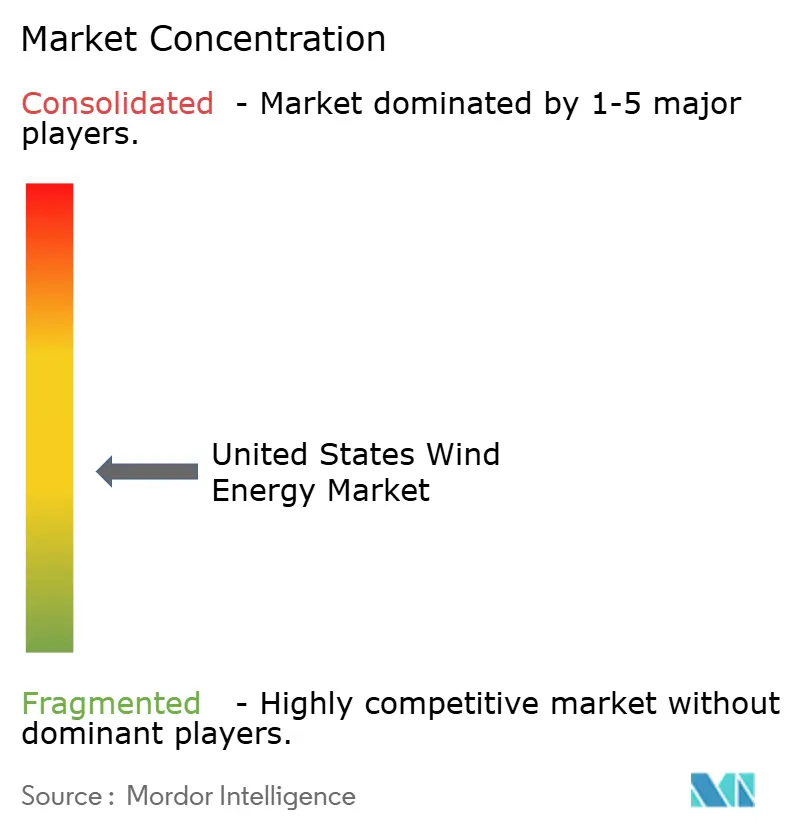
| Market Concentration | Medium |
Major Players *Disclaimer: Major Players sorted in no particular order Image © Mordor Intelligence. Reuse requires attribution under CC BY 4.0. | |
United States Wind Energy Market Analysis by Mordor Intelligence
The United States Wind Energy Market size was valued at 161.20 gigawatt in 2025 and estimated to grow from 167.92 gigawatt in 2026 to reach 205.93 gigawatt by 2031, at a CAGR of 4.17% during the forecast period (2026-2031).
Policy stability under the Inflation Reduction Act (IRA), falling levelized costs from taller turbines, and surging corporate power-purchase agreements are expanding the United States wind energy market despite grid-interconnection bottlenecks. Domestic-content incentives are pulling nacelle, blade, and tower manufacturing back to the Midwest, shortening lead times by four months while raising component costs 8%. Competitive dynamics show utilities and independent power producers consolidating acreage in Texas, the Great Plains, and emerging offshore zones to secure transmission rights before queue reforms tighten. Rising merchant-price volatility in ERCOT and SPP, combined with tax-equity appetite, is sustaining double-digit internal rates of return for projects that can co-locate storage, repower legacy fleets, or qualify for the IRA’s 10-percentage-point bonus credit.
Key Report Takeaways
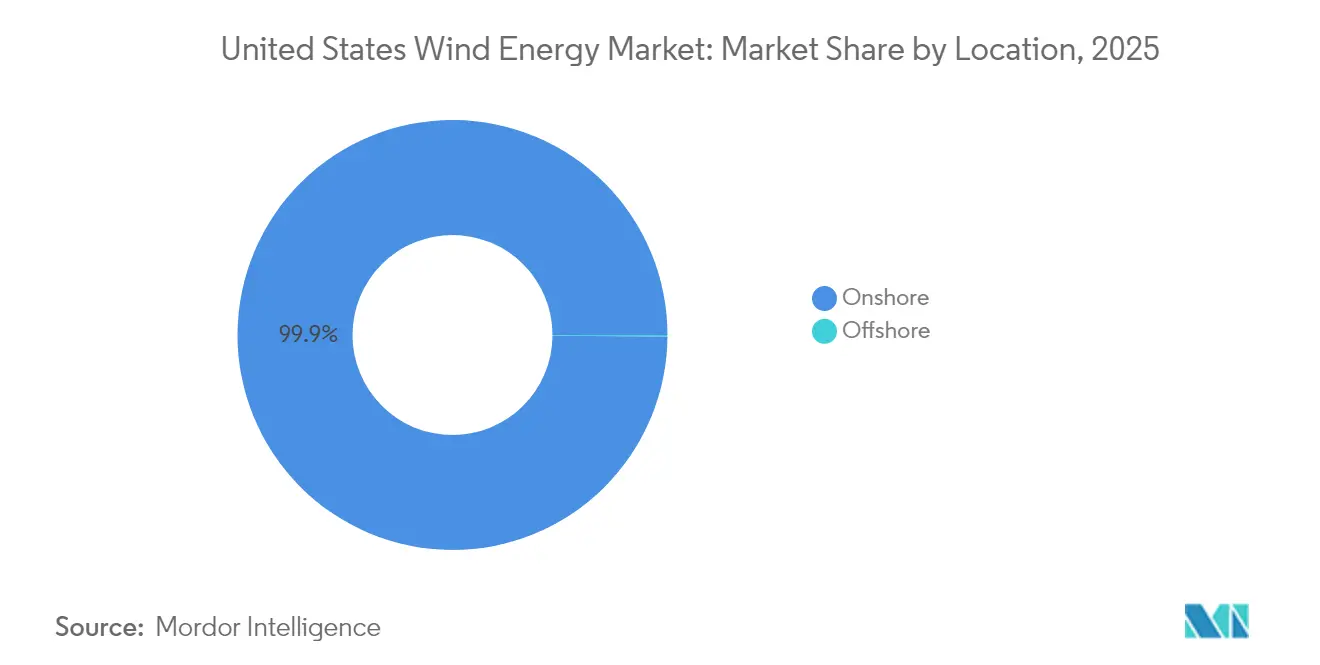
- By location, onshore installations held 99.88% of the United States wind energy market share in 2025, while offshore capacity is forecast to post a 47.69% CAGR through 2031.
- By turbine capacity, the 3–6 MW class captured 61.92% of the United States wind energy market size in 2025; turbines above 6 MW are projected to expand at a 10.48% CAGR to 2031.
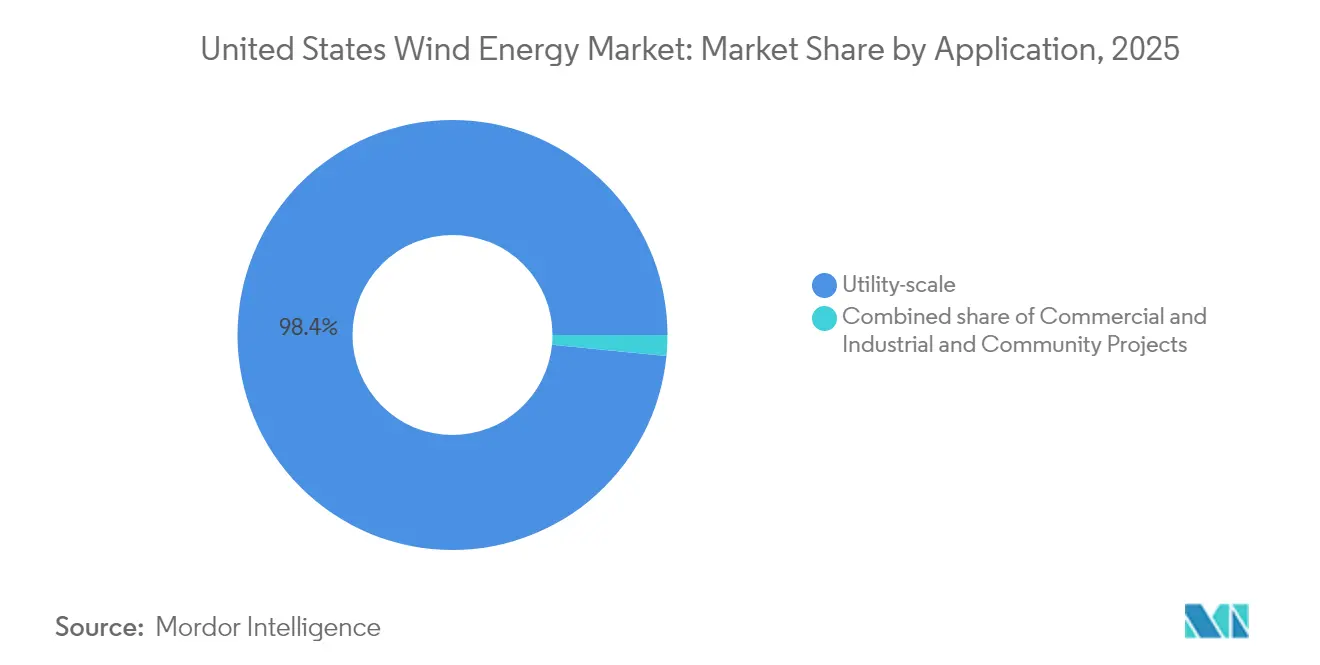
- By application, utility-scale projects accounted for 98.44% of the United States wind energy market share in 2025, whereas commercial-and-industrial behind-the-meter systems are advancing at a 8.92% CAGR through 2031.
- NextEra Energy Resources and Berkshire Hathaway Energy together controlled 35% of operating capacity in 2024, underscoring a moderately concentrated competitive field.
Note: Market size and forecast figures in this report are generated using Mordor Intelligence’s proprietary estimation framework, updated with the latest available data and insights as of 2026.
United States Wind Energy Market Trends and Insights
Drivers Impact Analysis*
| Driver | (~) % Impact on CAGR Forecast | Geographic Relevance | Impact Timeline |
|---|---|---|---|
| IRA tax credits and PTC extensions | +1.8% | National, concentrated in Texas, Iowa, Oklahoma, Kansas | Long term (≥ 4 years) |
| Falling LCOE from taller turbines | +1.2% | Great Plains and Midwest low-wind regions | Medium term (2-4 years) |
| Corporate PPAs momentum | +0.9% | Texas, California, Virginia | Medium term (2-4 years) |
| Repowering aging fleet unlocks capacity | +0.7% | Texas, California, Iowa, Illinois | Short term (≤ 2 years) |
| Green-hydrogen wind demand nexus | +0.5% | Texas Gulf Coast, Pacific Northwest | Long term (≥ 4 years) |
| Domestic-content bonus under IRA | +0.6% | Nationwide | Medium term (2-4 years) |
| Source: Mordor Intelligence | |||
IRA Tax Credits and PTC Extensions
The IRA’s 10-year extension of production tax credits through 2032, plus a 10-percentage-point domestic-content adder, lifted post-tax project returns from 6.5% to 8.2%. Announcements for 18 GW of new capacity entered development pipelines during 2024 after the legislation was passed.[1]U.S. Department of the Treasury, “IRA Clean Energy Guidance,” treasury.gov The law mandates that, by 2025, 40% of steel and 55% of manufactured components originate domestically, steering orders toward Iowa and Colorado factories. Internal Revenue Service audits in late 2024 disqualified 1.2 GW for foreign-origin bearings, spotlighting traceability gaps. Developers in ERCOT now opt for the IRA’s 30% investment tax credit to monetize value upfront when volatile basis risk deters long-term PPAs.
Falling LCOE from Taller Turbines
National Renewable Energy Laboratory data show the onshore LCOE sliding to USD 26 per MWh in 2024 as rotor diameters hit 170 m and hub heights 110 m.[2]National Renewable Energy Laboratory, “Cost and Performance Impacts of Taller Turbines,” nrel.gov GE Vernova and Vestas platforms above 6 MW are harvesting 52% capacity factors at Class 4 sites in Arkansas and Tennessee, regions once uneconomical for wind. Thermoplastic composite blades reduce weight by 12% and cut balance-of-system spending by USD 80,000 per turbine. Cost compression has pushed eight gigawatts of gas-fired generation into early retirement during 2024, a pivotal inflection for the United States wind energy market.
Corporate PPAs Momentum
Corporate PPAs hit 8.2 GW in 2024 as hyperscalers locked 15-year fixed prices to meet Scope 2 targets.[3]American Clean Power Association, “2024 Corporate PPA Tracker,” acp.org Amazon Web Services signed 3.5 GW, including a 1 GW Texas portfolio powering data centers, while Meta secured 800 MW in Oklahoma. Virtual PPAs, now 72% of deals, let buyers claim renewable attributes without physical delivery across congested grids. Deals with investment-grade offtakers closed at USD 28–32 per MWh, versus USD 22 per MWh for merchant projects priced to manage basis risk.
Repowering Aging Fleet Unlocks Capacity
Roughly 25 GW commissioned before 2015 became eligible for repowering in 2024, allowing developers to triple output by swapping 1.5 MW machines for 6 MW units while retaining interconnection rights. NextEra upgraded 1.8 GW in Iowa and Texas, adding 2.4 TWh of annual generation without fresh permitting. Projects reset the 10-year PTC clock by replacing at least 80% of turbine components. Blade‐recycling constraints persist, but Siemens Gamesa’s chemical-recycling pilot recovers 85% of resins, hinting at long-term circular-economy gains.
Restraints Impact Analysis*
| Restraint | (~) % Impact on CAGR Forecast | Geographic Relevance | Impact Timeline |
|---|---|---|---|
| Transmission and interconnection bottlenecks | -1.4% | MISO, SPP, CAISO | Medium term (2-4 years) |
| Rising capex and supply-chain inflation | -1.1% | Nationwide, offshore most acute | Short term (≤ 2 years) |
| Jones Act vessel shortage (offshore) | -0.6% | Atlantic Coast lease areas | Medium term (2-4 years) |
| Wildlife litigation and local opposition | -0.5% | Great Plains, coastal bat habitats | Long term (≥ 4 years) |
| Source: Mordor Intelligence | |||
Transmission and Interconnection Bottlenecks
Regional transmission queues reached 2,600 GW in December 2024, with wind accounting for 950 GW, and average study times stretched to 5.2 years.[4]Federal Energy Regulatory Commission, “2024 Interconnection Queue Assessment,” ferc.gov MISO alone holds 180 GW awaiting USD 48 billion in network upgrades, 60% of which need new 345-kV lines that require seven years to permit. FERC Order 2023 moves to a first-ready, first-served regime, but only CAISO has fully implemented it by mid-2024, so most developers still face serial processing. Disputes over how to share USD 6 billion of transmission costs halted five projects last year.
Rising Capex and Supply-Chain Inflation
Onshore turbine prices rose 18% between 2022 and 2024, hitting USD 1.3 million per MW as steel and rare-earth costs spiked. Offshore capex climbed more sharply to USD 4,100 per kW because Jones Act-compliant vessel day-rates doubled to USD 450,000. OEMs suffered negative EBITDA on U.S. deliveries in 2024 after signing fixed-price contracts when inflation remained muted. Developers renegotiated PPAs upward by USD 4–6 per MWh to recover margins, illustrating the delicate economics underpinning the United States wind energy market.
*Our forecasts treat driver/restraint impacts as directional, not additive. The impact forecasts reflect baseline growth, mix effects, and variable interactions.
Segment Analysis
By Location: Offshore’s Exponential Upswing
Onshore assets dominated 99.88% of cumulative capacity in 2025, reflecting decades of incremental build-out across Texas and the Great Plains, where Class 5–7 wind resources deliver 45–50% capacity factors. However, the Bureau of Ocean Energy Management has auctioned eight lease areas since 2022, setting the stage for a 47.69% CAGR in offshore capacity that will reshape the United States wind energy market. Vineyard Wind 1 began commercial operation in May 2024 with 13 MW turbines sustaining 60% capacity factors, demonstrating offshore competitiveness. The onshore build cycle continues in Texas and Oklahoma, which added 5 GW combined in 2024 because ERCOT’s merchant model still clears projects within 18 months.
Jones Act constraints limit offshore build-out to about 2 GW per year through 2026, yet project pipelines total 30 GW. Dominion Energy’s 2.6 GW Coastal Virginia venture secured the first U.S.-built installation vessel, but day-rates above USD 500,000 lift capex 12% versus European analogs. Repowering older onshore sites provides a parallel growth lever: NextEra’s 1.8 GW Iowa campaign tripled site output without new interconnection filings. Floating offshore concepts for California’s 25 GW resource remain in pre-commercial testing as mooring systems presently cost USD 1 million per MW, a hurdle unlikely to fall before 2028.


By Turbine Capacity: Rise of the 6 MW-Plus Class
Turbines in the 3–6 MW range supplied 61.92% of installed capacity in 2025, underpinning the latest generation of utility-scale projects and anchoring the current United States wind energy market size at ground-level economics. Above-6 MW machines featuring 170 m rotors and 110 m hubs are forecast to grow 10.48% CAGR as developers target Class 4 wind sites across the Southeast. GE Vernova’s 6.2 MW Cypress platform, deployed across 2.4 GW in 2024, cut LCOE USD 6 per MWh and secured PPAs below USD 30 per MWh, evidence of size-driven cost efficiency.
Sub-3 MW assets, once dominant in California and Iowa, have become prime repowering candidates. At least 25 GW installed before 2015 can triple output by upgrading to current platforms while recycling interconnection rights. Blade manufacturing capacity is a gating factor for above-6 MW scale-up, with only two U.S. plants capable of producing 85-m blades. Offshore projects will jump directly to 13-15 MW turbines after 2026, pushing monopile and jacket foundations over USD 8 million each. While risk-averse ERCOT developers stick to proven 3–6 MW machines, larger platforms are unavoidable for the next cost-down cycle in the United States wind energy market.
By Application: Utility Scale Versus C&I Disruption
Utility-scale projects delivered 98.44% of installed capacity in 2025 by leveraging economies of scale to achieve USD 26 per MWh LCOE. C&I behind-the-meter assets represented only 1.17% but are growing 8.92% CAGR as virtual PPAs let corporations hedge power costs independent of physical delivery. Hyperscalers such as Amazon, Meta, and Microsoft continue to dominate procurement, prioritizing multi-gigawatt portfolios that leverage grid-scale economics.
Community wind installations of under 20 MW account for just 0.39% of capacity, clustered in Minnesota and Iowa, where state credits help bridge higher per-MW capex. Industrial facilities with 10 MW plus loads in Texas and California increasingly see wind as an on-site option that shortens payback to under seven years with ITC support. Queue congestion is nudging developers toward distribution-level interconnections where local voltage allows capacity additions without the five-year studies that bedevil bulk-system projects. Collectively, these shifts signal an incremental but important diffusion of demand-side participation in the United States wind energy market.
Geography Analysis
Texas, Iowa, and Oklahoma supplied 51.62% of cumulative capacity in 2025, leveraging Class 5–7 wind resources and merchant-market structures that capture scarcity pricing spikes, such as the USD 9,000 per MWh realized in February 2024. The Great Plains corridor harbors 35% of the technical potential, yet it added just 17.6% of the 2025 capacity because SPP’s 40 GW queue backlog delays projects beyond 2027. Offshore wind along the Atlantic Coast is a rising force, with New York Bight and Massachusetts leases funneling 30 GW into the pipeline and Vineyard Wind 1 proving Atlantic performance with 60% capacity factors.
Turbine scaling to 170 m rotors unlocked Class 4 sites in Arkansas and Tennessee, where PPAs closed below USD 30 per MWh in 2024. California’s floating-wind ambition remains aspirational pending cost compression in mooring technology. In the Midwest, repowering across Iowa and Illinois is adding near-term volume, as legacy 1.5 MW machines receive 6 MW replacements that triple output without new land leases. Policy asymmetry further shapes deployment: Texas permits projects within 18 months, while New York’s Article 10 process can take four years, tilting investor capital offshore.
Washington and Oregon added only 400 MW in 2024 because Bonneville Power Administration’s hydropower-heavy grid diminishes wind’s marginal value during spring runoff. Wyoming and Montana hold significant untapped potential but must secure Bureau of Land Management approvals and interregional transmission to reach distant load centers. MISO’s USD 18 billion long-range plan aims to unlock 25 GW of Dakotas and Minnesota output by 2028, though cost allocation remains contested among member states.
Regulatory Landscape
Federal policy remains a key market shaper, led by the Inflation Reduction Act (IRA) framework of long-dated tax credits and adders that reward domestic sourcing and project eligibility discipline. Grid market access is also governed by Federal Energy Regulatory Commission (FERC) processes, including market-based rate authorizations and periodic market power reviews, which developers need to maintain through filings such as revised tariffs and triennial analyses during 2026.
Offshore wind development falls under the U.S. Department of the Interior framework led by the Bureau of Ocean Energy Management (BOEM), with regulatory amendments finalized in 2024 to refine design, installation verification, and auction mechanics. For smaller and distributed wind systems, the U.S. Department of Energy (DOE) Office of Energy Efficiency and Renewable Energy provides conformity-focused guidance through its Distributed Wind Certification Best Practices Guideline, and DOE 2026 funding priorities include qualification, certification, and recycling of wind turbine materials to address compliance and end-of-life constraints.
Competitive Landscape
The United States wind energy market shows moderate concentration: the top five developers controlled 42% of operating capacity in 2024, while more than 200 smaller entities shared the remainder. NextEra Energy Resources and Berkshire Hathaway Energy together held 35%, aided by investment-grade balance sheets that let them retain tax credits rather than syndicate equity. Invenergy’s Samson hybrid in Texas paired 800 MW of wind with 250 MW of batteries and earned USD 18 per MWh from ancillary services, illustrating how storage can enhance value capture under nodal pricing.
OEM competition intensified as Vestas, GE Vernova, and Siemens Gamesa delivered turbines at negative EBITDA due to fixed-price contracts signed before materials inflation. Each firm now differentiates with warranty terms rather than headline pricing. The offshore segment imports European expertise: Ørsted, Equinor, and Iberdrola dominate lease holdings but face Jones Act vessel shortages that eroded first-mover advantage. White-space opportunities lie in repowering 25 GW of pre-2015 capacity and in the emerging green-hydrogen nexus that monetizes curtailed energy via electrolyzers.
Domestic-content rules under the IRA are reshaping supply chains. Orders flow to TPI Composites and Vestas’ U.S. factories, shrinking lead times to 14 months but nudging component costs 8% higher. Yieldcos and infrastructure funds eager for stable cash flows continue to acquire derisked projects, exemplified by Clearway Energy’s USD 420 million purchase of 300 MW in Iowa during February 2024. Overall, the competitive field rewards players that can manage basis risk, comply with domestic-content audits, and integrate storage or hydrogen to diversify revenue streams across the United States wind energy market.
United States Wind Energy Industry Leaders
NextEra Energy Resources
Berkshire Hathaway Energy (MidAmerican/PPM)
Invenergy LLC
Avangrid Renewables
Ørsted North America
- *Disclaimer: Major Players sorted in no particular order

Market Opportunities and Future Outlook
Transmission-enabled buildout and congestion relief remain the most visible opportunity for scaling wind in high-resource regions, supported by delivery projects that directly address curtailment and interconnection friction. Pattern Energy announcing full operations of the SunZia wind and HVDC transmission project in June 2026 offers a concrete template for moving bulk wind output from the interior West/Southwest to major load, and it also underscores the investment case for pairing generation with dedicated long-distance transmission or securing firm interconnection positions in constrained RTO footprints.
Corporate procurement and hybridization broaden monetization pathways beyond traditional utility offtake. NextEra Energy Resources disclosing roughly 2.5 GW of clean energy contracts with Meta in December 2025 highlights hyperscaler demand and the role of multi-asset contracting, including storage, in firming delivery and managing price and basis risk. Repowering also remains a near-term lever to add energy and capacity using existing sites and grid rights, consistent with owner-operator capital plans such as Berkshire Hathaway Energy outlining wind repowering spend over 2026-2028, while offshore opportunity continues to be shaped by BOEM processes and evolving federal policy signals that influence leasing cadence and project timelines.
Recent Industry Developments
- June 2026: Pattern Energy announced the SunZia project is fully operational, combining a 3,650 MW wind facility with a 550-mile HVDC transmission line. The milestone supports the investment case for pairing large wind builds with dedicated transmission to bypass regional congestion and deliver power to distant load centers.
- December 2025: NextEra Energy Resources reported reaching about 2.5 GW of clean energy contracts with Meta Platforms through 11 power purchase agreements and two energy storage agreements. The multi-project portfolio structure highlights hyperscaler-driven offtake as a bankability anchor and supports hybrid wind-plus-storage contracting strategies.
- May 2024: Vineyard Wind 1 began commercial operations, establishing one of the earliest large-scale U.S. offshore wind projects in operation. The start-up provides operational reference data for 13 MW-class turbines and adds momentum to the U.S. offshore supply chain and permitting playbooks.


Research Methodology Framework and Report Scope
Market Definition and Coverage
For this study, the market is defined as wind power capacity installed in the United States, counted in gigawatts (GW), and tied to projects that have reached commissioning.
Scope exclusions: Off-grid micro wind and non-electric mechanical wind applications are excluded where they are not connected to measurable power generation capacity.
Segmentation Overview
- By Location
- Onshore
- Offshore
- By Turbine Capacity
- Up to 3 MW
- 3 to 6 MW
- Above 6 MW
- By Application
- Utility-scale
- Commercial and Industrial
- Community Projects
- By Component (Qualitative Analysis)
- Nacelle/Turbine
- Blade
- Tower
- Generator and Gearbox
- Balance-of-System
Data Sources, Market Sizing, and Validation
Desk Research
We started with public, non-paywalled datasets that describe how much wind is being built and operated in the country, and how this changes over time. Key reference points typically include sources such as the U.S. Energy Information Administration, U.S. Department of Energy wind market reports, Federal Energy Regulatory Commission filings, and U.S. Census and trade statistics for relevant equipment flows.
To make the data usable in a single model, the published series were normalized into a consistent time view (calendar year, units, and commissioning conventions), and then checked for gaps around project timing. Company filings, investor presentations, reputable press coverage, and association websites were used to understand build plans, typical turbine sizing in recent projects, and the pace of grid interconnection. Where public disclosures were limited, we also used paid subscriptions for company financials and intelligence, plus an import and export shipment-level database to cross-check equipment movements. These examples are not exhaustive, and additional sources were reviewed to collect data, validate assumptions, and clarify open points.
Primary Interviews and Surveys
Our interviews and surveys focused on developers, asset owners, EPC and O&M participants, component suppliers, and grid and permitting stakeholders, since each group sees a different part of the build cycle. These discussions helped confirm commissioning timing, typical turbine ratings used in recent projects, the split of activity by application, and how near-term pipeline converts into installed capacity under realistic constraints.
Distribution of primary research fieldwork respondents
| Company type | Respondent position | Region |
|---|---|---|
| Top tier: 35% | CXOs: 13% | |
| Mid tier: 46% | Functional/Unit leaders: 31% | |
| Smaller Players: 19% | Managers: 56% |
Market-Sizing & Forecasting
The core sizing logic uses a top-down approach where national installed capacity is reconstructed from commissioning and retirement signals, and then distributed across the market boundary used in the report. We corroborate totals with selective bottom-up approximations, such as sampled project pipelines multiplied by typical turbine rating ranges and expected commissioning conversion, followed by channel checks on component availability.
Inputs used in the model include annual and cumulative installed wind capacity, new capacity additions, expected retirements and repowering activity, average turbine nameplate ratings by recent build vintages, and the onshore versus offshore split where applicable. Application cues, such as utility-scale versus other project types, are treated as a validation layer so the totals stay aligned with how capacity is actually deployed.
For forecasting, scenario analysis is used because the near-term outcome depends heavily on permitting pace, interconnection queue clearing, and policy timing that can shift from year to year. When a data point is missing at a detailed level, we fill it using conservative ranges anchored to recent project outcomes, and then the final totals are adjusted only after checks are consistent across sources.
Data Validation & Update Cycle
We validate the outputs by comparing the model results against independent signals, including government capacity series, reported annual additions, and credible pipeline indicators, and then we re-check any large year-to-year jumps. If a variance is not explainable by a clear driver like commissioning delays or retirements, the assumptions are reviewed again and follow-up calls are triggered to resolve the mismatch.
Before sign-off, the model goes through multi-step analyst reviews so the final numbers remain traceable to inputs and calculation steps. Reports refresh annually, and interim updates are made when material events occur, such as major policy changes or project cancellations. Right before delivery, a fresh pass is completed so clients receive the latest updated view.
Mordor Intelligence's United States Wind Energy Market Sizing Compared With Other Published Estimates
Published market sizes for US wind often do not line up, even when the topic name looks the same, because the measurement unit and what is being counted can change the total quickly. Differences also come from how project timing is treated, and whether the number is capacity already installed or spending and revenue tied to equipment and services.
Evidence like DOE land-based wind additions and cumulative capacity checks helps keep Mordor Intelligence's estimate anchored to commissioning-based installed capacity in GW, instead of mixing it with project spending, equipment sales value, or broader renewables totals.
Benchmark comparison
| Source | Market Size | Gaps in Research Methodology |
|---|---|---|
| Mordor Intelligence | USD 161.20 B (2025) | |
| Industry Research Publisher A | USD 18.20 B (2024) | Uses a value-based definition for wind power (USD), which can reflect equipment and service revenues rather than installed capacity, and it can also vary with pricing assumptions and project spend timing. |
| Industry Association B | USD 10.80 B (2023) | Reports annual investment for land-based wind expansion in a single year, which is an activity and spending measure and not the same as the cumulative installed capacity level used in capacity-based sizing. |
In simple terms, the spread is mainly explained by unit choice and boundary, since capacity in GW, market value in USD, and yearly investment are all real but they answer different questions. By keeping the scope tied to commissioning and installed capacity, and then checking it against public capacity series and expert project timing input, the final number stays repeatable and easier to reconcile across updates.


Key Questions Answered in the Report
How large is the United States wind energy market today?
Installed capacity reached 167.92 GW in 2026 and is forecast to climb to 205.93 GW by 2031.
What CAGR is expected for U.S. wind additions through 2031?
Capacity is projected to expand at a 4.17% CAGR from 2026 to 2031.
Which segment will grow fastest within U.S. wind?
Offshore projects are forecast to register a 47.69% CAGR through 2031 as lease areas mature.
Why are taller turbines important for new projects?
Rotor diameters around 170 m and hub heights near 110 m push capacity factors above 50% at Class 4 sites, driving LCOE down to USD 26 per MWh.
What is the biggest constraint facing new wind capacity?
Transmission interconnection backlogs average 5.2 years, delaying nearly 40% of proposed megawatts beyond 2027.
Who leads the U.S. wind sector?
NextEra Energy Resources is the largest owner-operator, with Berkshire Hathaway Energy close behind; together they manage 35% of operational capacity.
Page last updated on:


