Market Overview
| Study Period | 2021 - 2031 |
|---|---|
| Forecast Data Period | 2026 - 2031 |
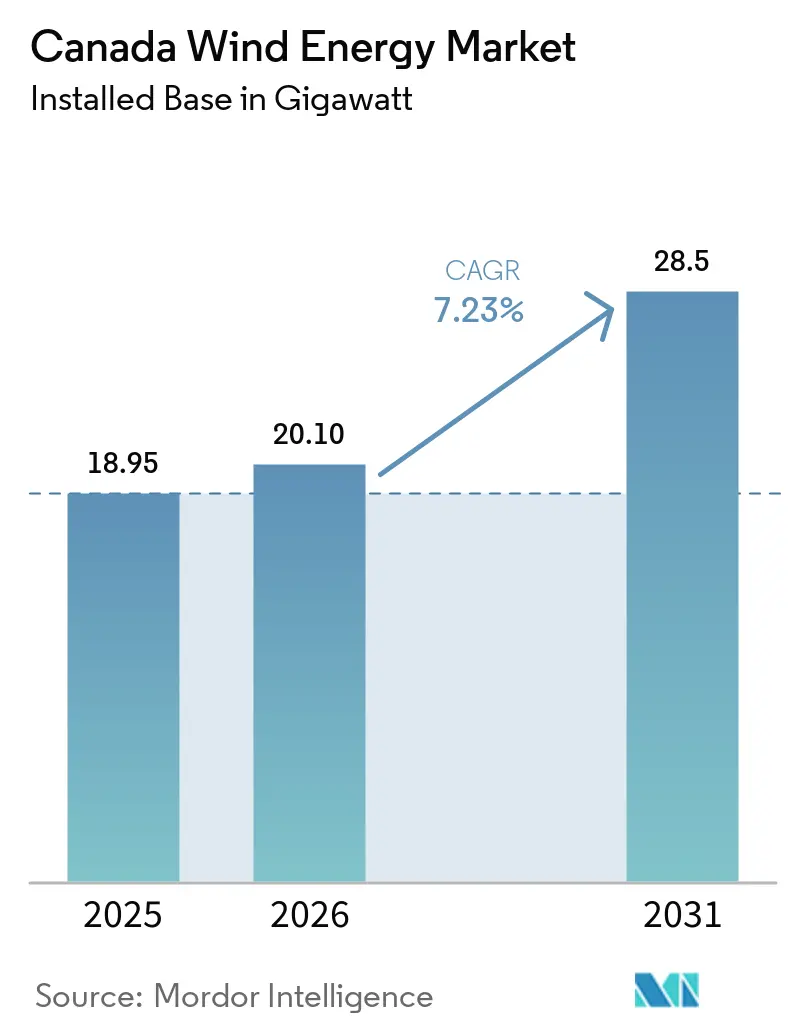
| Base Year Market Size (2025) | 18.95 gigawatt |
| Market Volume (2026) | 20.10 gigawatt |
| Market Volume (2031) | 28.5 gigawatt |
| Growth Rate (2026 - 2031) | 7.23% CAGR |
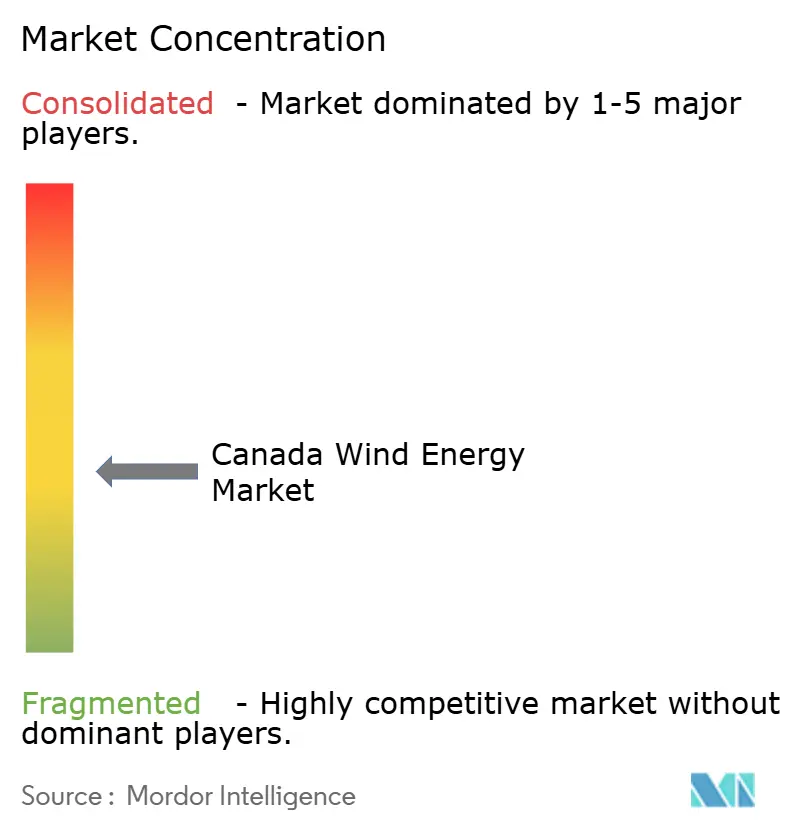
| Market Concentration | Medium |
Major Players *Disclaimer: Major Players sorted in no particular order Image © Mordor Intelligence. Reuse requires attribution under CC BY 4.0. | |
Canada Wind Energy Market Analysis by Mordor Intelligence
The Canada Wind Energy Market size in terms of installed base is expected to increase from 18.95 gigawatt in 2025 to 20.10 gigawatt in 2026 and reach 28.5 gigawatt by 2031, growing at a CAGR of 7.23% over 2026-2031.
Policy support rather than spot-price signals now anchors growth, as the Clean Technology Investment Tax Credit and the Clean Electricity Investment Tax Credit trim the weighted-average cost of capital by 150–200 basis points, tilting project economics in favor of wind even in provinces that lack explicit carbon pricing. Merchant-exposed assets in Alberta are gradually ceding momentum to contract-backed builds in Ontario and Atlantic Canada, where procurement auctions and feed-in tariffs offer bankable revenue certainty. Rising hub heights, modular blades, and repowering of pre-2010 fleets combine to push the levelized cost of wind energy below USD 44 per MWh in the windiest zones, undercutting new gas peakers on an unsubsidized basis. Grid-expansion plans, Indigenous equity frameworks, and early-stage green-hydrogen ventures round out a landscape where scale developers dominate utility-size projects while community sponsors accelerate smaller builds that mesh with local land-use priorities.
Key Report Takeaways
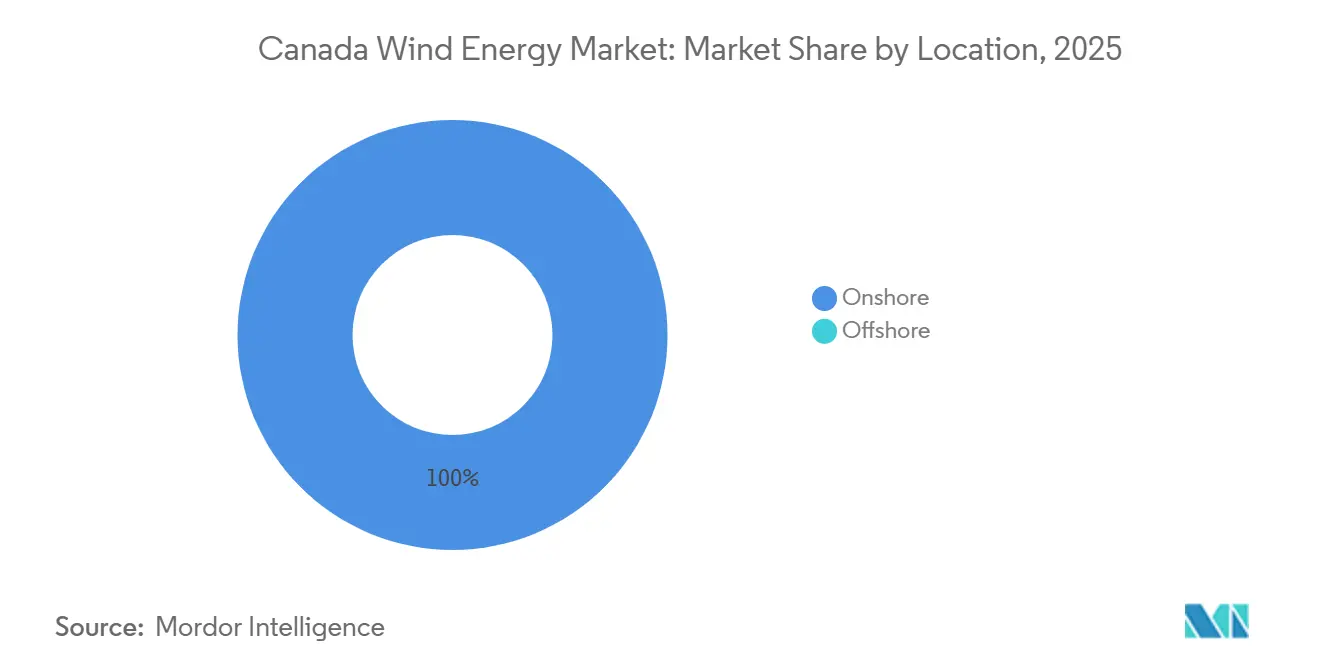
- By location, onshore installations captured 100% of the Canadian wind energy market share in 2025, while offshore wind is expected to grow at 7.2% CAGR through 2031.
- By turbine rating, 3–6 MW platforms commanded 67.7% of the Canada wind energy market size in 2025; turbines above 6 MW are projected to expand at an 11.9% CAGR as repowering accelerates.
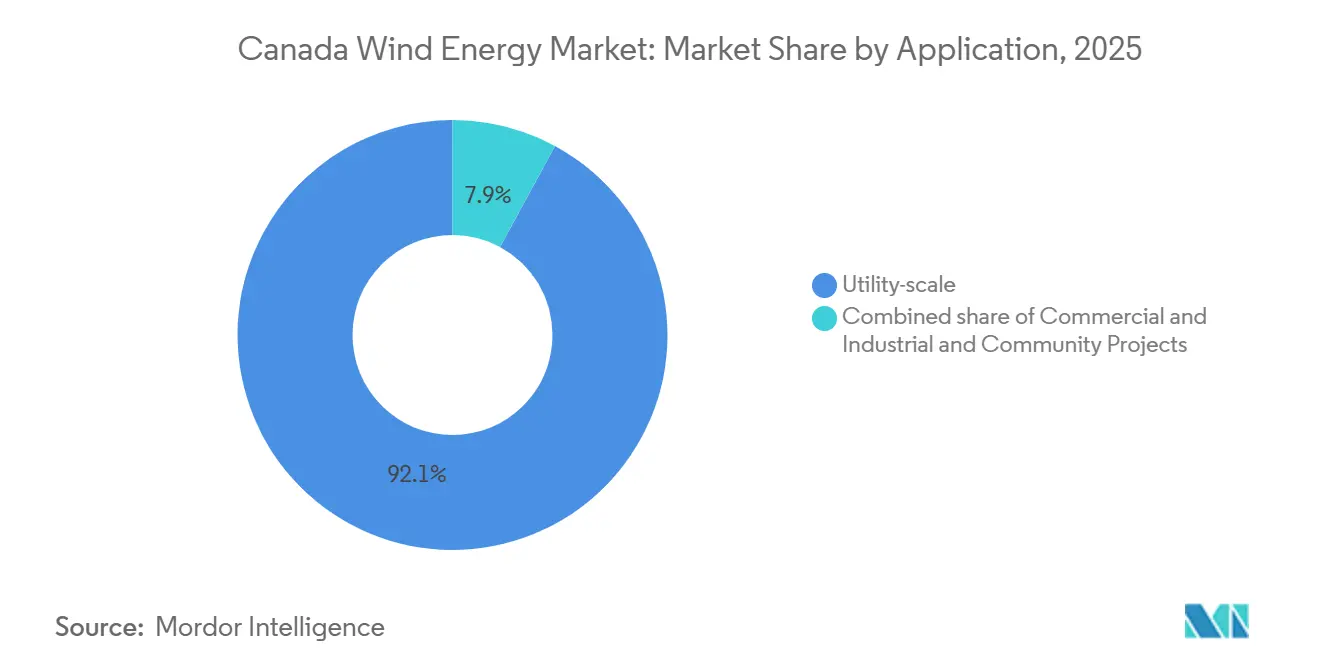
- By application, utility-scale assets accounted for 92.1% of capacity in 2025, but community projects are expected to grow at a 12.5% CAGR through 2031 on the back of federal loan guarantees and Indigenous ownership models.
Note: Market size and forecast figures in this report are generated using Mordor Intelligence’s proprietary estimation framework, updated with the latest available data and insights as of 2026.
Canada Wind Energy Market Trends and Insights
Drivers Impact Analysis*
| Driver | (~) % Impact on CAGR Forecast | Geographic Relevance | Impact Timeline |
|---|---|---|---|
| Federal investment tax incentives & Clean Electricity Regulations | +2.1% | National, with concentration in Ontario, Quebec, Atlantic provinces | Medium term (2-4 years) |
| Declining levelized cost of wind energy | +1.3% | National, strongest in high-capacity-factor zones (Alberta, Saskatchewan) | Long term (≥ 4 years) |
| Surge in corporate PPAs for renewable power | +0.9% | Nova Scotia, Ontario; emerging in British Columbia | Short term (≤ 2 years) |
| Indigenous-led wind project pipelines | +0.7% | Saskatchewan, Manitoba, northern Ontario | Medium term (2-4 years) |
| Green-hydrogen-linked wind projects in Atlantic Canada | +0.6% | Newfoundland, Nova Scotia | Long term (≥ 4 years) |
| Repowering of ageing Alberta wind farms | +0.5% | Alberta, with spillover to Saskatchewan | Short term (≤ 2 years) |
| Source: Mordor Intelligence | |||
Federal Investment Tax Incentives & Clean Electricity Regulations
Canada’s dual-credit architecture allows qualified wind developers to stack a 30% Clean Technology Investment Tax Credit on top of a 15% Clean Electricity Investment Tax Credit. Projects that satisfy prevailing-wage rules and achieve 50% domestic content by 2027 effectively write off up to 40% of eligible capital, mirroring, but tightening, the incentives offered under the U.S. Inflation Reduction Act. The Clean Electricity Regulations further require any post-2035 generation asset to emit fewer than 30 tCO₂ per GWh, steering USD 29.6 billion of utility investment toward zero-carbon technologies, with wind the prime beneficiary.[1]Environment and Climate Change Canada, “Clean Electricity Regulations,” ECCC.GC.CA Ontario’s Long-Term 2 request for proposals illustrates the impact: 1.2 GW of wind contracts cleared in late 2025 at USD 63 per MWh, 20% under the province’s avoided-cost benchmark.
Declining Levelized Cost of Wind Energy
Natural Resources Canada reports that unsubsidized LCOE for high-resource sites dropped to USD 44 per MWh in 2025, 35% lower than in 2020. The savings flow from turbine upsizing, higher net capacity factors, and supply-chain consolidation that cut nacelle costs by 18%. Alberta and Saskatchewan reap disproportionate benefits: 120-meter hub heights routinely yield 42% net capacity factors and 25 GWh of annual output per turbine.[2]Canadian Wind Energy Association, “Wind Facts 2025,” CANWEA.CA Repowering amplifies these gains; TransAlta’s Summerview swap lifted annual energy from 450 GWh to 520 GWh while trimming O&M to USD 9 per MWh.
Surge in Corporate PPAs for Renewable Power
Standardized PPA templates now cap basis risk and restore corporate appetite for long-dated wind offtake. Nova Scotia Power executed 400 MW of agreements in 2025 with Amazon Web Services and Microsoft under 15-year indexed contracts. Ontario’s Competitive PPA framework lets users above 5 MW peak demand bypass the wholesale pool; early adopters locked in 20-year wind PPAs at USD 52 per MWh, well below the USD 69 per MWh retail rate expected by 2030. Lenders responded by relaxing debt-service coverage ratios to 1.25:1 on fully contracted projects.
Indigenous-Led Wind Project Pipelines
Federal loan guarantees covering up to 80% of project debt enable First Nations to secure the majority of cash-flow rights without bearing traditional equity burdens. Saskatchewan’s Seven Stars Energy project, majority-owned by the Cowessess First Nation, closed in 2025 with only a USD 30 million equity outlay on a USD 296 million capital stack. Faster consultation shortens approval; the Maskwacis Wind farm in Alberta reached commercial operation 18 months after filing, half the national average.
Restraints Impact Analysis*
| Restraint | (~) % Impact on CAGR Forecast | Geographic Relevance | Impact Timeline |
|---|---|---|---|
| Grid congestion & curtailment risk in Alberta/Ontario | -0.8% | Alberta (primary), Ontario (secondary) | Short term (≤ 2 years) |
| Lengthy permitting & environmental approvals | -0.6% | National, acute in British Columbia, Quebec | Medium term (2-4 years) |
| Offshore port-infrastructure bottlenecks in Atlantic Canada | -0.4% | Nova Scotia, Newfoundland, New Brunswick | Long term (≥ 4 years) |
| Growing rural opposition & restrictive municipal bylaws | -0.5% | Ontario (primary), Alberta, Quebec (secondary) | Short term (≤ 2 years) |
| Source: Mordor Intelligence | |||
Grid Congestion & Curtailment Risk in Alberta/Ontario
Alberta curtailed 508 GWh of wind in 2024, up 178% year on year, with 1,800 MW of capacity attached to substations already running at 95% thermal limits.[3]Alberta Electric System Operator, “2024 Market Review,” AESO.CA Projects receive no make-whole payments, and every 1% of lost generation shaves roughly 30 basis points from equity returns. Ontario’s Bruce Peninsula faces a parallel squeeze that will not ease before a USD 888 million line-twinning completes in 2029.
Lengthy Permitting & Environmental Approvals
Federal impact assessments for >200 MW wind farms averaged 42 months in 2024, double statutory limits, with provincial reviews often conducted sequentially rather than concurrently.[4]Impact Assessment Agency of Canada, “Major Project Inventory,” IAAC-AEIC.GC.CA Ontario trimmed approval times to 9 months for <50 MW facilities, yet the utility-scale class that dominates the Canadian wind energy market still endures full multi-year reviews.
*Our forecasts treat driver/restraint impacts as directional, not additive. The impact forecasts reflect baseline growth, mix effects, and variable interactions.
Segment Analysis
By Location: Offshore Pipelines Reshape Atlantic Strategy
Onshore capacity held the entire Canadian wind energy market share in 2025 at 18.95 GW, yet offshore lease awards totaling 14 GW point to a structural mix shift over the forecast horizon. Nova Scotia alone licensed 5,000 km² of seabed with 55% capacity factors that underwrite feed-in tariffs at USD 89 per MWh. Newfoundland’s green-hydrogen play layers a 3 GW wind build on top of export infrastructure that promises EUR 1.50 per kg (USD 1.65 per kg) cost advantages versus European projects.
Onshore growth continues in the near term, with 2.4 GW under construction across Alberta, Saskatchewan, and Ontario. However, offshore capital intensity, USD 3.7 million per MW, nearly double onshore, concentrates ownership among European utilities and pension funds that prize long-dated, index-linked revenue streams. Once port constraints lift, offshore could represent 15% of the Canada wind energy market size by 2031.


By Turbine Capacity: Repowering Accelerates Platform Shift
Turbines rated 3–6 MW represented 67.7% of capacity in 2025, reflecting the wave of V136-3.45 MW and SG 4.5-145 machines installed since 2018. Above-6 MW models will grow at an 11.9% CAGR as repowering economics and transport-friendly two-piece blades make the larger class attractive even for land-constrained sites. A 6.8 MW unit yields 60% more energy than a 4.5 MW design while lifting capex only 35%, boosting project IRR by 1–1.5 percentage points.
Legacy turbines below 3 MW now account for less than 15% of new orders and are limited to community projects where lower tip heights ease local acceptance. Developers eye repowering as a swift route to scale: TransAlta’s Summerview upgrade replaced 88 small turbines with 39 larger ones, improving net capacity factor and trimming maintenance call-outs by one-third. The trend supports a gradual migration toward fewer, taller machines that unlock higher wind speeds aloft and compress per-MW land requirements.
By Application: Community Models Unlock Indigenous Capital
Utility-scale assets dominated 92.1% of capacity in 2025 because bulk builds amortize transmission fees that average USD 58200 per MW. Still, community-led ventures are forecast to grow at a 12.5% CAGR as Ottawa’s loan-guarantee program trims sponsor equity to 10% and leaves long-run cash flows inside host communities. Saskatchewan’s Seven Stars and Alberta’s Maskwacis projects, both majority Indigenous-owned, demonstrate how streamlined consultations shave 18 months off federal review.
Commercial and industrial behind-the-meter projects remain niche at 2% of capacity because most provinces cap net-metering at 500 kW. Ontario’s direct-PPA rule change is starting to shift that calculus for factories and data centers that can co-locate 5–20 MW wind arrays and pair them with batteries to arbitrage time-of-use tariffs. While utility scale retains the lion’s share, community and C&I installs provide diversification and strengthen social license to operate, critical as rural opposition stiffens elsewhere.
Geography Analysis
Alberta led with 4.8 GW in 2025, yet corporate PPAs collapsed 99% the prior year as hourly merchant prices whipsawed between USD 14.55 and USD 145.5 per MWh, scaring off long-term buyers AESO.CA. Ontario filled the demand vacuum, adding 800 MW in 2025 via its Long-Term 2 RFP and targeting 2 GW more by 2028 to offset retiring gas plants. Quebec, home to 3.6 GW, leveraged Hydro-Québec’s 1,200 MW export line to New York, fetching USD 75 per MWh, a 25% premium over domestic wholesale prices.
Atlantic Canada has emerged as the growth hotspot. Nova Scotia auctioned 11 GW of offshore lease areas between 2024 and 2025 and could leapfrog Alberta in installed capacity by 2035, assuming port-upgrade timelines hold. Newfoundland’s 3 GW offshore-wind-to-hydrogen strategy aims to deliver green fuel to Europe at EUR 4 per kg (USD 4.40 per kg), beating locally produced alternatives by EUR 1.50 per kg. Saskatchewan and Manitoba, at 1.4 GW combined, ride Indigenous partnerships that unlock majority community ownership while maintaining bankable project structures.
British Columbia’s abundant hydro keeps wholesale prices near USD 29 per MWh, dampening wind additions to just 600 MW by 2025. Even so, its latest resource plan calls for 1.2 GW of wind between 2027 and 2030 to meet liquefied natural gas electrification needs, though 36-month environmental reviews remain a hurdle.
Competitive Landscape
Five developers, TransAlta, Capital Power, Northland Power, Brookfield Renewable Partners, and Boralex, control roughly 45% of capacity, indicating moderate concentration. TransAlta captures cost advantage through its 200-technician in-house O&M unit, driving fleet-wide service costs down to USD 8.8 per MWh. Northland links with First Nations to co-own assets, shaving one to one-and-a-half years from permitting. Brookfield locked a 1,200 MW multi-year turbine allocation with Vestas in 2024, insulating its pipeline from the 15% spot cost inflation that hit the nacelle market.
Mid-tier players such as Innergex, Pattern Energy, BluEarth, and Alberta Wind Energy Corp. chase niche PPAs with municipal utilities and industrial buyers. Repowering Alberta’s 2.4 GW pre-2010 fleet offers immediate white space, with IRRs exceeding 14% where salvage values offset part of the capex. Offshore Atlantic Canada remains 90% unallocated, attracting European utilities hungry for fixed-bottom capacity outside congested North Sea grounds. Turbine OEMs fight margin erosion: Siemens Gamesa’s wind division posted −8% EBITDA in 2024, pivoting to high-margin service contracts, while Vestas rolled out modular blades that cut Canadian transport costs 20% and won 40% of 2025 turbine orders.
Battery storage and hydrogen electrolyzer vendors monitor the Canadian wind energy market for co-location prospects. Developers testing 4-hour lithium-ion packs at Alberta and Ontario sites aim to capture peak-price spreads now averaging USD 72 per MWh. Equipment suppliers that can integrate storage-ready inverters and hydrogen-compatible interties stand to differentiate as hybrid tenders emerge over the next planning cycle.
Canada Wind Energy Industry Leaders
TransAlta Corporation
Capital Power Corporation
Northland Power Inc.
Pattern Energy Group LP
Innergex Renewable Energy Inc.
- *Disclaimer: Major Players sorted in no particular order

Recent Industry Developments
- February 2026: In a significant move for EDF's Canadian renewable portfolio, the Québec government greenlit the Madawaska wind farm, paving the way for construction to commence in early 2026. Boasting a capacity of 274 MW and featuring approximately 45 turbines, the project promises to deliver a substantial amount of zero-carbon power to the province.
- February 2026: The Mersey River Wind Project obtained full financing through a CAD 150 million loan from the Canada Infrastructure Bank. This 148.5 MW project comprises 33 turbines and is projected to supply electricity to over 50,000 homes, with turbine operations anticipated to commence later in 2026.
- June 2025: Vestas secured a 124 MW turbine supply order from EDF Power Solutions for the Haute-Chaudière wind project in Québec, indicating ongoing expansion of onshore wind capacity.
- April 2025: The Wolastoqey Nation, in collaboration with Natural Forces, has announced plans for the Salmon River Wind Project, which is expected to have a capacity of approximately 203 MW with around 34 turbines. The project is scheduled for 2025 and aims to contribute to provincial wind energy targets set for 2035.


Canada Wind Energy Market Report Scope
Wind energy is a form of renewable energy that is generated by harnessing the power of the wind. Wind turbines, which are large structures with long blades that rotate around a central hub, convert the wind's kinetic energy into electrical energy. For each segment, the market sizes and forecasts have been done based on installed capacity (GW).
The Canadian wind energy market is segmented by location, turbine capacity, application, and geography. By location, the market is segmented into onshore and offshore. By turbine capacity, the market is segmented into up to 3 MW, 3 to 6 MW, and above 6 MW. By application, the market is segmented into utility-scale, commercial and industrial, and community projects. For each segment, the market sizing and forecasts have been done on the basis of installed capacity (GW).
By Location
| Onshore |
| Offshore |
By Turbine Capacity
| Up to 3 MW |
| 3 to 6 MW |
| Above 6 MW |
By Application
| Utility-scale |
| Commercial and Industrial |
| Community Projects |
By Component (Qualitative Analysis)
| Nacelle/Turbine |
| Blade |
| Tower |
| Generator and Gearbox |
| Balance-of-System |
| By Location | Onshore |
| Offshore | |
| By Turbine Capacity | Up to 3 MW |
| 3 to 6 MW | |
| Above 6 MW | |
| By Application | Utility-scale |
| Commercial and Industrial | |
| Community Projects | |
| By Component (Qualitative Analysis) | Nacelle/Turbine |
| Blade | |
| Tower | |
| Generator and Gearbox | |
| Balance-of-System |


Key Questions Answered in the Report
How large is the Canada wind energy market in 2026?
Installed capacity stands at 20.10 GW in 2026, and is forecasted to reach 28.50 GW by 2031.
What is the expected CAGR for Canadian wind capacity through 2031?
Capacity is projected to grow at a 7.23% CAGR between 2026 and 2031.
Which province is adding wind capacity fastest after 2025?
Ontario leads near-term additions with 800 MW commissioned in 2025 and 2 GW more targeted by 2028.
Why are offshore projects gaining traction in Atlantic Canada?
Fixed-bottom sites with 55% capacity factors and green-hydrogen export plans offer higher revenue certainty than prairie onshore builds.
How do federal tax credits affect project economics?
The combined 30% Clean Technology ITC and 15% Clean Electricity ITC can offset up to 40% of capital costs, cutting the weighted-average cost of capital by roughly 1.5–2 percentage points.
Page last updated on:


