Market Overview
| Study Period | 2021 - 2031 |
|---|---|
| Forecast Data Period | 2026 - 2031 |
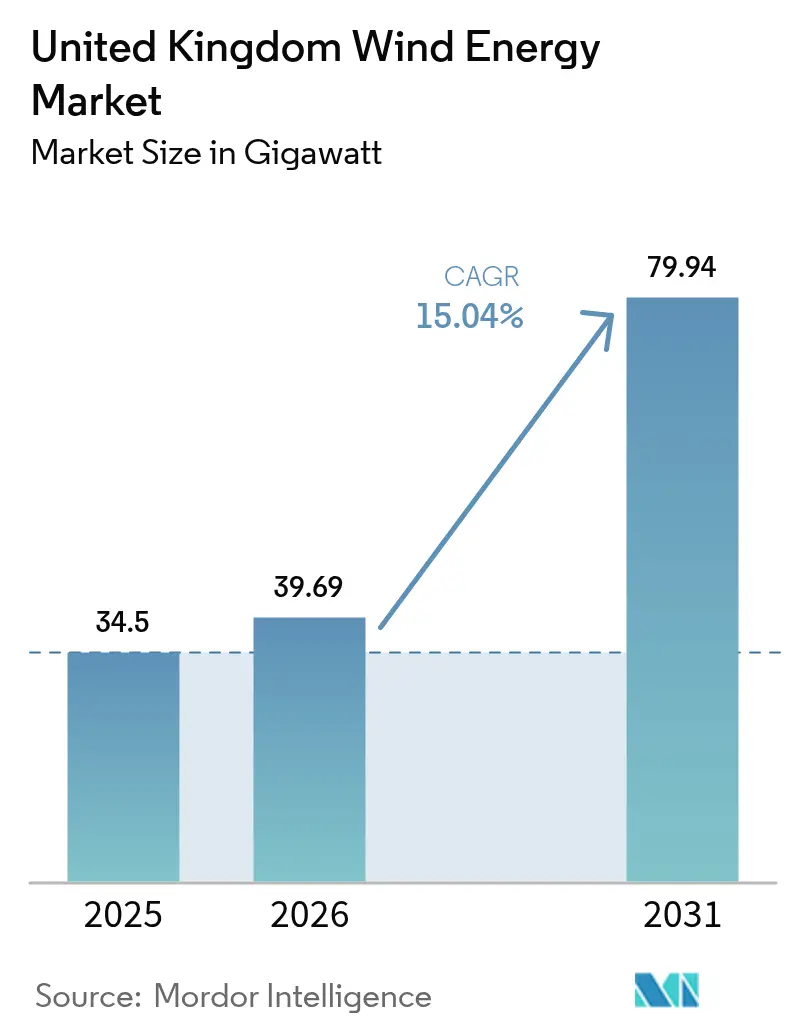
| Base Year Market Size (2025) | 34.5 gigawatt |
| Market Volume (2026) | 39.69 gigawatt |
| Market Volume (2031) | 79.94 gigawatt |
| Growth Rate (2026 - 2031) | 15.04% CAGR |
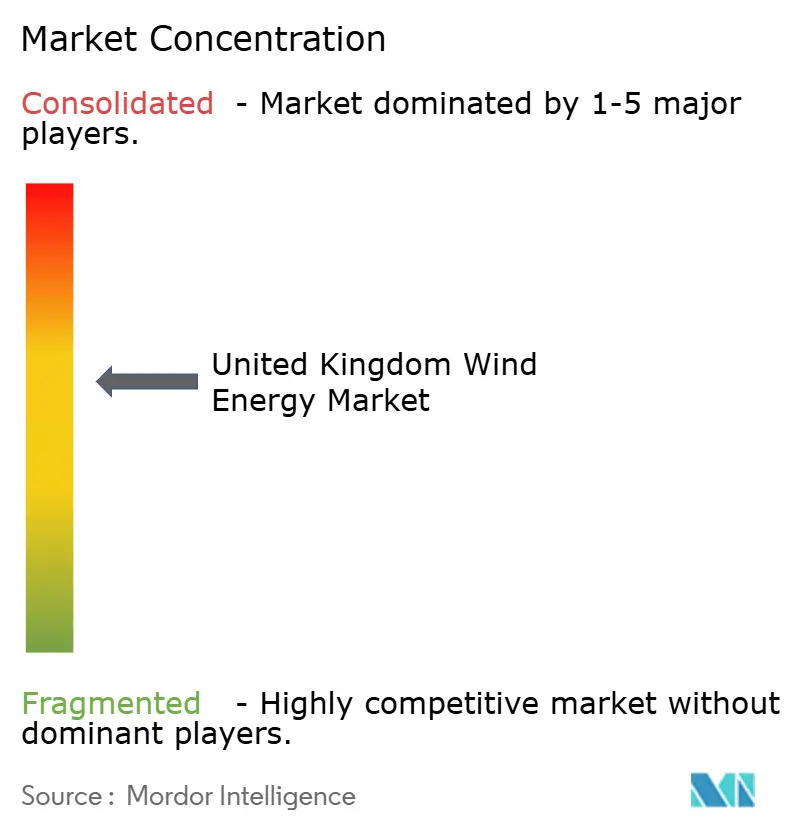
| Market Concentration | Medium |
Major Players *Disclaimer: Major Players sorted in no particular order Image © Mordor Intelligence. Reuse requires attribution under CC BY 4.0. | |
United Kingdom Wind Energy Market Analysis by Mordor Intelligence
The United Kingdom Wind Energy Market size is expected to grow from 34.5 gigawatt in 2025 to 39.69 gigawatt in 2026 and is forecast to reach 79.94 gigawatt by 2031 at 15.04% CAGR over 2026-2031.
This expansion follows the July 2024 policy change, which removed England’s onshore restrictions and aligned wind energy with other energy infrastructure. Liberalized planning has revived stalled onshore proposals, accelerated repowering, and stimulated record tender activity. Offshore growth benefits from ScotWind and Celtic Sea leasing rounds, while inflation-indexed Contract for Difference (CfD) strike prices shelter developers from cost volatility. The sector must, however, navigate supply-chain gaps in steel monopiles and subsea cables, rising gilt-linked finance costs, and vessel shortages that threaten project schedules.
Key Report Takeaways
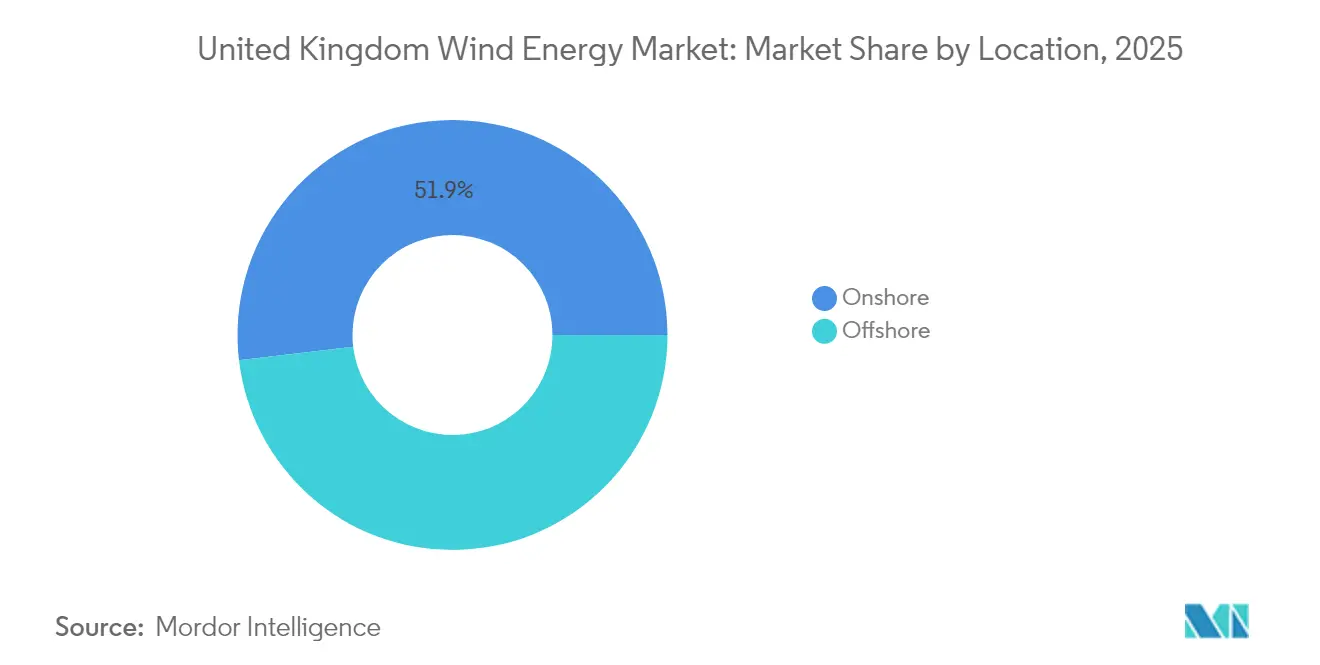
- By location, onshore wind held 51.88% of the UK wind power market share in 2025, while offshore wind is projected to expand at a 20.18% CAGR through 2031.
- By turbine capacity, units exceeding 6 MW captured a 74.42% share of the UK wind power market size in 2025, and this segment is forecasted to grow at a 18.22% CAGR to 2031.
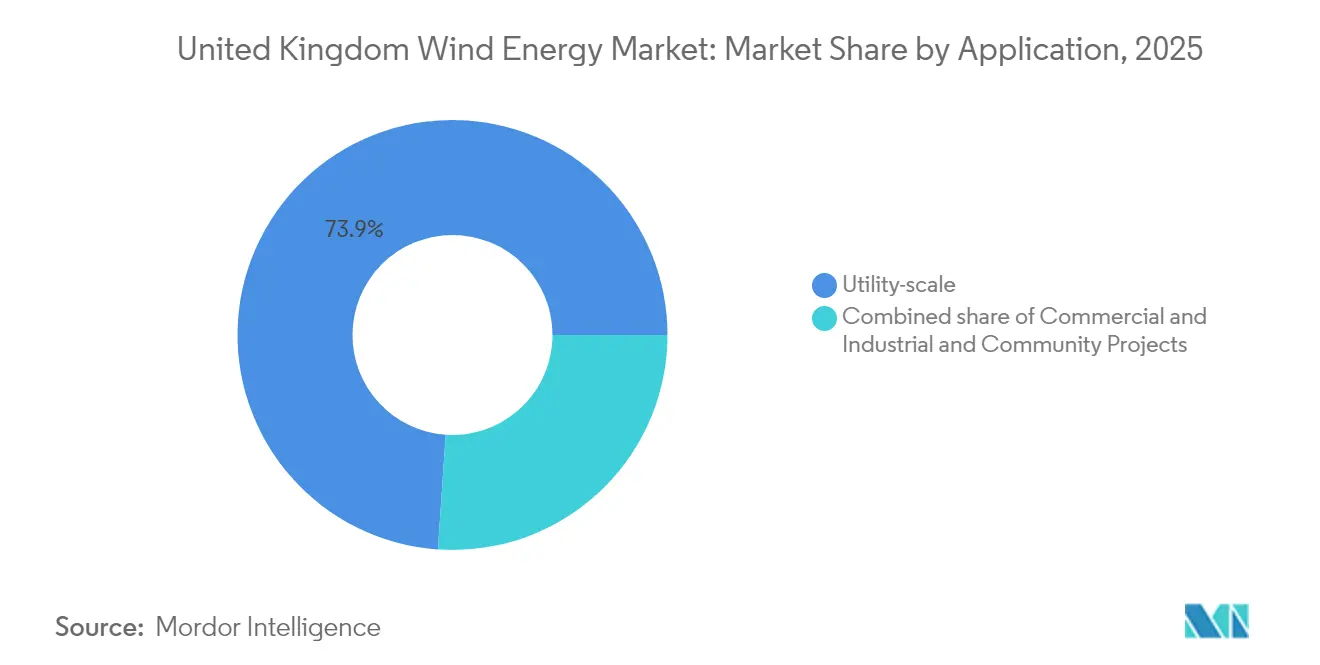
- By application, utility-scale projects accounted for 73.92% of the UK wind power market size in 2025, while community projects are expected to advance at a 20.72% CAGR between 2026 and 2031.
- ScottishPower, Ørsted, and SSE Renewables together controlled an estimated 40.35% share of installed capacity in 2025.
Note: Market size and forecast figures in this report are generated using Mordor Intelligence’s proprietary estimation framework, updated with the latest available data and insights as of 2026.
United Kingdom Wind Energy Market Trends and Insights
Drivers Impact Analysis*
| Driver | (~) % Impact on CAGR Forecast | Geographic Relevance | Impact Timeline |
|---|---|---|---|
| Rapid build-out of Round 3 & ScotWind offshore lease projects | +3.2% | Scotland, North Sea waters | Medium term (2-4 years) |
| Repowering of early on-shore fleets reaching 20-year life | +2.1% | Scotland, England, Wales | Short term (≤ 2 years) |
| Contract for Difference AR6 price-floors linked to CPI(X) | +2.8% | UK-wide | Medium term (2-4 years) |
| Grid-balancing revenues from National Grid's Dynamic Services reform | +1.4% | England, Wales | Short term (≤ 2 years) |
| Co-location with green hydrogen electrolysers at port hubs | +1.9% | Scotland, Wales coastal regions | Long term (≥ 4 years) |
| AI-enabled predictive O&M cutting LCOE below £40/MWh | +2.2% | UK-wide | Medium term (2-4 years) |
| Source: Mordor Intelligence | |||
Rapid build-out of Round 3 and ScotWind offshore lease projects
The Crown Estate’s ScotWind awards opened a 25 GW pipeline across 17 leases that already possess surveys, grid links, and vessel bookings, trimming typical development cycles by almost two years.[1]The Crown Estate, “Industrial Growth Plan,” thecrownestate.co.uk East Anglia Hub’s 2.9 GW build and other Round 3 schemes cluster contracts, lift local content, and unlock economies of scale in foundations and logistics. The Industrial Growth Plan estimates 10,000 additional jobs each year and a GBP 25 billion economic value by 2035, assuming annual deployment remains near 6 GW. Yet, Ørsted’s cancellation of Hornsea 4 underscores the need for realistic strike prices and resilient supply chains.
Repowering of early onshore fleets reaching 20-year life
Projects such as Hagshaw Hill replaced 1990s turbines with half the unit count yet quintupled output, cutting LCOE and minimizing fresh land take. Octopus Energy aims to refurbish 1,000 legacy machines, potentially adding 5 GW on pre-consented footprints. Proven wind data, existing community support, and grid capacity shrink lead times compared with greenfield builds. Modern 6-8 MW platforms also provide grid-formative services, enhancing system value.
CfD AR6 price-floors linked to CPI(X)
CfD AR6 secured 990 MW onshore at GBP 50.90/MWh and revised offshore prices to GBP 73/MWh, restoring bid realism after AR5’s zero-award outcome.[2]Department for Energy Security and Net Zero, “Clean Power 2030 Action Plan,” gov.uk Indexation protects developers against inflation in steel and cable costs, while consumers share in the productivity gains. Draft AR7 rules propose terms longer than 15 years and flexible budget caps to crowd in 12 GW of capacity. These tweaks reduce cost-of-capital pressure caused by higher gilt yields.
Grid-balancing revenues from National Grid’s Dynamic Services reform
Dynamic Containment and Regulation contracts pay wind farms for inertia, frequency, and voltage services concurrently with energy sales. A GBP 328 million six-year deal already saves billpayers GBP 128 million. New-build projects now specify advanced converters and on-site batteries to capture these dual revenues, lifting project IRRs and supporting a grid target of 100% zero-carbon operation by 2035.
Restraints Impact Analysis*
| Restraint | (~) % Impact on CAGR Forecast | Geographic Relevance | Impact Timeline |
|---|---|---|---|
| Supply-chain bottlenecks in XXL monopiles & HVDC cables | -2.8% | North Sea, Celtic Sea offshore areas | Short term (≤ 2 years) |
| Community opposition in scenic highlands delaying permits | -1.4% | Scotland, Wales, Northern England | Medium term (2-4 years) |
| Rising cost of capital from higher UK gilt yields | -1.9% | UK-wide | Short term (≤ 2 years) |
| Scarcity of experienced offshore installation vessels | -1.7% | UK offshore waters | Medium term (2-4 years) |
| Source: Mordor Intelligence | |||
Supply-chain bottlenecks in XXL monopiles and HVDC cables
Europe’s fabrication capacity is projected to cover only 70% of steel demand by 2029, with the UK's needs alone at 3.8 million tonnes for 2025-2027. Limited plants capable of producing more than 2,000 tons of monopiles drive 40-50% price jumps and multi-year lead times. SeAH Wind’s Teesside line, due 2026, helps but fills just a fraction of the gap. HVDC cable slots exhibit similar strain, potentially risking grid connection delays.
Community opposition in scenic highlands delaying permits
Landscape concerns halted Faw Side and Lowther Hills applications despite compliance with the energy policy.[3]BBC News, “Scottish Government Rejects Faw Side Wind Farm,” bbc.co.uk The Scoop Hill proposal also encountered difficulties in securing local council votes. Government-mandated benefit sharing aims to align host communities; however, inconsistent adoption still prolongs consent by 18-24 months on average.
*Our forecasts treat driver/restraint impacts as directional, not additive. The impact forecasts reflect baseline growth, mix effects, and variable interactions.
Segment Analysis
By Location: Onshore resurgence drives market acceleration
The UK wind power market size for onshore installations reached 17.9 GW in 2025, accounting for 51.88% of the total capacity. Onshore’s cost advantage, rapid build cycle, and revived policy status attract at least six developers exploring fresh English sites and large-scale repowering. Projects such as Scout Moor II, at 100 MW, underscore the scale unlocked after the ban was lifted. Repowering older clusters quadruples capacity on proven ground and capitalizes on existing grid access.
Policy momentum also fuels community support schemes that tie local ownership to bill credits, thereby smoothing the planning process. Yet grid headroom in northern England and Scotland narrows, making reinforcement indispensable to double onshore to the targeted 30 GW by 2030. Digital forecasting and flexible connections mitigate curtailment risk as National Grid’s stability markets mature.
Offshore accounted for 16.6 GW in 2025 and is on track for 50.03 GW by 2031, advancing at a 20.18% CAGR. The segment benefits from mean capacity factors above 50% and project modularity above 1 GW, which improves financing scale and export potential. ScotWind’s 25 GW leasing and Celtic Sea’s 4.5 GW floating awards dominate the project tracker. While monopile and vessel constraints temper near-term build rates, inflation-indexed CfD strike prices now better reflect higher capex, restoring bid appetite.


By Turbine Capacity: Large turbines dominate efficiency drive
Turbines above 6 MW held 74.42% of the UK wind power market share in 2025, reflecting developer preference for maximizing energy per foundation. Siemens Gamesa’s 14 MW units selected for East Anglia TWO prove bankability at this scale. Larger rotors reduce balance-of-plant costs per MWh and generate additional income from frequency services.
The UK wind power market size for machines exceeding 6 MW is expected to reach 69.67 GW by 2031, growing at an 18.22% CAGR. Manufacturers co-locate blade and nacelle plants in Scotland and the Humber to reduce transport bottlenecks and capitalize on local content bonuses. The 3-6 MW class remains relevant for landlocked or weak-grid onshore sites, but its share is expected to slide beneath 19.80% by 2031 as planners favor higher nameplate capacities to optimize scarce land and grid slots.
Small turbines under 3 MW fill niche roles in estate and repowering applications where crane, road, or planning limitations apply. Octopus Energy’s programme targets single-MW retrofits on existing pads, pairing them with community PPAs for faster payback. However, the absence of a domestic supply chain for these sizes may constrain volumes.
By Application: Utility-scale dominance faces community challenge
Utility-scale plants controlled 73.92% of the UK wind power market size in 2025, leveraging deep balance sheets and vertical integration. Operators bundle merchant, CfD, ancillary, and storage revenue into diversified portfolios. ScottishPower has doubled its UK investment pipeline to GBP 24 billion through 2028, signaling confidence in this model. Utilities also pioneer co-located batteries, as seen in the 600 MWh Hornsea 3 storage adjunct, which improves grid compliance and arbitrage spreads.
Community projects, while small, expand fastest. Growth at 20.72% CAGR springs from revised benefit protocols that guarantee host villages up to GBP 5,000 per MW annually and partial equity stakes. Lower technology costs and retail-linked platforms encourage civic groups to crowdfund turbines or partner with energy suppliers. Their aggregate capacity could top 3.4 GW by 2031, contributing to social license and local grid services.
Commercial and industrial self-supply completes the application mix, with supermarkets and manufacturers installing behind-the-meter turbines to cut Scope 2 emissions. Long-dated corporate PPAs align with decarbonization targets and hedge volatile grid prices.
Geography Analysis
Scotland supplied 33.62% of the 2025 national output and anchors more than 39.75% of the forward pipeline. Its North Sea resource, port infrastructure, and streamlined Marine Scotland consents allow multigigawatt clusters like Moray West to progress swiftly. Vestas's proposed Leith blade plant complements existing fabrication at Nigg and Aberdeen, strengthening domestic content.
Wales is evolving into a leading hub for floating wind power. The Celtic Sea plan allocates 4.5 GW across three pre-commercial arrays, which will trial 14 MW units on semi-sub platforms. Port Talbot's GBP 500 million redevelopment positions it as an assembly hub, with the wider freeport projected to support 16,000 roles. Project Erebus will showcase technology readiness by 2026 and unlock export of fabrication services to other Atlantic markets.
England re-opens its onshore prospectivity after the July 2024 reforms. Scout Moor II and numerous smaller sites in Lincolnshire and Yorkshire populate a fresh 6-8 GW pipeline. Network reinforcements under the Holistic Network Design accelerate grid access, though community benefit compliance varies by county. Offshore, Dogger Bank continues phased commissioning, with Dynamic Stability contracts enhancing revenue stacking. Northern Ireland maintains 14.65% of the UK's installed onshore capacity and exploits cross-border trading to the Irish Single Electricity Market, while Belfast Harbour upgrades enable turbine staging for both Irish and Scottish projects.
Competitive Landscape
Market leadership rests with a cluster of integrated utilities and specialist offshore developers. Ørsted operates 5.6 GW across 12 UK sites, but recently absorbed a DKK 3.5-4.5 billion hit from canceling Hornsea 4, citing inflated capital expenditure and financing costs. SSE Renewables couples generation with transmission ownership, diversifying cash flows, whereas ScottishPower’s GBP 24 billion capital plan focuses on strengthening UK-based supply chains.
Technology providers such as Siemens Gamesa, Vestas, and GE Vernova supply most nacelles above 8 MW. Vestas plans to establish a blade factory in Leith to secure domestic content and mitigate logistics risks.[6]BBC News, “Vestas Blade Factory Proposal,” bbc.co.uk Supply-chain newcomers like SeAH Wind invest £300 million in Teesside monopiles, addressing a chronic shortfall and positioning themselves for Celtic Sea floating contracts.
Competition intensifies in the floating wind sector, where oil-service majors Equinor and TechnipFMC bring their expertise in mooring and subsea technologies. Energy retailers such as Octopus Energy are diversifying into generation, acquiring stakes in East Anglia One and marketing direct-to-household green tariffs. Installation vessel operators Cadeler and DEME expand their fleets, but the current scarcity still constrains project sequencing.
United Kingdom Wind Energy Industry Leaders
Ørsted A/S
SSE Renewables
ScottishPower Renewables
RWE Renewables
Vattenfall AB
- *Disclaimer: Major Players sorted in no particular order

Recent Industry Developments
- May 2025: Ørsted discontinued the Hornsea 4 offshore wind project in its current form due to increased supply chain costs, higher interest rates, and execution risks, with expected breakaway costs of DKK 3.5 to 4.5 billion.
- April 2025: Octopus Energy acquired a stake in the East Anglia One wind farm, demonstrating the emergence of new ownership models that combine utility-scale operations with innovative customer engagement strategies.
- April 2025: The Crown Estate announced that three Welsh ports, Swansea, Port Talbot, and Milford Haven, were shortlisted for contracts to develop floating wind farms in the Celtic Sea, competing against Bristol, Falmouth, and Plymouth for projects that could generate enough renewable energy to power over 4 million homes.
- March 2025: The UK government launched the Clean Power 2030 Action Plan, targeting 43-50 GW of offshore wind and 27-29 GW of onshore wind capacity, with an annual investment of GBP 40 billion and comprehensive planning reforms.


United Kingdom Wind Energy Market Report Scope
The UK wind energy market report includes:
By Location
| On-shore |
| Off-shore |
By Turbine Capacity
| Up to 3 MW |
| 3 to 6 MW |
| Above 6 MW |
By Application
| Utility-scale |
| Commercial and Industrial |
| Community Projects |
By Component (Qualitative Analysis)
| Nacelle/Turbine |
| Blade |
| Tower |
| Generator and Gearbox |
| Balance-of-System |
| By Location | On-shore |
| Off-shore | |
| By Turbine Capacity | Up to 3 MW |
| 3 to 6 MW | |
| Above 6 MW | |
| By Application | Utility-scale |
| Commercial and Industrial | |
| Community Projects | |
| By Component (Qualitative Analysis) | Nacelle/Turbine |
| Blade | |
| Tower | |
| Generator and Gearbox | |
| Balance-of-System |


Key Questions Answered in the Report
How large is installed capacity today?
Installed capacity will reach 39.69 GW in 2026 and is forecast to 79.94 GW by 2031.
What CAGR is expected through 2031?
Capacity is projected to grow at 15.04% between 2026 and 2031.
Which segment expands fastest?
Offshore wind leads with a 20.18% CAGR thanks to ScotWind and Celtic Sea projects.
Why are larger turbines preferred?
Units above 6 MW cut balance-of-plant costs and dominate 74.42% of 2025 installations.
What key policy supports revenue?
The inflation-indexed CfD scheme locks in price floors and lowers investment risk.
Which region leads future pipeline?
Scotland holds more than 39.75% of the development queue due to ScotWind leases.
Page last updated on:


