Market Overview
| Study Period | 2021 - 2031 |
|---|---|
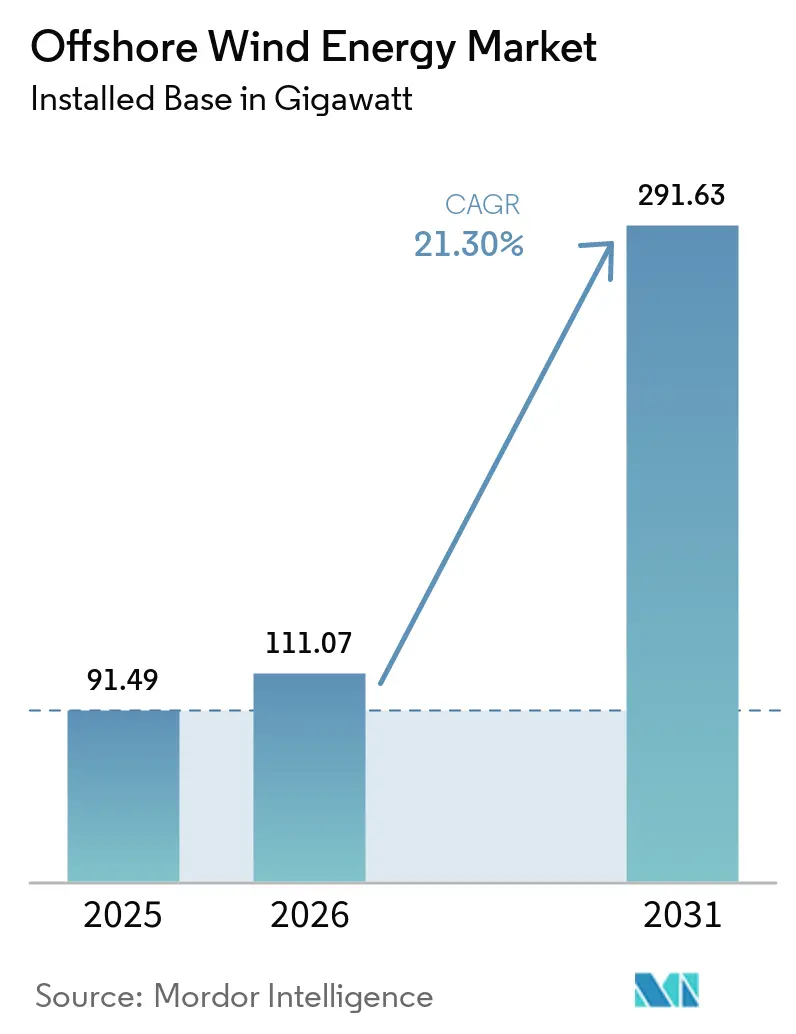
| Market Volume (2026) | 111.07 gigawatt |
| Market Volume (2031) | 291.63 gigawatt |
| Growth Rate (2026 - 2031) | 21.30% CAGR |
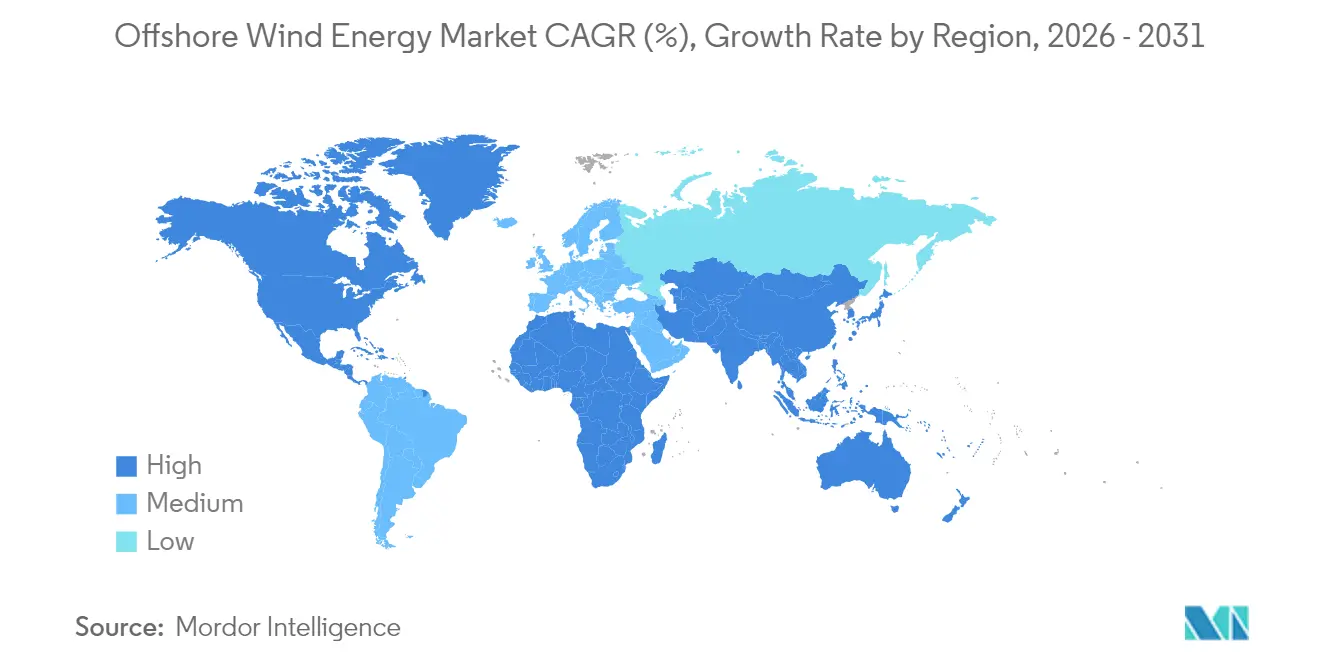
| Fastest Growing Market | North America |
| Largest Market | Asia Pacific |
| Market Concentration | Medium |
Major Players*Disclaimer: Major Players sorted in no particular order Image © Mordor Intelligence. Reuse requires attribution under CC BY 4.0. | |
Offshore Wind Energy Market Analysis by Mordor Intelligence
The Offshore Wind Energy Market size was valued at 91.49 gigawatt in 2025 and estimated to grow from 111.07 gigawatt in 2026 to reach 291.63 gigawatt by 2031, at a CAGR of 21.30% during the forecast period (2026-2031).
Sliding levelized costs of electricity (LCOE) to USD 0.075/kWh, auction-backed revenue certainty, and surging corporate demand underscore why the offshore wind energy market now rivals gas‐fired generation on cost while offering capacity factors above 60% in prime locations. Developers are ordering 15 MW–20 MW turbines, shrinking per-megawatt foundation counts and wiring runs, and enabling gigawatt-scale projects to close financing on tighter schedules. As a result, the offshore wind energy market is attracting diversified capital from utilities, oil majors, and infrastructure funds that view the technology as a durable, inflation-resilient asset class.
Key policy moves reinforce momentum. Europe kept strike prices under EUR 40/MWh in Denmark’s latest tender, the United States set a 30 GW federal target backed by streamlined permits, and Japan’s third auction opened the archipelago’s deep waters to international players.[1]Japan Ministry of Economy, Trade and Industry, “Round 3 Offshore Wind Auction Results,” meti.go.jp At the same time, Asia-Pacific’s manufacturing depth is expanding nacelle, blade, and cable output, which eases supply-chain bottlenecks even as installation-vessel availability and grid queue delays threaten near-term build rates in mature markets.
Key Report Takeaways
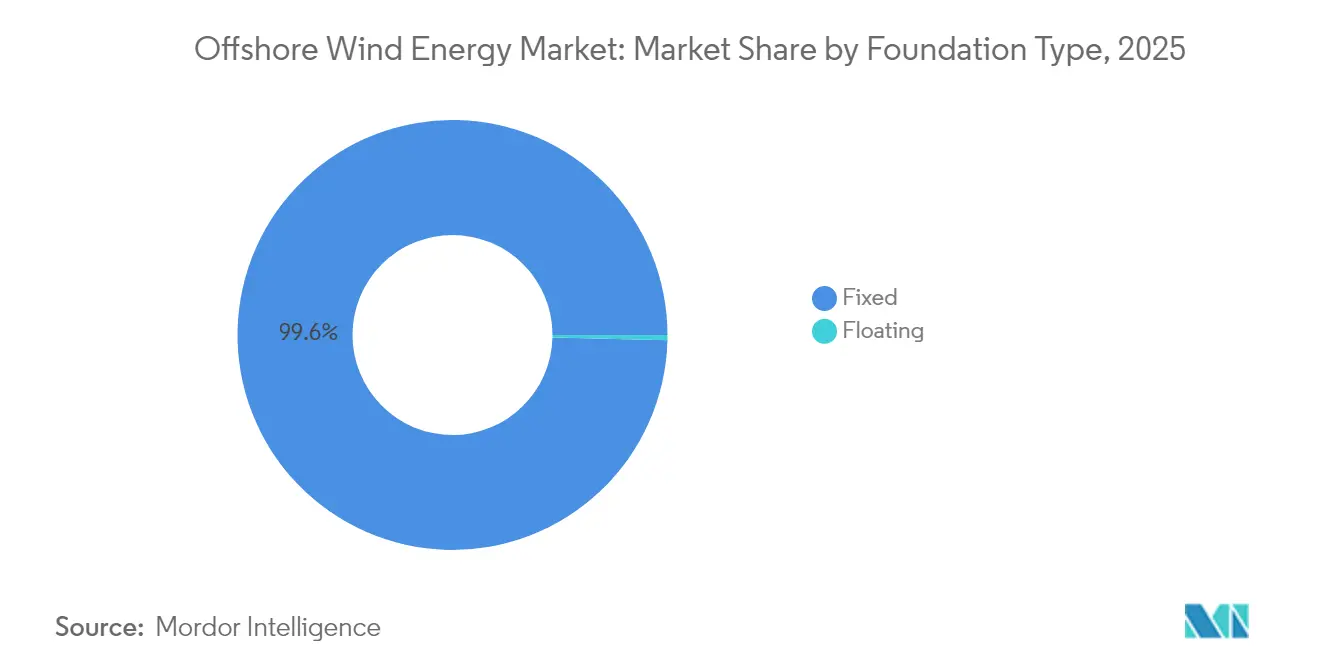
- By foundation type, fixed platforms led with 99.62% of the offshore wind energy market share in 2025; floating semi-submersibles are forecast to expand at an 42.1% CAGR through 2031.
- By turbine capacity, units above 6 MW held 66.55% of the offshore wind energy market size in 2025, while the same class is projected to advance at a 22.35% CAGR to 2031.
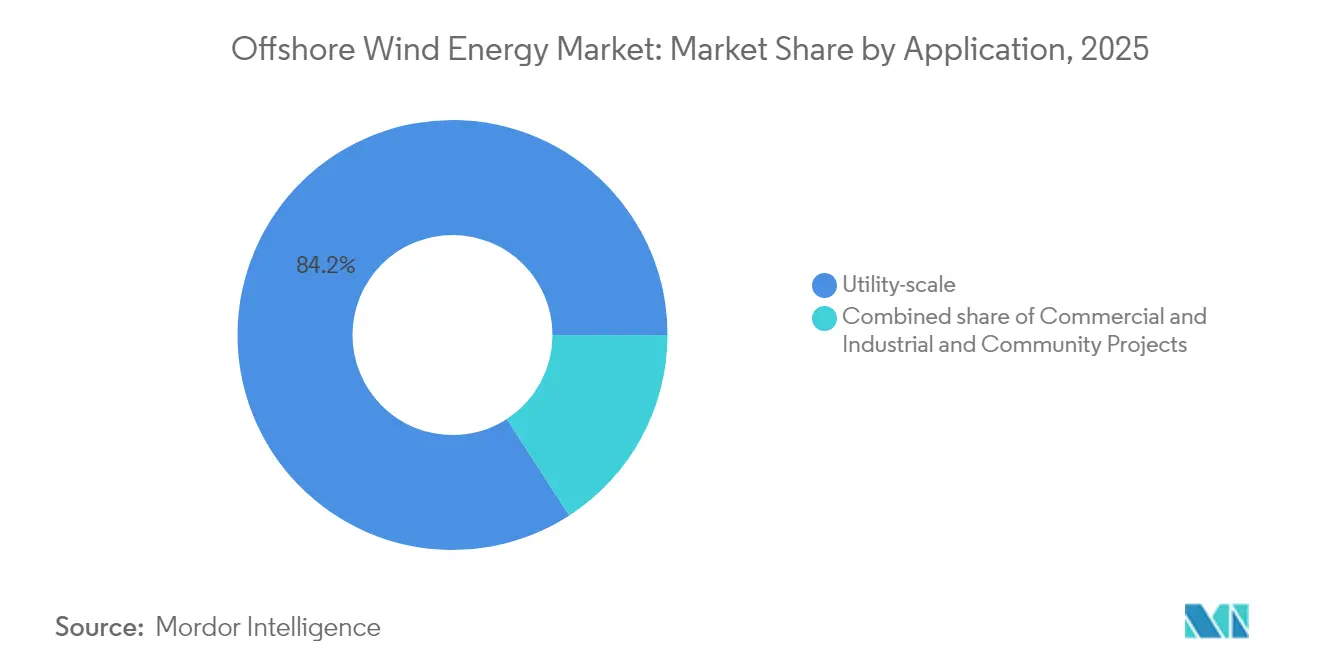
- By application, utility-scale projects accounted for an 84.15% share of the offshore wind energy market size in 2025; commercial and industrial schemes are growing at a 25.7% CAGR.
- By geography, Asia-Pacific commanded 54.35% of the offshore wind energy market share in 2025, whereas North America records the highest projected CAGR at 103.6% through 2031.
Note: Market size and forecast figures in this report are generated using Mordor Intelligence’s proprietary estimation framework, updated with the latest available data and insights as of 2026.
Global Offshore Wind Energy Market Trends and Insights
Drivers Impact Analysis*
| Driver | (~) % Impact on CAGR Forecast | Geographic Relevance | Impact Timeline |
|---|---|---|---|
| Rapid decline in LCOE | +5.50% | Global, strongest in Europe and Asia-Pacific | Medium term (2-4 years) |
| Government auction schemes and FITs | +4.40% | Europe and Asia-Pacific core, spill-over to Americas | Short term (≤ 2 years) |
| Turbine upsizing to 15 MW+ | +4.00% | Global, led by Europe and China manufacturing | Medium term (2-4 years) |
| Corporate PPAs for renewables | +3.30% | North America and EU, expanding to Asia-Pacific | Short term (≤ 2 years) |
| Repowering of first-wave farms post-2030 | +2.60% | Europe and North America | Long term (≥ 4 years) |
| Offshore-to-hydrogen hybrid projects | +2.20% | Europe, Australia, Middle East | Long term (≥ 4 years |
| Source: Mordor Intelligence | |||
Rapid decline in LCOE drives market acceleration
Costs have crossed a critical threshold: at USD 0.075/kWh in 2024, new arrays equal or beat combined-cycle gas plants on price in multiple regions.[2]International Renewable Energy Agency, “Renewable Power Generation Costs 2024,” irena.org Higher-rated turbines, serial fabrication, and shorter installation windows cut overall project timelines by up to 30% and materially improve developer returns. Floating projects once deemed uneconomic are approaching breakeven as learning curves trim capex and as global insurers underwrite deeper-water risks. Consensus among equipment vendors places sub-USD 0.060/kWh pricing within reach this decade, solidifying the offshore wind energy market as a go-to baseload-like renewable option.
Government auction mechanisms accelerate deployment
Competitive tenders awarded 23.2 GW across Europe in 2024 alone, a 40% year-on-year leap that extended predictable cash-flow regimes for twenty years or more. Denmark’s record-low clearing price signaled confidence in supply-chain maturity, while Japan’s latest 1.8 GW tranche showcased Asia’s appetite for turnkey solutions. Germany strengthens the model by synchronizing grid build-out obligations with award announcements, reducing curtailment risk and lifting bankability.
Turbine upsizing transforms project economics
Field tests of 20 MW prototypes off China’s coast underscore a step-change in productivity, paring foundation needs by roughly 40% per gigawatt and slashing array-cable length. Vessels boasting 2,000-ton cranes can now hoist 120-m blades, but the global fleet numbers barely fifty ships, creating a premium on early booking slots. Modular blade logistics and widened port quays are immediate priorities as suppliers eye 25 MW-plus machines by the early 2030s.
Corporate PPAs reshape demand dynamics
Tech giants and heavy industry inked multi-gigawatt deals in 2024, locking in ten-to-fifteen-year fixed prices that often top auction strike levels and deliver extra revenue certainty for new projects. Virtual contract structures let buyers monetize renewable certificates without taking physical power, extending demand into regions lacking robust green-tariff frameworks. For floating schemes with higher LCOE, these premium PPAs can bridge financing gaps and speed final investment decisions.
Restraints Impact Analysis*
| Restraint | (~) % Impact on CAGR Forecast | Geographic Relevance | Impact Timeline |
|---|---|---|---|
| Shortage of installation vessels | -1.80% | Global, acute in Europe & North America | Short term (≤ 2 years) |
| Grid-connection bottlenecks | -1.30% | Europe, North America, emerging in APAC | Medium term (2-4 years) |
| Seabed-mineral rights conflicts | -0.90% | Europe, North America, emerging in APAC | Medium term (2-4 years) |
| Limited O&M workforce pool | -0.70% | Global, most acute in emerging markets | Long term (≥ 4 years) |
| Source: Mordor Intelligence | |||
Shortage of installation vessels constrains growth
Fewer than fifty jack-up and heavy-lift ships can erect 15 MW turbines worldwide, pushing day-rates to USD 500,000–700,000 and risking 12- to 24-month delays in crowded construction seasons.[3]Offshore Magazine, “Next-Gen Heavy-Lift Vessels,” offshore-mag.com The Jones Act tightens supply further by capping foreign-flag work inside U.S. waters, so developers are experimenting with feeder-barge concepts and modular assembly to stay on schedule.
Grid connection infrastructure lags development
In the UK, Germany, and the U.S. Northeast, high-voltage export cables and substations trail generation by two to three years, inflating carrying costs and forcing phased energization that crimps early-year revenues.[4]European Network of Transmission System Operators for Electricity, “Ten-Year Network Development Plan 2024,” entsoe.eu Manufacturing slots for 525 kV HVDC cable are oversubscribed, prompting long-term offtake agreements between developers and cable mills. Connection fees can account for nearly half of total project capex in remote North Sea tranches, narrowing margins even when strike prices are attractive.
*Our forecasts treat driver/restraint impacts as directional, not additive. The impact forecasts reflect baseline growth, mix effects, and variable interactions.
Segment Analysis
By Foundation Type: Floating Revolution Accelerates
Fixed platforms secured 99.62% of installations in 2025, reflecting proven fabricator networks and installation speeds suited to 60-m depths. This configuration underpins core projects across the offshore wind energy market, but monopile diameter is approaching practical limits as turbines surpass 15 MW. Jackets remain essential in rocky seabeds, while gravity and suction solutions service niche geological settings.
Floating (semi-submersibles, spar-buoys, and tension-leg) platforms are scaling at a 42.1% CAGR, opening 100-m-plus depths where winds blow steadier and permitting hurdles to ease. Hywind Scotland’s 65% capacity factor validates the economics of deep-water generation. California, South Korea, and Japan now run floating-only lease rounds, creating tailwinds that could lift the floating slice of the offshore wind energy market to double digits by decade-end.


By Turbine Capacity: Large Platforms Dominate Growth
Turbines above 6 MW captured 66.55% of installations in 2025 and are advancing at 22.35% CAGR as developers pivot to 15 MW-plus workhorses that streamline array layouts. The offshore wind energy market size for this class stood at 60.86 GW in 2025 and is expected to exceed 204.6 GW by 2031, underscoring rapid standardization around big-iron solutions. Units in the 3 MW-6 MW cohort now serve legacy farms and niche shallow projects.
Ultra-large 20 MW prototypes commissioned off Guangdong demonstrate feasibility and hint at the next wave. Manufacturers invest heavily in modular blade designs that ship in two pieces, reducing port constraints. If 25 MW designs reach serial production by 2030, the offshore wind energy industry could gain another 10% LCOE reduction through fewer foundations and cables.
By Application: Commercial Sector Accelerates Adoption
Utility-scale arrays, typically above 500 MW, held an 84.15% share in 2025 as contract-for-difference (CfD) schemes and feed-in tariffs underwrote long-dated cash flows that de-risk project finance. These big parks continue to dominate the offshore wind energy market because grid integration favors lumpy additions that justify bespoke export links.
Commercial and industrial offtake, growing at a 25.7% CAGR, is changing the customer mix. Tech majors, steelmakers, and chemical producers sign direct PPAs to hedge energy costs and hit net-zero targets, expanding the offshore wind energy market into buyer-driven segments. Community projects remain small but politically salient, offering coastal municipalities revenue sharing and local equity slices.
Geography Analysis
Asia-Pacific sat atop the offshore wind energy market with 54.35% share in 2025, propelled by China’s 35 GW fleet and 20 MW domestic turbines that roll off increasingly automated lines. Japan’s 1.8 GW Round 3 opened deep waters to European and U.S. developers, and Taiwan’s Phase 3 feed-in model shows resilience despite grid delays. Vietnam, India, and Australia are crafting seabed-leasing frameworks that could unlock substantial pipelines by the early 2030s.
North America posts the fastest growth curve at 103.6% CAGR. The 30 GW U.S. federal goal is backed by streamlined Bureau of Ocean Energy Management (BOEM) timelines, state solicitations totaling 17 GW, and domestic vessel construction that shields the supply chain from currency shocks. Canada eyes Atlantic and Pacific leases after mapping more than 4,000 GW of technical potential, while Mexico and Brazil assess wind regimes ahead of potential auctions.
Europe retains technological leadership even as its market share dips. A 12 GW UK procurement queue, Germany’s innovation auctions, and Denmark’s record-low prices underscore the region’s depth. Developers now look to floating turbines in the Celtic Sea, Norway’s Utsira Nord, and Spain’s Canary Islands to tap higher-yield sites and sustain export-oriented supply hubs.

Competitive Landscape
Moderate concentration defines today’s offshore wind energy market: the top five developers hold roughly 55% of installed capacity. Ørsted leverages integrated fabrication and trading arms, Equinor exploits deep-water know-how, and RWE bundles merchant exposure with auction wins. Asian state utilities such as SPIC match European incumbents on annual additions, helped by home-market scale.
Integration is accelerating. Saipem’s pending EUR 43 billion merger with Subsea 7 combines heavy-lift fleets and engineering muscle, a template others may emulate to secure scarce vessels. Turbine OEMs streamline: GE Vernova spins off grid assets to focus on offshore platforms, while Vestas localizes nacelle production in both the U.S. and China to hedge tariff risk. Patents around floating hulls and digital twin O&M software form new competitive moats.
Regional nuances shape rivalry. Europe rewards delivery track record and grid-code finesse; Asia values local-content compliance and price; North America prizes Jones Act vessels and job creation. Players that navigate these criteria expand footprints fastest, sustaining healthy yet disciplined competition within the offshore wind energy market.
Offshore Wind Energy Industry Leaders
Ørsted A/S
Vestas Wind Systems A/S
Siemens Gamesa Renewable Energy, S.A.,
E.ON SE
Xinjiang Goldwind Science Technology Co., Ltd.
- *Disclaimer: Major Players sorted in no particular order

Recent Industry Developments
- February 2025: Saipem and Subsea 7 announced their merger to create Saipem7, a new energy services entity with a combined backlog of EUR 43 billion and revenue of about EUR 20 billion.
- January 2025: Constellation Energy agreed to acquire Calpine in a USD 26.6 billion deal that will create the largest generator of low- and zero-emissions power in the United States.
- January 2025: Offshore energy capex is projected to exceed USD 300 billion in 2025, with offshore wind and floating solar expected to account for nearly 19% of the total.
- December 2024: The Ocean Winds' 2.4 GW SouthCoast Wind project has received final US regulatory approval, specifically the construction and operations plan (COP) approval from the Bureau of Ocean Energy Management (BOEM).
- November 2024: RWE has made a final investment decision for the 1.6 GW Nordseecluster offshore wind farm project in Germany. The project, located in the German North Sea, will be developed in two phases: Nordseecluster A (660 MW) and Nordseecluster B (900 MW).


Global Offshore Wind Energy Market Report Scope
In offshore wind or offshore wind energy, wind power is produced by taking the force of the winds out at sea and converting it to electricity, which is then supplied to the distribution network on land.
The offshore wind energy market is segmented into foundation type, capacity, and geography. By foundation type, the market is segmented into fixed and floating foundations. By capacity, the market is segmented into less than 5 MW and greater than or equal to 5 MW. The report also covers the market size and forecasts for the offshore wind energy market across major regions, such as Asia-Pacific, North America, Europe, South America, the Middle East, and Africa. For each segment, the market sizing and forecasts have been done based on installed capacity (GW).
By Foundation Type
| Fixed | Monopile |
| Jacket | |
| Gravity-Based | |
| Tripod/Tripile | |
| Suction Bucket | |
| Floating | Semi-submersible |
| Spar-Buoy | |
| Tension-Leg Platform (TLP) | |
| Barge |
By Turbine Capacity
| Up to 3 MW |
| 3 to 6 MW |
| Above 6 MW |
By Application
| Utility-scale |
| Commercial and Industrial |
| Community Projects |
By Component (Qualitative Analysis)
| Nacelle/Turbine |
| Blade |
| Tower |
| Generator and Gearbox |
| Foundations |
| Balance-of-System |
| Others (Installation, Vessels, O&M) |
By Geography
| North America | United States |
| Rest of North America | |
| Europe | Germany |
| France | |
| United Kingdom | |
| Spain | |
| NORDIC Countries | |
| Italy | |
| Netherlands | |
| Belgium | |
| Rest of Europe | |
| Asia-Pacific | China |
| India | |
| Japan | |
| South Korea | |
| Vietnam | |
| Rest of Asia-Pacific | |
| South America | Brazil |
| Argentina | |
| Rest of South America | |
| Middle East and Africa | Saudi Arabia |
| United Arab Emirates | |
| South Africa | |
| Rest of Middle East and Africa |
| By Foundation Type | Fixed | Monopile |
| Jacket | ||
| Gravity-Based | ||
| Tripod/Tripile | ||
| Suction Bucket | ||
| Floating | Semi-submersible | |
| Spar-Buoy | ||
| Tension-Leg Platform (TLP) | ||
| Barge | ||
| By Turbine Capacity | Up to 3 MW | |
| 3 to 6 MW | ||
| Above 6 MW | ||
| By Application | Utility-scale | |
| Commercial and Industrial | ||
| Community Projects | ||
| By Component (Qualitative Analysis) | Nacelle/Turbine | |
| Blade | ||
| Tower | ||
| Generator and Gearbox | ||
| Foundations | ||
| Balance-of-System | ||
| Others (Installation, Vessels, O&M) | ||
| By Geography | North America | United States |
| Rest of North America | ||
| Europe | Germany | |
| France | ||
| United Kingdom | ||
| Spain | ||
| NORDIC Countries | ||
| Italy | ||
| Netherlands | ||
| Belgium | ||
| Rest of Europe | ||
| Asia-Pacific | China | |
| India | ||
| Japan | ||
| South Korea | ||
| Vietnam | ||
| Rest of Asia-Pacific | ||
| South America | Brazil | |
| Argentina | ||
| Rest of South America | ||
| Middle East and Africa | Saudi Arabia | |
| United Arab Emirates | ||
| South Africa | ||
| Rest of Middle East and Africa | ||


Key Questions Answered in the Report
How large will the offshore wind energy market be by 2031?
Installed capacity is forecast to reach 291.63 GW, up from 111.07 GW in 2026, reflecting a 21.30% CAGR.
Which region is growing fastest in offshore wind?
North America shows the steepest growth path with an expected 103.6% CAGR through 2031, driven by U.S. federal and state procurement targets.
Why are 15 MW-plus turbines critical for cost reduction?
Larger machines cut foundation and cable counts roughly 40% per gigawatt, trimming LCOE toward USD 0.060/kWh and improving project returns.
What is the main bottleneck for new offshore wind projects?
A shortage of heavy-lift installation vessels capable of handling 15 MW turbines is inflating day-rates and delaying schedules by up to two years.
How do corporate PPAs influence offshore wind build-out?
Long-term power purchase agreements from large corporates provide premium, subsidy-independent revenue streams that accelerate financing, especially for floating projects.
What market share do floating foundations have today?
Floating platforms currently account for less than 1% of installations but are growing at an 42.1% CAGR and could gain double-digit share by 2031.
Page last updated on:


