Waveguide Market Size and Share
Market Overview
| Study Period | 2019 - 2030 |
|---|---|
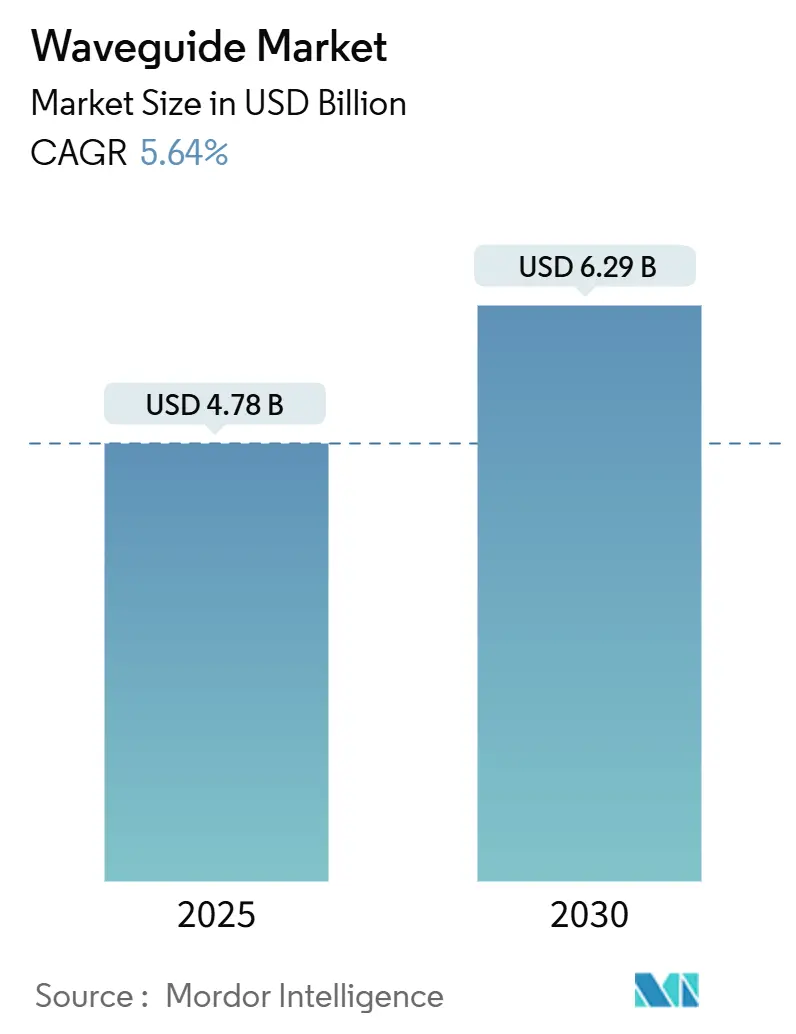
| Market Size (2025) | USD 4.78 Billion |
| Market Size (2030) | USD 6.29 Billion |
| Growth Rate (2025 - 2030) | 5.64% CAGR |
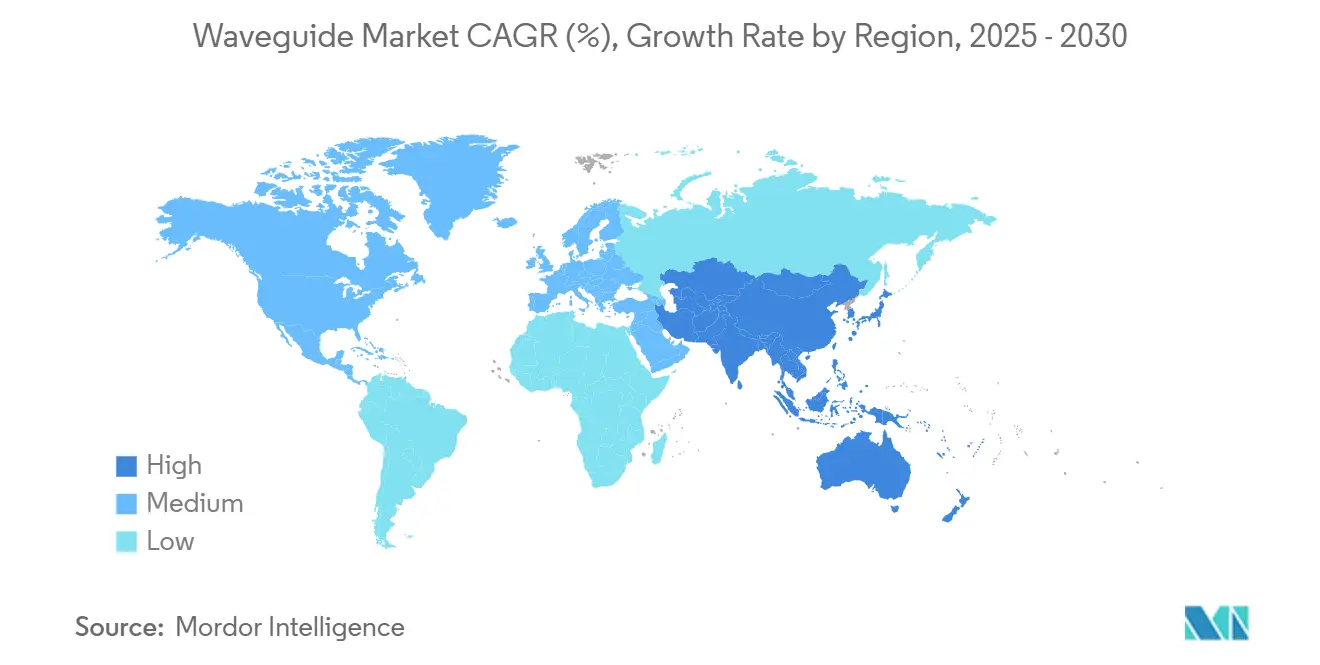
| Fastest Growing Market | Asia Pacific |
| Largest Market | Asia Pacific |
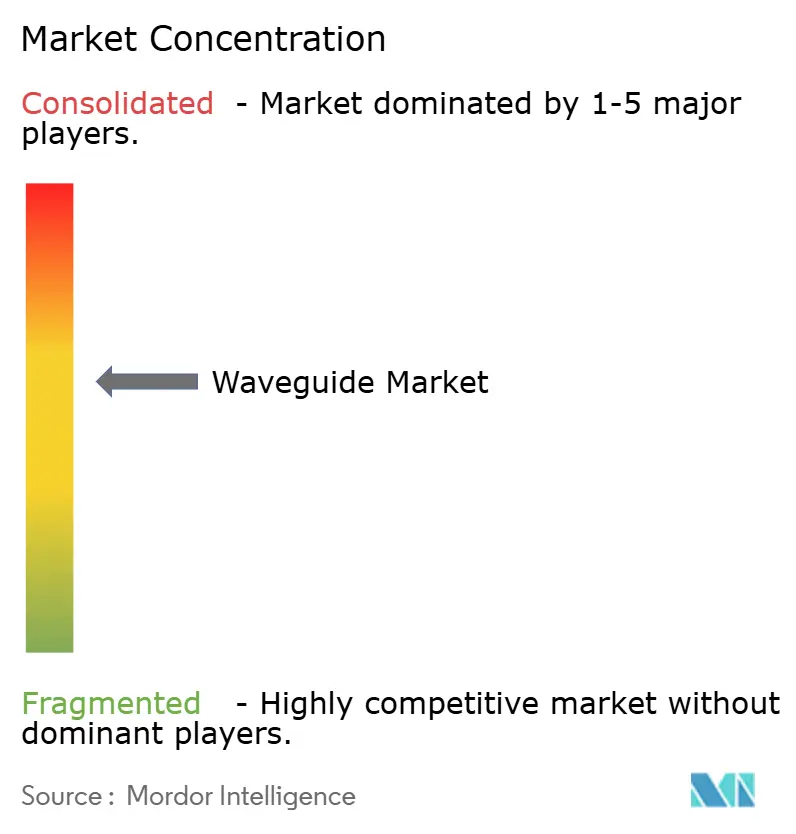
| Market Concentration | Medium |
Major Players *Disclaimer: Major Players sorted in no particular order Image © Mordor Intelligence. Reuse requires attribution under CC BY 4.0. | |
Waveguide Market Analysis by Mordor Intelligence
The waveguide market size is estimated at USD 4.78 billion in 2025 and is projected to reach USD 6.29 billion by 2030, representing a 5.64% CAGR over the forecast period. Heightened 5G rollouts, vigorous adoption of data-center optical interconnects, and the commercialization of laboratory-grade photonic technologies are shaping demand. Momentum builds as silicon photonics converges with traditional metallic structures, prompting suppliers to strike a balance between mechanical robustness and the demands for miniaturized, high-frequency performance. Intensifying competition among defense primes, semiconductor foundries, and Asian contract manufacturers is shifting bargaining power toward firms that unify RF heritage with wafer-level scale. Opportunities also expand across medical devices and consumer AR, where dielectric waveguides unlock lighter form factors and sharper optics.
Key Report Takeaways
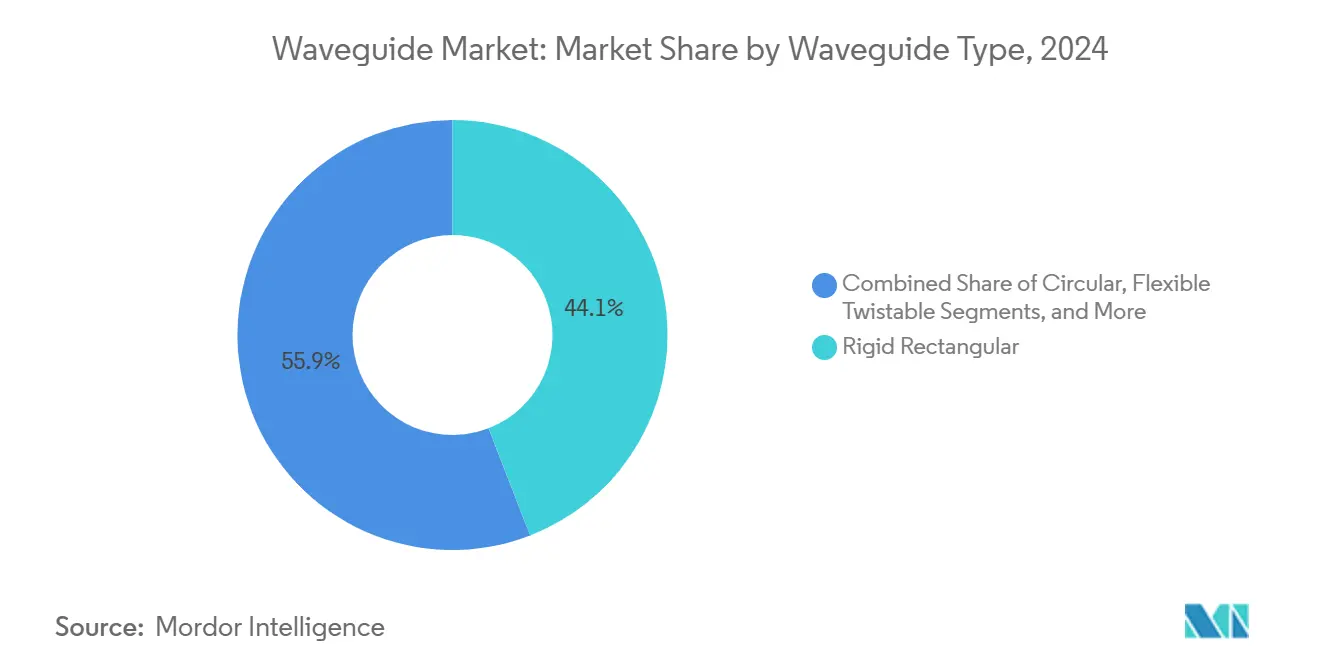
- By waveguide type, rigid rectangular designs accounted for 44.12% of the waveguide market share in 2024, while dielectric integrated variants are projected to advance at a 6.15% CAGR through 2030.
- By frequency band, X-band captured 28.68% share of the waveguide market size in 2024, and Ka-band solutions are forecast to widen at a 7.38% CAGR through 2030.
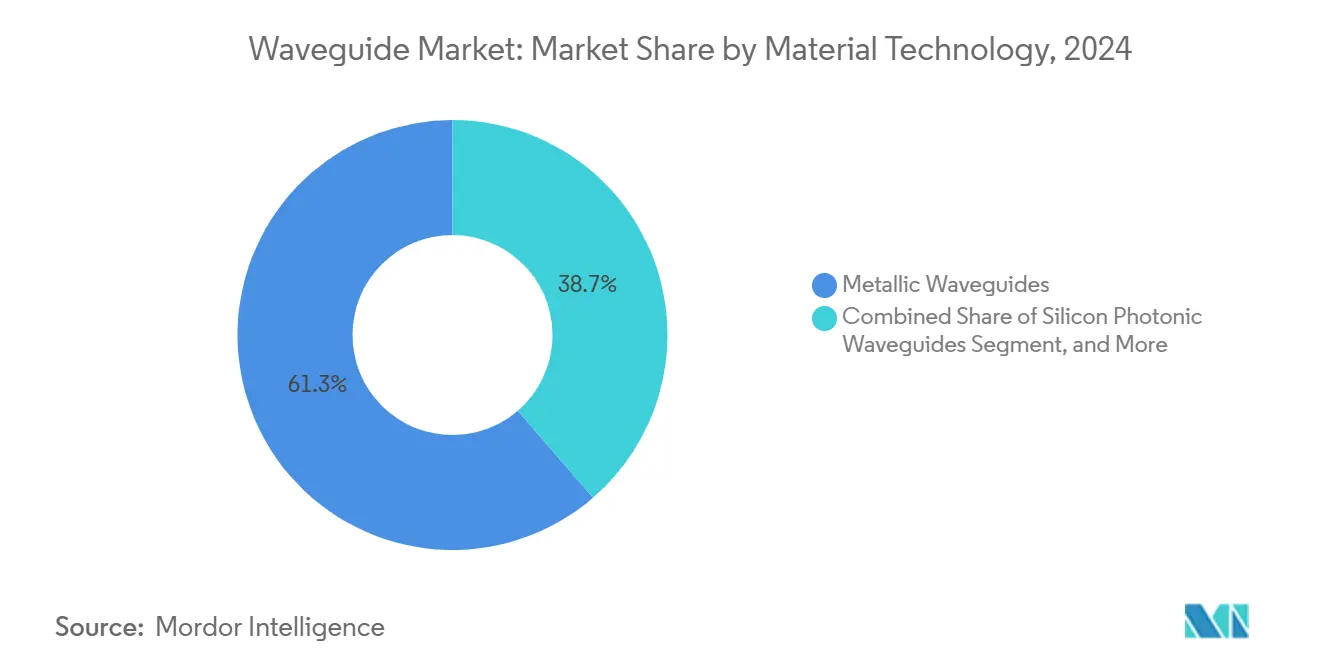
- By material technology, metallic platforms commanded 61.34% of the waveguide market share in 2024, whereas silicon photonic waveguides are set to post a 7.43% CAGR to 2030.
- By end-user industry, the defense and aerospace sector accounted for a 37.29% share of the waveguide market size in 2024, and telecommunications and data centers are expected to exhibit the fastest growth at a 5.73% CAGR to 2030.
- By geography, Asia Pacific led with 34.74% revenue share in 2024; the region is on track for a 6.26% CAGR through 2030.
Global Waveguide Market Trends and Insights
Drivers Impact Analysis*
| Driver | (~) % Impact on CAGR Forecast | Geographic Relevance | Impact Timeline |
|---|---|---|---|
| Proliferation of 5G and Beyond Wireless Infrastructure | +1.2% | Global, with APAC and North America leading | Medium term (2-4 years) |
| Rapid Expansion of Data Center Optical Interconnects | +0.8% | North America and Europe core, expanding to APAC | Short term (≤ 2 years) |
| Growing Adoption of Advanced Radar Systems in Defense | +0.6% | North America, Europe, and select APAC markets | Long term (≥ 4 years) |
| Rising Demand for AR/VR Wearables With Waveguide Displays | +0.4% | Global, with early adoption in North America and Europe | Medium term (2-4 years) |
| Commercialization of Topological Photonic Waveguides for Terahertz Links | +0.3% | Research hubs in North America, Europe, and East Asia | Long term (≥ 4 years) |
| Supply Chain Localization Initiatives for Military-Grade Waveguide Components | +0.2% | North America and Europe primarily | Medium term (2-4 years) |
| Source: Mordor Intelligence | |||
Proliferation of 5G and Beyond Wireless Infrastructure
Embryonic 6G research and dense 5G millimeter-wave cells are exposing coaxial limits above 24 GHz, steering operators toward precision-machined waveguide components that reduce loss across massive MIMO antenna arrays. Hybrid waveguide-antenna integration embeds RF conduits into substrates, shrinking insertion loss that once curbed urban coverage. Open RAN adoption magnifies the benefit because interoperable interfaces demand consistent mechanical tolerances. Suppliers capable of batch-processing rectangular runs while meeting telecom cost benchmarks are primed to win multi-vendor base-station sockets. Urban densification further increases volume, as every small cell requires repeatable Ka-band links.
Rapid Expansion of Data Center Optical Interconnects
Bandwidth escalation beyond 100 Gbps per lane forces hyperscalers to transition from copper traces to silicon photonic waveguides, which reduce energy per bit even though they incur a higher upfront device cost. Microsoft and Google now qualify co-packaged optics, embedding waveguides with ASICs to conserve board area and latency. AI training clusters intensify memory disaggregation, turning low-loss optical channels into a practical choice for coherent GPU fabrics. Adoption curves sharpen as 51.2 Tbps switch generations roll out, anchoring silicon photonics on every rack unit and locking in long-term volume for foundries that master wafer-level modulators.
Growing Adoption of Advanced Radar Systems in Defense
Multi-function radar modernization requires waveguide assemblies that can withstand the high power density of gallium-nitride and support agile beam steering across wide instantaneous bandwidths.[1]U.S. Department of Defense, “Radar Modernization Investments,” defense.gov Contractors must reconcile extreme thermal loads with low passive intermodulation, prompting the development of new brazing alloys and internal coolant channels to achieve this balance. Hypersonic threat scenarios are increasing Ka-band usage, driving demand for distortion-free bends and surface finish targets of less than 0.4 micrometers. Reconfigurable assemblies that swap mission modes through integrated PIN diode surfaces reduce lifecycle costs and align with the directives of modular open systems architecture.
Rising Demand for AR/VR Wearables With Waveguide Displays
Waveguide combiners enable compact optics that achieve a 50-degree field of view without requiring heavy glass, which explains Meta and Apple's investments in nano-imprint lithography and micro-OLED emitters. Diffractive patterns now balance brightness uniformity against chromatic dispersion, inching toward mass-production yields near 60%. Precision glass molding houses race to scale twelve-inch blanks while sustaining ±25 nanometer thickness control. Consumer form-factor pressure compresses design cycles, so suppliers offering turnkey opto-mechanical simulation, along with pilot fabrication, achieve preferred-vendor status.
Restraints Impact Analysis*
| Restraint | (~) % Impact on CAGR Forecast | Geographic Relevance | Impact Timeline |
|---|---|---|---|
| High Manufacturing Cost of Precision Waveguide Machining | -0.7% | Global, particularly affecting smaller manufacturers | Short term (≤ 2 years) |
| Stringent Thermal Management Constraints at Millimeter-Wave Bands | -0.5% | Global, with greater impact in high-power applications | Medium term (2-4 years) |
| Scarcity of Ultra-Low Loss Lithography Capacity for Lithium Niobate on Insulator | -0.3% | North America and Europe primarily, limited APAC impact | Long term (≥ 4 years) |
| Emergent Polymer Waveguide Reliability Concerns in Long-Term Implantables | -0.2% | Global, with focus on medical device markets | Medium term (2-4 years) |
| Source: Mordor Intelligence | |||
High Manufacturing Cost of Precision Waveguide Machining
Surface-finish specifications below 0.2 micrometer for Ka-band flanges oblige machine-tool investments topping USD 2 million per five-axis cell, a barrier for small contractors. Setup expense balloons in low-volume defense runs, lifting part cost share above 50% of program budgets. Powder-bed additive routes cannot yet meet roughness and dimensional stability metrics, causing a production bifurcation that slows broader waveguide market penetration in niche avionics.
Stringent Thermal Management Constraints at Millimeter-Wave Bands
Thermal gradients distort waveguide joints by microns and degrade VSWR at frequencies above 40 GHz, forcing designers to adopt costly invar or carbon composites that complicate the joining process.[2]IEEE Editorial Board, “Thermal Challenges in Millimeter-Wave Systems,” ieee.org Active cooling adds weight, lowers reliability, and narrows spacecraft payload margins. The trade-off between heat mitigation and assembly complexity delays adoption in commercial high-power SATCOM terminals.
*Our forecasts treat driver/restraint impacts as directional, not additive. The impact forecasts reflect baseline growth, mix effects, and variable interactions.
Segment Analysis
By Waveguide Type: Miniaturization Drives Integration Trends
Rigid rectangular conduits captured 44.12% of the global revenue in 2024, underscoring their unmatched power-handling capabilities in defense radar shelters that require peak levels exceeding 20 kW. This category anchors the waveguide market; however, its share is projected to decline as dielectric integrated lines post a 6.15% CAGR through 2030, reflecting the shift toward lighter enclosures in consumer XR headgear. In segment totals, rigid formats still account for the largest slice of the waveguide market share across high-value defense contracts.[3]L3Harris Technologies, “Waveguide Integration for Defense,” l3harris.com
Momentum now tilts toward integrated dielectric stacks that embed RF pathways into substrates, leveraging semiconductor photolithography. Weight savings of over 70% and bend radii of less than 2 mm open design latitude for medical catheters and mmWave antennas used in smartphones. As fabs replicate rectangular cavities on 200 mm silicon, per-unit economics improve once volumes exceed 100,000 units. This pattern showcases how the waveguide market aligns with mobile and medical end-markets that reward compact profiles.


By Frequency Band: Ka-Band Emergence Reshapes Applications
X-band dominated 28.68% of 2024 spending by virtue of legacy radar fleets and GEO broadcast payloads. The waveguide market share lead persists through ongoing service contracts; however, Ka-band lanes deliver the steepest 7.38% CAGR, driven by LEO broadband constellations that favor 26-40 GHz for smaller antennas. Waveguide assemblies at these bands incorporate dielectric-filled bends and precision couplers to mitigate atmospheric loss while maintaining link budgets.
Ka-band development transforms the waveguide industry because ground terminals and phased arrays now require cost targets aligned with those of consumer satellite modems. Volume ramps push machine shops to shorten lead times and automate in-process inspection. Over the forecast, Ka-band shipments bridge low-earth mobile backhaul and next-gen aircraft connectivity, cementing its status as the primary growth vertical and enlarging the waveguide market size for high-frequency materials.
By Material Technology: Silicon Photonics Accelerates Integration
Metallic paths kept a 61.34% stronghold in 2024, anchored by defense and high-power SATCOM, where copper and aluminum handle heat loads at rated propagating modes. This branch of the waveguide market remains essential for peak power missions, but silicon photonic conduits are expected to record a 7.43% CAGR as wafer-scale integration slashes latency while reducing energy per transported bit. The transition gains steam as co-packaged optics becomes mainstream among hyperscalers.
Lithium-niobate-on-insulator modulators widen the material palette by enabling sub-volt drive swings at 100 GHz bandwidth, yet lithography bottlenecks cap throughput. Polymer options are entering wearable biosensing, where flexibility and biocompatibility matter more than insertion loss. Collectively, diverse materials reinforce a multipolar supply chain, expanding the addressable waveguide market size and compelling suppliers to master cross-disciplinary process know-how.
By End-User Industry: Telecommunications Convergence Accelerates
Defense and aerospace retained 37.29% of the revenue in 2024 as waveguide-dense radar platforms secured funding continuity. However, telecom and data-center buyers are predicted to grow at the fastest rate, with a 5.73% CAGR, due to 5G small-cell densification and AI cluster optical fabrics. Their rising share steers production from bespoke machined runs toward wafer-level repeatability, signaling that semiconductor expertise will increasingly define competitive advantage across the waveguide market.
Life-sciences firms are piloting polymer conduits for endoscopy and neurological stimulation, underscoring the industry’s outward expansion. Mobile OEMs are testing glass and plastic combiners for forthcoming AR spectacles, which will stimulate high-volume runs never seen in legacy military programs. Cross-domain adoption thereby redistributes demand and elevates the total waveguide market size beyond classic RF confines.
Geography Analysis
Asia Pacific led with 34.74% of 2024 revenue and is projected to post a 6.26% CAGR to 2030, reflecting coordinated investments in semiconductor capacity and 5G infrastructure. Chinese foundries emulate U.S. silicon photonic lines, while Japanese and South Korean vendors supply ultra-flat glass and high-purity metals used in premium radar builds. Belt and Road telecom projects further lift unit volumes, embedding waveguide footprints across network roll-outs from Jakarta to Nairobi.
North America defends its share through defense and advanced research programs backed by the CHIPS Act, which subsidizes photonic and microwave fabs.[4]U.S. Department of Commerce, “CHIPS Act Photonic Funding,” commerce.gov Hyperscale cloud operators amplify domestic demand as AI clusters proliferate optical backplanes. Canada’s carriers push mmWave last-mile trials, and Mexican EMS providers extend machining capacity for cost-sensitive telecom subassemblies. Collectively, the region sustains strong unit value despite lower shipment totals compared with APAC.
Europe leverages its automotive radar leadership, particularly in Germany, to sustain steady orders for 76-81 GHz flex-twistable conduits, while EU Green Deal funding spurs the adoption of energy-efficient backhaul gear. Defense programs in France and Italy broaden the mix with airborne AESA projects. Meanwhile, Benelux photonic clusters cultivate indium-phosphide expertise, expanding the regional waveguide market size through high-speed optical engines for metro routers.

Competitive Landscape
The waveguide market exhibits moderate fragmentation, with defense stalwarts like L3Harris and Teledyne dominating high-power niches, while semiconductor heavyweights such as Intel and GlobalFoundries are advancing into photonic integration. Competitive intensity rises where wafer-level economics collide with traditional precision machining. Players able to fuse photonic device design, microwave simulation, and automated assembly secure strategic leverage.
Consolidation trends involve vertical integration, with foundries acquiring packaging houses and defense OEMs purchasing specialty waveguide shops to secure their supply chains. Artificial-intelligence-driven design optimization slashes development cycles by predicting mode purity and thermal drift, distinguishing firms that harness data to enhance yield. Standards committees at IEEE shape interface definitions, allowing early participants to gain mindshare and influence future procurement templates.
White-space opportunities persist in biomedical implantables, consumer AR displays, and autonomous vehicle radar. Start-ups offering polymer or glass solutions for a flexible environment gain fast-track entry. Meanwhile, established primes align with government localization drives, shielding core defense lines from external shocks and maintaining their pivotal role in the overall waveguide market.
Waveguide Industry Leaders
L3Harris Technologies Inc.
Teledyne Technologies Incorporated
Eravant Inc.
M2 Global Technology Ltd.
Pasternack Enterprises Inc.
- *Disclaimer: Major Players sorted in no particular order

Recent Industry Developments
- October 2025: Intel Corporation announced a USD 500 million silicon photonics capacity expansion in Ireland to meet co-packaged optics demand for AI data centers.
- September 2025: L3Harris Technologies secured a USD 750 million U.S. Air Force contract for next-generation Ka-band radar waveguide systems.
- August 2025: GlobalFoundries partnered with Marvell Technology on silicon-photonic co-packaged optics for hyperscale switches.
- July 2025: TSMC announced a USD 2.8 billion investment in photonic semiconductors in Taiwan, including lithium-niobate waveguide lines.


Global Waveguide Market Report Scope
| Rigid Rectangular |
| Circular |
| Flexible Twistable |
| Dielectric Integrated |
| C-Band |
| X-Band |
| Ku-Band |
| Ka-Band and Above |
| Metallic Waveguides |
| Silicon Photonic Waveguides |
| Polymer and Biopolymer Waveguides |
| Lithium Niobate on Insulator Waveguides |
| Defense and Aerospace |
| Telecommunications and Data Centers |
| Medical and Biomedical |
| Industrial and Manufacturing Automation |
| Consumer Electronics and XR |
| North America | United States |
| Canada | |
| Mexico | |
| South America | Brazil |
| Argentina | |
| Rest of South America | |
| Europe | Germany |
| United Kingdom | |
| France | |
| Italy | |
| Spain | |
| Russia | |
| Rest of Europe | |
| Asia Pacific | China |
| Japan | |
| India | |
| South Korea | |
| Australia and New Zealand | |
| Rest of Asia Pacific | |
| Middle East | Saudi Arabia |
| United Arab Emirates | |
| Turkey | |
| Rest of Middle East | |
| Africa | South Africa |
| Nigeria | |
| Kenya | |
| Rest of Africa |
| By Waveguide Type | Rigid Rectangular | |
| Circular | ||
| Flexible Twistable | ||
| Dielectric Integrated | ||
| By Frequency Band | C-Band | |
| X-Band | ||
| Ku-Band | ||
| Ka-Band and Above | ||
| By Material Technology | Metallic Waveguides | |
| Silicon Photonic Waveguides | ||
| Polymer and Biopolymer Waveguides | ||
| Lithium Niobate on Insulator Waveguides | ||
| By End-User Industry | Defense and Aerospace | |
| Telecommunications and Data Centers | ||
| Medical and Biomedical | ||
| Industrial and Manufacturing Automation | ||
| Consumer Electronics and XR | ||
| By Geography | North America | United States |
| Canada | ||
| Mexico | ||
| South America | Brazil | |
| Argentina | ||
| Rest of South America | ||
| Europe | Germany | |
| United Kingdom | ||
| France | ||
| Italy | ||
| Spain | ||
| Russia | ||
| Rest of Europe | ||
| Asia Pacific | China | |
| Japan | ||
| India | ||
| South Korea | ||
| Australia and New Zealand | ||
| Rest of Asia Pacific | ||
| Middle East | Saudi Arabia | |
| United Arab Emirates | ||
| Turkey | ||
| Rest of Middle East | ||
| Africa | South Africa | |
| Nigeria | ||
| Kenya | ||
| Rest of Africa | ||


Key Questions Answered in the Report
How large is the global waveguide market in 2025?
The waveguide market size is USD 4.78 billion in 2025 with a projected move to USD 6.29 billion by 2030.
Which waveguide type leads by revenue today?
Rigid rectangular formats hold 44.12% share due to entrenched use in high-power radar and satellite links.
What segment is growing fastest through 2030?
Dielectric integrated waveguides are set for a 6.15% CAGR as miniaturization needs rise in electronics and medical devices.
Which region commands the greatest share?
Asia Pacific leads with 34.74% of 2024 revenue, supported by expansive 5G builds and semiconductor capacity.
How will silicon photonics influence future demand?
Silicon photonic waveguides deliver a 7.43% CAGR because co-packaged optics cut data-center power draw and latency.
What is the main production challenge at millimeter-wave bands?
Maintaining surface finish within sub-micrometer tolerances drives high machining costs and lengthens lead times.
Page last updated on:


