
Market Overview
| Study Period | 2021 - 2031 |
|---|---|
| Market Size (2026) | USD 22.92 Billion |
| Market Size (2031) | USD 32.08 Billion |
| Growth Rate (2026 - 2031) | 6.96 % |
| Fastest Growing Market | Asia Pacific |
| Largest Market | Asia Pacific |
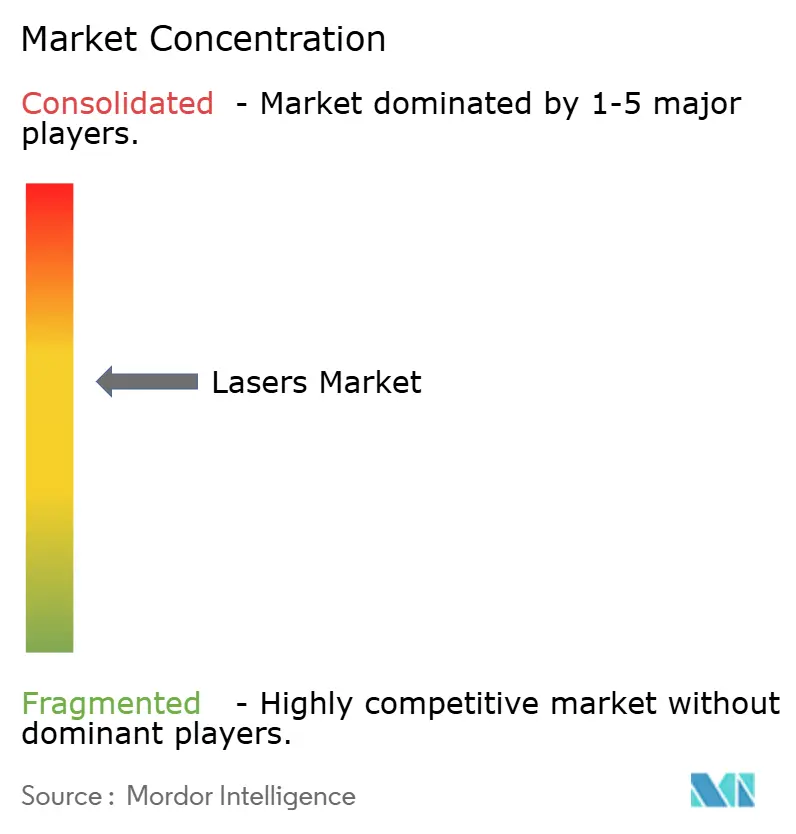
| Market Concentration | Medium |
Major Players *Disclaimer: Major Players sorted in no particular order Image © Mordor Intelligence. Reuse requires attribution under CC BY 4.0. | |
Lasers Market Analysis by Mordor Intelligence
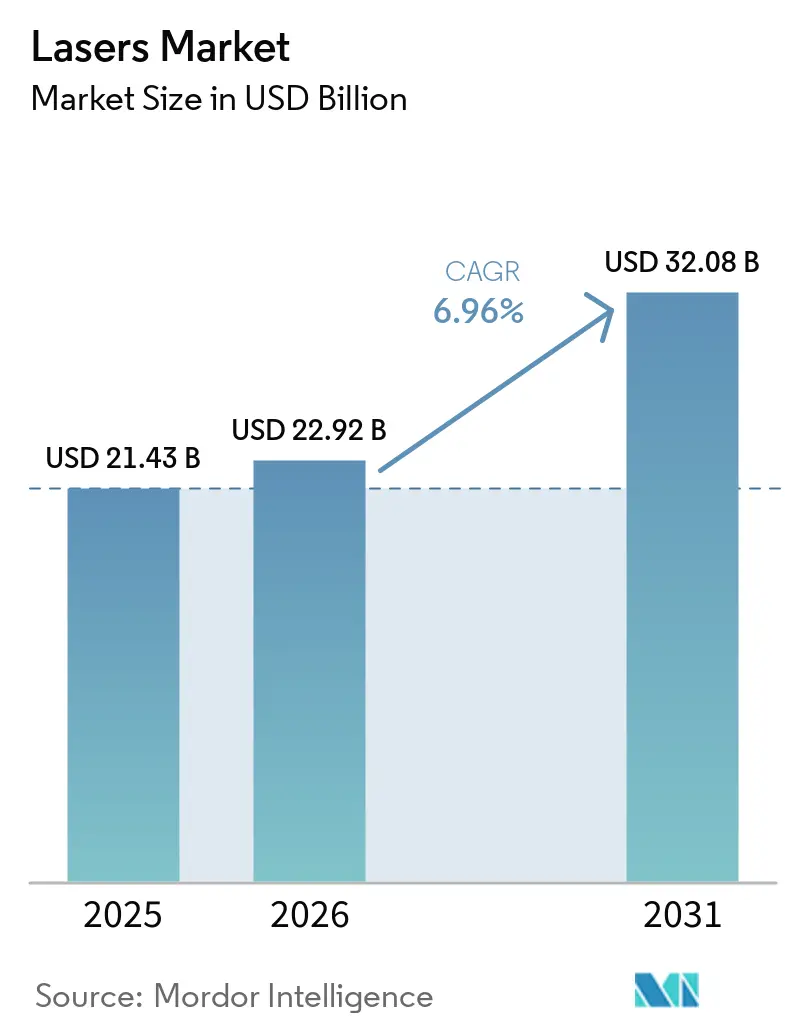
The lasers market size is expected to grow from USD 21.43 billion in 2025 to USD 22.92 billion in 2026 and is forecast to reach USD 32.08 billion by 2031 at 6.96% CAGR over 2026-2031. This expansion reflects rising deployment across precision micromachining, additive manufacturing, autonomous mobility, and next-generation display production. Ultrafast pulse sources that machine sub-10 nm semiconductor features and kW-class fiber systems that cut thicker metal sheets are now mainstream in high-volume factories. Government-funded photonics clusters accelerate ecosystem development in Asia-Pacific, while additive manufacturing lasers lower material waste in aerospace components and shorten production cycles. Supply chain risks around gallium, germanium, and indium phosphide substrates remain a headwind, yet innovations in thermal management and beam-combining architectures continue to raise attainable power ceilings.
Key Report Takeaways
- By laser type, fiber lasers commanded 41.40% revenue share of the global lasers market in 2025, while solid-state lasers are accelerating at a 9.18% CAGR to 2031.
- By application, materials processing led with 30.10% share of the global lasers market size in 2025; sensors are projected to expand at an 8.58% CAGR through 2031.
- By power output, medium-power systems captured 43.60% of the global lasers market share in 2025, whereas high-power units are advancing at an 8.74% CAGR to 2031.
- By mode of operation, continuous-wave sources held 59.10% share of the global lasers market size in 2025; pulsed lasers posted the fastest growth at 9.03% CAGR.
- By end-user industry, electronics and semiconductor players accounted for 25.10% revenue in 2025; automotive manufacturing shows the strongest momentum with a 8.96% CAGR toward 2031.
- By geography, Asia-Pacific dominated with 46.40% share in 2025 and is anticipated to grow at 8.17% CAGR through 2031, buoyed by semiconductor and display manufacturing hubs.
Note: Market size and forecast figures in this report are generated using Mordor Intelligence’s proprietary estimation framework, updated with the latest available data and insights as of 2026.
Market Trends and Insights
Drivers Impact Analysis of Lasers Market*
| Driver | (~)% Impact on CAGR Forecast | Geographic Relevance | Impact Timeline |
|---|---|---|---|
| Surging demand for high-precision micromachining in semiconductor back-end packaging | +1.2% | Asia-Pacific core, spill-over to North America | Medium term (2-4 years) |
| Growing adoption of additive manufacturing lasers for aerospace super-alloy parts | +0.8% | North America and Europe, expanding to APAC | Long term (≥ 4 years) |
| Rising installation of LiDAR lasers in autonomous mobility stacks | +1.0% | Global, with early gains in North America, Europe, China | Medium term (2-4 years) |
| Expanding use of ultrafast lasers for next-gen OLED and micro-LED display repair | +0.6% | Asia-Pacific dominance, selective North America adoption | Short term (≤ 2 years) |
| Government-funded photonics clusters driving regional manufacturing ecosystems | +0.4% | North America, Europe, selective APAC regions | Long term (≥ 4 years) |
| Rapid price/performance improvements in kW-class fiber lasers for sheet-metal cutting | +0.7% | Global, with manufacturing concentration in Asia-Pacific | Medium term (2-4 years) |
| Source: Mordor Intelligence | |||


Surging Demand for High-Precision Micromachining in Semiconductor Back-End Packaging
Fan-Out Wafer Level Packaging and Through-Glass Via processes specify femtosecond and excimer sources that deliver sub-10 µm features with under-1% pulse-to-pulse energy deviation, ensuring uniform via formation across full 300 mm wafers[1]Gigaphoton, “Deep-UV Excimer Lasers for Leading-Edge Lithography,” gigaphoton.com. Replacing wire bonding with laser-formed micro-bumps reduces interconnect resistance by 40% and opens the path to three-dimensional chip stacks. Beam-shaping modules synchronized with in-situ monitoring raise yield and lower scrap rates in high-volume fabs. Asia-Pacific foundries continue to procure turnkey laser stations, creating a substantial pull on ultrafast source suppliers. As packaging line takt times tighten, demand for even higher repetition rates is expected to lift average selling prices in the premium ultrafast tier.
Growing Adoption of Additive Manufacturing Lasers for Aerospace Super-Alloy Parts
Aerospace primes now qualify powder-bed-fusion fiber lasers that process titanium aluminide and nickel super-alloys at material utilization rates above 95%, sharply outperforming subtractive machining[2]Civan Lasers, “Dynamic Beam Laser Welding Results,” civanlasers.com. Dynamic beam shaping shortens build cycles by 40% and lowers energy consumption by 60%, while maintaining microstructure integrity critical for flight hardware. AS9100 revisions explicitly reference laser-printed parts, simplifying certification workflows. U.S. and European engine programs increasingly design for “print-first” geometries that cannot be machined economically. The shift ties laser demand to wide-body fleet renewal and hypersonic propulsion projects scheduled for late-decade entry into service.
Rising Installation of LiDAR Lasers in Autonomous Mobility Stacks
The first AEC-Q102 qualified 8-channel 915 nm diode array from AMS OSRAM delivers 1,000 W peak optical power with 30% efficiency gains, meeting the reliability envelope for mass-market vehicles[3]AMS OSRAM, “Automotive LiDAR Laser Release,” ams-osram.com. Solid-state beam steering eliminates moving mirrors, reducing part count and boosting ruggedness for automotive duty cycles. Battery-electric models benefit from lower power draw, extending driving range without enlarging battery packs. Beyond passenger cars, municipalities deploy rooftop LiDAR units for smart-city traffic management and robotics fleets. As unit costs fall below USD 200, multiple-sensor configurations become viable for Level-4 autonomy, spurring exponential diode consumption over the forecast window.
Expanding Use of Ultrafast Lasers for Next-Gen OLED and Micro-LED Display Repair
Display fabs integrate femtosecond workstations that excise defective pixels without thermal damage, lifting panel yields by up to 25%[5]Coherent, “Ultrafast Lasers for Display Repair,” coherent.com . The 3000-pixel-per-inch density demanded by premium AR/VR headsets makes mechanical re-work impossible, positioning ultrafast ablation as the only viable repair route. Multi-spot scanning heads now process Gen-10.5 substrates at takt times aligned with LCD lines, shrinking cost differentials. Asian panel makers combine automated defect mapping with closed-loop laser parameters, eliminating manual inspection. North American fabs adopt similar lines for QD-OLED pilot runs, signaling broader geographic uptake in the short term.
Restraints Impact Analysis of Lasers Market*
| Restraint | (~)% Impact on CAGR Forecast | Geographic Relevance | Impact Timeline |
|---|---|---|---|
| Persistent shortages of high-grade gallium arsenide/indium phosphide epi-wafers | -0.9% | Global, with acute impact on Asia-Pacific and North America | Medium term (2-4 years) |
| Export-control regimes limiting high-power laser shipments to certain countries | -0.5% | Global, with selective regional restrictions | Long term (≥ 4 years) |
| Thermal-management challenges above 30 kW limiting cutting-thickness roadmap | -0.4% | Global, concentrated in industrial manufacturing regions | Medium term (2-4 years) |
| Fragmented safety standards increasing certification costs for OEMs | -0.3% | Global, with varying regional compliance requirements | Short term (≤ 2 years) |
| Source: Mordor Intelligence | |||
Persistent Shortages of High-Grade Gallium Arsenide/Indium Phosphide Epi-Wafers
Export curbs on gallium and germanium intensify the scarcity of compound semiconductor substrates vital for high-power laser diodes. Variability in thermal conductivity across lots forces laser makers into lengthy re-qualification cycles, delaying shipments and elevating inventory buffers. Start-ups in North America and Europe plan new crystal-growth fabs, but tooling lead times and process know-how push meaningful volumes past 2027. Premium substrate pricing inflates the bill of materials by double digits, particularly for LiDAR and telecom lasers operating at elevated junction temperatures. Manufacturers are experimenting with silicon-based interposers to stretch the existing epi-wafer supply, yet performance penalties remain non-trivial.
Export-Control Regimes Limiting High-Power Laser Shipments to Certain Countries
Dual-use controls restrict lasers above specific power densities, imposing license cycles that can extend beyond six months and add 5-10% compliance costs. Regional champions in restricted markets seize share with domestically developed alternatives, fragmenting technology standards. Export uncertainty also deters multinational investment in high-power R&D, slowing innovation cadence. Proposed rules covering quantum cascade and free-electron sources widen the scope of regulated items, pushing vendors to tighten end-use monitoring. Long-term, harmonization efforts at Wassenaar may ease barriers, but near-term revenue visibility remains cloudy for suppliers serving sensitive geographies.
*Our forecasts treat driver/restraint impacts as directional, not additive. The impact forecasts reflect baseline growth, mix effects, and variable interactions.
Lasers Market Segment Analysis
By Laser Type:
Fiber Dominance Faces Solid-State ChallengeFiber lasers held 41.40% of the global lasers market in 2025 thanks to robust beam quality, all-fiber architectures, and minimal service needs. Solid-state platforms, however, register the swiftest 9.18% CAGR to 2031 as directed-energy weapons and fusion experiments demand multi-megawatt optical chains. The global lasers market size for solid-state devices is projected to cross USD 5.62 billion by 2031, reflecting defense funding pipelines. Hybrid configurations that splice slab gain media into armored fiber delivery lines help transcend single-fiber power ceilings while preserving brightness. CO₂ sources persist in thick-section cutting, whereas diode lasers expand in pump arrays and direct-write applications. Excimer and UV variants remain indispensable in sub-100 nm semiconductor lithography, anchoring steady demand despite cyclical foundry capex.
Ongoing research into distributed-gain architectures promises power scaling without thermally induced mode instabilities. Free-electron and quantum cascade technologies still occupy niche spectroscopy realms, while laser induced breakdown spectroscopy expands analytical applications, but breakthroughs in compact accelerator structures could eventually democratize mid-infrared access. Safety compliance under IEC 60825-1 shapes enclosure designs, influencing total landed cost in high-automation factories. Vendors that fuse fiber reliability with solid-state punch position themselves to capture outsized share as application boundaries blur.



By Application:
Materials Processing Leadership Under Sensor PressureMaterials processing retained a 30.10% share of the global lasers market in 2025, spanning cutting, welding, drilling, and additive build processes across automotive, aerospace, and general industry. Yet laser sensor deployments, notably LiDAR and spectroscopy modules, post an 8.58% CAGR, poised to narrow the gap by decade-end. Heavy-industry orders remain cyclical, but retrofit programs in brownfield plants sustain baseline volume. In parallel, medical and aesthetic lasers harvest incremental growth from outpatient procedures that favor low invasiveness and quick recovery.
Lithography expenditures hinge on advanced-node ramps at the top foundries, with each EUV scanner embedding multiple high-repetition excimer sources. Next-generation displays rely on ultrafast repair to maintain yield, unlocking higher panel profit margins. Military procurement of high-energy systems for counter-UAS duties injects lumpiness but also elevates public-sector funding for fundamental optics research. As edge and cloud data centers mushroom, optical interconnect demand boosts telecom laser volumes, reinforcing the application mix diversity within the global lasers market.
By Power Output:
Medium-Power Dominance Challenged by High-Power GrowthMedium-power units between 1 kW and 3 kW captured 43.60% of the global lasers market share in 2025, balancing cost and throughput for sheet-metal work. High-power machines above 3 kW notch the quickest 8.74% CAGR as thicker materials and defense systems require deeper penetration. Innovative cold-plate cooling and active fiber diameter tuning push CW outputs past 40 kW without catastrophic mode collapse. The global lasers market size for high-power categories is set to approach USD 10.78 billion by 2031.
Spectral and coherent beam combination methods aggregate dozens of emitters into diffraction-limited spots, overcoming single-aperture constraints. Process control software embeds AI loops that self-optimize parameters based on in-process pyrometry, raising first-pass yield. Meanwhile, sub-1 kW units preserve relevance in marking, ophthalmology, and research, where spot stability outweighs brute power. As duty cycles climb, modular chiller designs simplify field upgrades, extending equipment lifetimes and improving total cost of ownership for job shops.
By Mode of Operation:
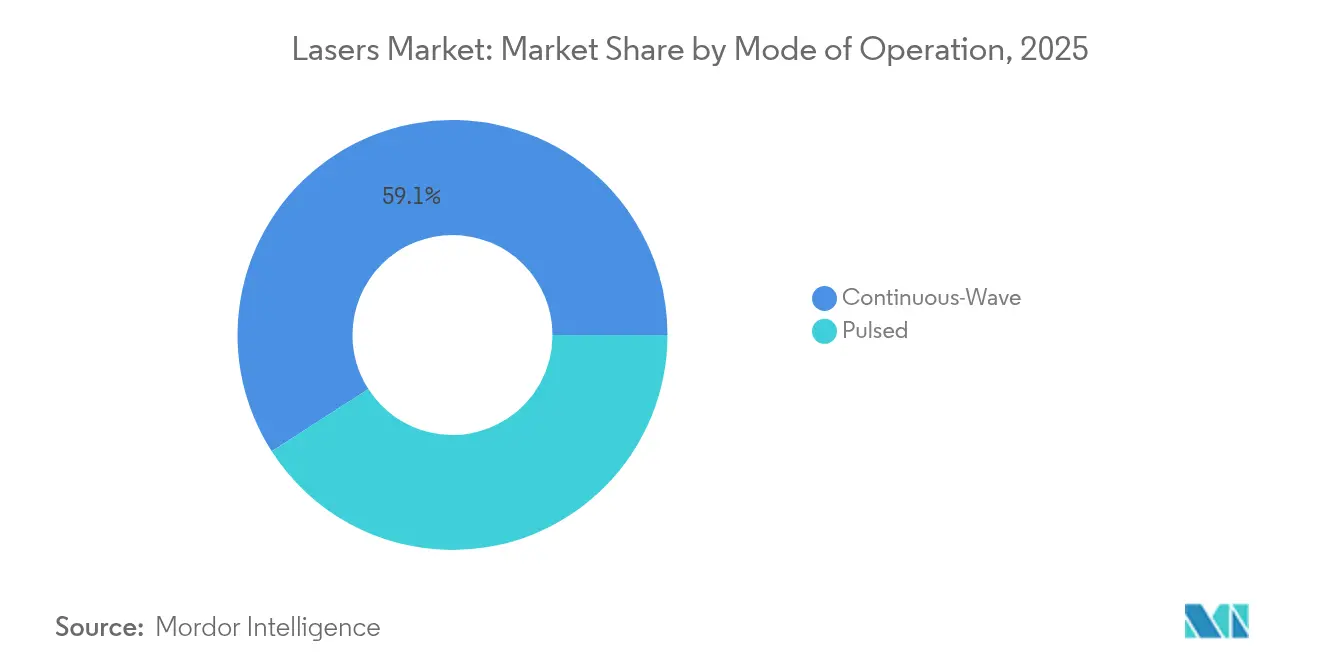
Continuous-Wave Stability Versus Pulsed PrecisionContinuous-wave configurations accounted for 59.10% of 2025 revenue, prized for uniform energy delivery in cutting, welding, and additive builds. Pulsed sources, particularly femtosecond and picosecond regimes, log a 9.03% CAGR by 2031 as semiconductor, medical, and micro-electronics users chase minimal thermal footprints. Dual-mode architectures let operators flip between CW and pulsed within a single head, addressing diverse tasks without hardware swaps.
Higher repetition rates—now surpassing 5 MHz—raise throughput without forfeiting cold-ablation benefits. Quantum cascade lasers employed in pulsed mode sharpen gas-sensing sensitivity, creating opportunities in climate monitoring and petrochemical safety. Adaptive pulse-shaping modules tailor temporal envelopes to material absorption spectra, enhancing process efficiency. As software-defined photonics matures, mode flexibility becomes a critical differentiator in procurement tenders across the global lasers market.
By End-User Industry:
Electronics Leadership Faces Automotive ChallengeElectronics and semiconductor customers represented 25.10% of the global lasers market revenue in 2025, leveraging nanometer-grade beam positioning for wafer dicing, bump formation, and component marking. The industrial lasers market serves several significant end-user segments, including automotive, aerospace and defense, electronics, and semiconductor industries. Automotive OEMs, however, mark the fastest 8.96% CAGR as electric-vehicle battery welding and LiDAR adoption accelerate line retrofits. Industrial machinery builders deploy lasers to achieve lightweight structural designs that satisfy energy-efficiency mandates.
Aerospace and defense programs integrate additive and directed-energy platforms, driving dual-use spillovers into civil production lines. Healthcare providers expand use of dermatology and ophthalmic lasers, benefiting from patient preference for rapid, minimally invasive treatments. Academic and national laboratories sustain demand for exotic wavelengths and bespoke pulse structures, ensuring a pipeline of frontier research that later migrates into commercial markets. The customer mix thus yields a resilient revenue base for suppliers navigating cyclical capital-equipment budgets.
Geography Analysis
APAC Lasers Market
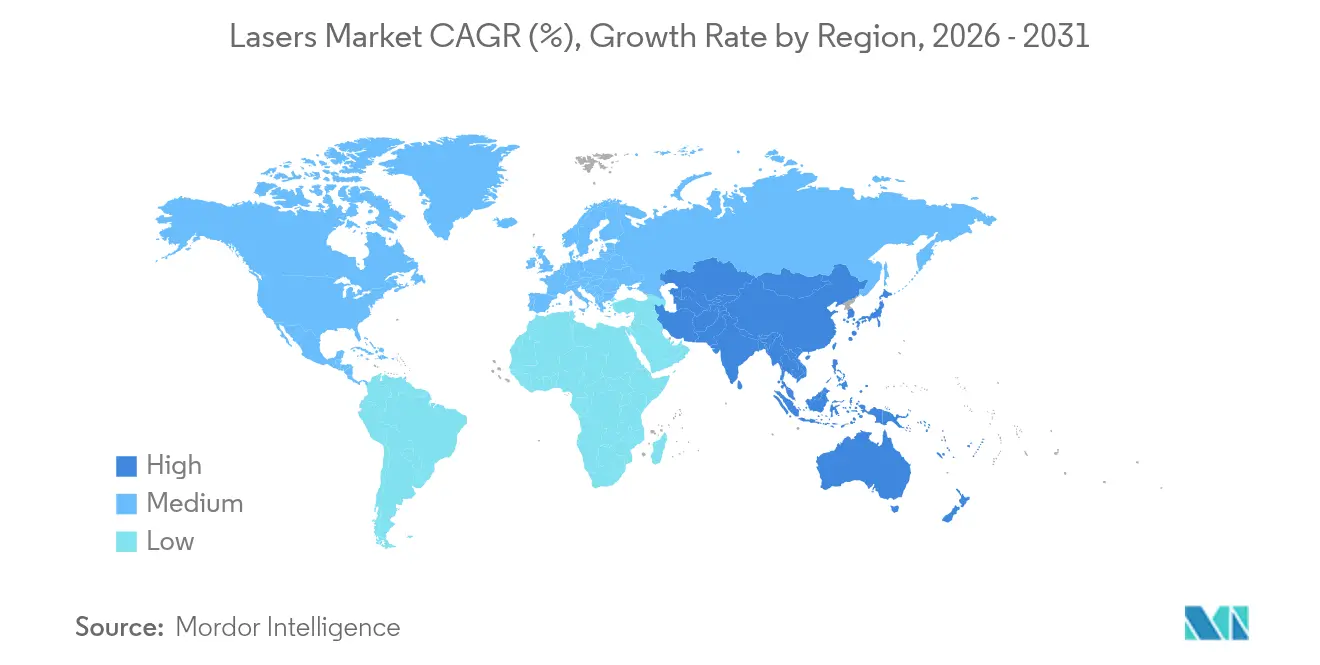
Asia-Pacific controlled 46.40% of the global lasers market in 2025 and is projected to compound at 8.17% CAGR to 2031, propelled by dense semiconductor fabs, burgeoning display lines, and state-backed photonics parks. China leads excimer and ultrafast procurement for advanced lithography nodes, while Japan refines precision machining applications that demand superior beam quality. South Korea’s OLED and micro-LED lines maintain high utilization, feeding sustained laser service contracts. India’s Production-Linked Incentive schemes entice machine-tool makers to localize laser cutting and welding capacities, widening addressable demand. Taiwan and Singapore contribute niche volumes from compound semiconductor and precision engineering clusters, respectively.
North America Lasers Market
North America ranks second, buoyed by aerospace build rates and defense contracts for megawatt-class directed-energy systems. U.S. photonics hubs under the Manufacturing USA umbrella foster start-up formation in integrated photonics and quantum cascade designs. Canada’s materials-science institutes partner with local machine shops to trial laser cladding and hardening, while Mexico’s electric-vehicle corridor scales fiber-laser welding for battery trays. Cross-border supply chains benefit from USMCA harmonization, though export controls constrain outbound shipments of high-power units to certain destinations. Environmental-monitoring mandates also spur domestic demand for mid-infrared gas-sensing modules.
Europe Lasers Market
Europe holds notable share through Germany’s machinery giants and France’s defense integrators that champion high-energy research lasers. The United Kingdom pursues aerospace composites processing with laser ablation to minimize delamination defects, and Italy’s super-car makers adopt multi-kW disk lasers to weld aluminum chassis efficiently. EU-wide regulations, including the Machinery Directive and IEC 60825-1 alignment, shape safety features embedded in export-grade systems. Collaborative programs like DioHELIOS illustrate Europe’s focus on fusion-energy enablers, with consortiums pooling diode-laser expertise to drive cost-effective scaling. Growing green-hydrogen initiatives further elevate interest in laser-based plate cutting and pipe welding across the region.

Regulatory Landscape
Laser systems and components are subject to product-safety performance requirements and dual-use trade controls, which can affect certification lead times and shipment eligibility. In the United States, laser products fall under FDA radiation safety performance standards in 21 CFR Part 1040 (including 21 CFR 1040.10), which sets laser classification and requires safeguards such as protective housings and safety interlocks when access to hazardous radiation could occur during operation or maintenance.
Across major export hubs, OEMs often use alignment to IEC laser safety standards as a compliance path for multi-region customers. IEC 60825-1 (Safety of laser products, equipment classification and requirements) supports hazard classification and labeling practices, and FDA Laser Notice No. 56 outlines an enforcement approach for manufacturers conforming to specified clauses in IEC 60825-1 and IEC 60601-2-22 for relevant products. In the European Union, Regulation (EU) 2021/821 establishes the dual-use export control regime, with Annex I-listed items requiring export authorization, adding screening and licensing steps for certain high-power and sensitive laser categories, as well as related technical assistance.
Value Chain Analysis
The laser value chain starts with upstream raw materials and compound-semiconductor substrates (notably III-V materials such as indium phosphide and related epi-wafers). This is followed by wafer fabrication, device processing (laser diodes, modulators, and integrated photonic components), and module or laser assembly that integrates optics, thermal management, drive electronics, firmware, and safety features. Midstream activity also covers OEM integration into laser heads and systems (fiber, solid-state, excimer/UV, diode, and CO2), along with software and motion-control integration for materials processing, lithography/metrology, and sensing platforms. Downstream channels include capital equipment sales to factories and labs, distribution to integrators and job shops, and long-tail aftermarket service (spares, calibration, field upgrades) that is particularly relevant for high-utilization cutting, welding, and display-repair lines.
Recent capacity and localization moves point to where value is concentrating and where bottlenecks persist. Lumentum announced in March 2026 a new 240,000-square-foot U.S. manufacturing facility in Greensboro, North Carolina, to produce indium phosphide-based optical devices, including continuous-wave and ultra-high-power lasers, highlighting the strategic importance of domestic III-V supply for data-center and networking demand. Coherent also disclosed steps to expand its indium phosphide manufacturing footprint, including a CHIPS and Science Act letter of intent (up to USD 50 million) to expand its 6-inch indium phosphide facility in Sherman, Texas, which reinforces a shift toward vertically integrated, regionally resilient photonics supply. At the same time, the sector remains exposed to concentrated supplier bases for critical components and to constraints in high-precision ultrafast sources, which can extend lead times and re-qualification cycles for semiconductor and advanced packaging tool builders.
Competitive Landscape
Top Companies in Lasers Market
Competition in the global lasers market remains moderately concentrated as the top five vendors secure roughly 50% aggregate share, yet regional challengers chip away through aggressive pricing and localized support. Coherent and IPG Photonics leverage vertically integrated diode and fiber production to shield margins during substrate price spikes. TRUMPF’s AI-enhanced control software, co-developed with SiMa.ai, boosts weld quality monitoring and locks in high-value automotive accounts.
Chinese entrants Raycus and Hans Laser narrow performance gaps, especially in mid-power fiber units tailored to sheet-metal processors. Raycus bundles domestically sourced diodes to sidestep export curbs, undercutting Western rivals in price-sensitive Southeast-Asian markets. Simultaneously, European niche players spearhead ultrafast and mid-infrared innovations, securing patents around dispersion management and monolithic cavity designs.
Strategic partnerships proliferate as ecosystem complexity grows; laser houses pair with optics, AI, and motion-control specialists to deliver turnkey cells. Joint ventures focused on gallium-nitride and indium-phosphide epi-wafer production aim to ease compound-substrate bottlenecks. Overall, intellectual-property breadth, channel reach, and supply-chain resilience differentiate winners, while commodity segments steadily commoditize under cost pressure.
Lasers Industry Leaders
Coherent Corp.
IPG Photonics Corporation
TRUMPF SE + Co. KG
Wuhan Raycus Fiber Laser Technologies Co. Ltd.
Lumentum Holdings Inc.
- *Disclaimer: Major Players sorted in no particular order
Lasers Market Companies Covered in this Report
- Coherent Corp.
- IPG Photonics Corporation
- TRUMPF SE + Co. KG
- nLIGHT, Inc.
- Lumentum Holdings Inc.
- Jenoptik AG
- Novanta, Inc.
- Lumibird SA
- Wuhan Raycus Fiber Laser Technologies Co. Ltd
- Hans Laser Technology Industry Group Co., Ltd.
- Maxphotonics Co., Ltd.
- Keyence Corporation
- EKSPLA UAB
- MKS Instruments, Inc. (Spectra-Physics)
- Panasonic Corporation
- EdgeWave GmbH
- Civan Lasers Ltd.
- Synrad Laser Division
- Amonics Ltd.
- TOPTICA Photonics AG

Market Opportunities and Future Outlook
A visible opportunity set is forming around lasers used for next-generation semiconductor packaging, silicon photonics, and AI-era optical interconnects, where performance constraints are pushing adoption toward higher-power, tighter-linewidth, and more tightly integrated sources. Nuvoton Technology began mass production in May 2026 of a 402 nm, 4.5 W high-power violet laser diode aimed at maskless lithography for advanced packaging, pointing to near-term design-in activity for shorter-wavelength sources in back-end processes. Tower Semiconductor and Scintil Photonics also announced in February 2026 the availability of heterogeneously integrated DWDM laser sources for AI infrastructure using SHIP technology, supporting a pathway where integrated lasers and photonic IC platforms move closer to volume manufacturing for high-bandwidth data links.
Manufacturing scale-up and supply resiliency are further opening whitespace for new capacity, second-sourcing, and localized production of ultrafast and III-V devices. LITILIT broke ground in July 2026 on a femtosecond laser factory in Vilnius targeting 3,000 lasers per year within two years, directly addressing a chokepoint for precision micromachining and advanced semiconductor manufacturing steps. On the system side, industrial users are adopting higher digital integration and more autonomous laser operation, which broadens opportunities for vendors that package lasers with in-process monitoring, AI-driven process control, and turnkey cells rather than stand-alone sources, especially in materials processing and high-throughput electronics manufacturing where uptime, yield, and parameter traceability influence procurement decisions.
Recent Industry Developments in Lasers Market
- June 2026: Coherent announced a letter of intent for up to USD 50 million in CHIPS and Science Act funding to expand its indium phosphide semiconductor manufacturing facility in Sherman, Texas. The move targets greater domestic capacity for critical photonic components used in AI and data-center optical connectivity, tightening supply assurance for high-volume customers and reducing exposure to III-V substrate and device bottlenecks.
- January 2025: AMS OSRAM launched the SPL S8L91A_3 A01, described as an automotive-grade 8-channel 915 nm laser diode array delivering 1,000 W peak optical power with improved efficiency. This strengthens the component base for automotive LiDAR and other sensing stacks, supporting higher channel counts and more robust reliability profiles needed for series-production vehicles.
- December 2024: Amplitude and Focused Energy signed a USD 40 million agreement to co-develop kilojoule-class lasers for inertial-fusion energy. The collaboration raises demand for high-energy, high-precision laser architectures and can accelerate spillover into adjacent high-power and ultrafast design capabilities across the broader laser ecosystem.


Lasers Market Report Scope and Research Methodology
Market Definition and Coverage
For this study, the lasers market covers revenues from laser sources and laser systems that deliver controlled light for industrial processing, communications, medical and cosmetic procedures, research, sensing, display, and defense uses.
Scope exclusions: standalone optics and passive photonics parts that do not generate or amplify laser light are excluded, unless they are bundled with a laser system sale.
Segments Covered in This Report
- By Laser Type
- Fiber Lasers
- Diode Lasers
- CO2 Lasers
- Solid-State Lasers
- Excimer and Ultraviolet Lasers
- Other Types (Quantum Cascade, Free-Electron)
- By Application
- Materials Processing (Cutting, Welding, Drilling)
- Communications and Optical Interconnects
- Medical and Aesthetic
- Lithography and Semiconductor Metrology
- Military and Defense
- Displays (OLED, Micro-LED, Projection)
- Sensors (LiDAR, Spectroscopy)
- Printing and Marking
- By Power Output
- Low-Power (Less than 1 kW)
- Medium-Power (1-3 kW)
- High-Power (More than 3 kW)
- By Mode of Operation
- Continuous-Wave (CW)
- Pulsed (ns, ps, fs)
- By End-User Industry
- Electronics and Semiconductor
- Automotive
- Industrial Machinery
- Healthcare
- Aerospace and Defense
- Research and Academia
- By Geography
- North America
- United States
- Canada
- Mexico
- South America
- Brazil
- Argentina
- Rest of South America
- Europe
- Germany
- United Kingdom
- France
- Italy
- Rest of Europe
- Asia-Pacific
- China
- Japan
- South Korea
- India
- Rest of Asia-Pacific
- Middle East
- Saudi Arabia
- United Arab Emirates
- Rest of Middle East
- Africa
- South Africa
- Rest of Africa
- North America
Data Sources, Market Sizing, and Validation
Desk Research
Desk work starts by setting the market boundary and building the first data spine. We review public sources such as US Census trade series, UN Comtrade, World Bank macro indicators, and national customs dashboards to map import-export flows and currency timing. We also use sources such as the International Electrotechnical Commission (IEC) and the US FDA device databases to sanity-check where adoption is expanding and what segments are subject to regulation.
To add company level context, we read annual reports, 10-K style filings, investor presentations, and audited financial notes, along with trade association publications and reputed press coverage on manufacturing capex cycles. When needed, we also refer to paid subscriptions for company financials and intelligence, patent databases, and shipment level import-export data to validate key assumptions. The sources listed here are illustrative, and many other public references were used for data collection, validation, and clarification.
Primary Interviews and Surveys
Primary work is used to pressure-test the desk model with people who see pricing, demand, and supply patterns directly. We speak with laser component and system suppliers, distributors, integrators, and end users across industrial, medical, electronics, and research buying groups, then reconcile inputs across APAC, EMEA, and the Americas so no single region drives the totals.
Distribution of primary research fieldwork respondents
| Company type | Respondent position | Region |
|---|---|---|
| Top tier: 38% | CXOs: 15% | APAC: 39% |
| Mid tier: 45% | Functional/Unit leaders: 38% | EMEA: 35% |
| Smaller Players: 17% | Managers: 47% | Americas: 26% |
Market-Sizing & Forecasting
Sizing is built using a top-down approach where production, trade, and application level demand signals are used to reconstruct the addressable revenue pool by region, and then totals are reconciled to the global number. To keep the model realistic, we corroborate with selective bottom-up checks such as sampled ASP times unit volume for common laser categories, channel feedback on mix, and supplier roll-ups for a limited set of well-tracked product lines.
Key inputs used in the model include industrial automation and manufacturing output indicators, electronics and semiconductor capex direction, medical procedure volumes where lasers are commonly used, import-export trends for laser equipment categories, and observed ASP movement by laser type and power class. When data gaps appear in a region or niche use case, we fill them with conservative proxy ratios validated in interviews, and then rebalance the final totals.
Forecasts are developed using scenario analysis supported by a light multivariate regression, with macro output, capex cycles, and adoption intensity by application as the main drivers. Assumptions on mix shift (for example, fiber and diode penetration) and pricing are refreshed based on expert consensus, then applied consistently across the forecast horizon.
Data Validation & Update Cycle
Validation is done through multiple cross checks so the final number is not dependent on a single data series. Model outputs are compared with independent signals such as trade values, production indicators, and application demand markers, and any large variances are reviewed and corrected with documented reasoning.
Before sign off, the work is reviewed in steps: first for math and unit consistency, then for scope alignment, and finally for reasonableness versus known industry events. If new capacity announcements, regulation changes, or sharp price movements are observed, follow ups are triggered with selected respondents. Reports are refreshed annually, and before delivery we run a final update pass so clients receive the latest view.
Mordor Intelligence's Lasers Market Size Measured Against Other Published Estimates
Published numbers for lasers often look different because the scope line is drawn in different places, and because pricing and application mix are treated differently across sources. The selected year, the currency conversion timing, and how much primary validation is used can also shift the reported value.
The benchmark table shows a wide spread for 2025 and 2026. In Mordor Intelligence's model, the total is built around global revenues from laser sources and systems by type and application, with mix and ASP movement checked against trade signals and interview based adoption inputs rather than relying only on factory gate reporting.
Benchmark comparison
| Source | Market Size | Gaps in Research Methodology |
|---|---|---|
| Mordor Intelligence | USD 21.43 B (2025) | |
| Global Consultancy A | USD 23.81 B (2025) | Often treated as a broader laser technology view, which can pull in adjacent technology revenue streams and apply faster ASP or penetration uplift assumptions across end uses. |
| Trade Journal B | USD 13.04 B (2026) | Uses factory gate valuation logic and may exclude downstream system value, integration revenue, or channel markups, which can compress the reported market size versus an end market revenue view. |
Taken together, the comparison suggests the main differences come from what is counted as revenue, how far downstream system value is captured, and how pricing and mix are carried forward year to year. By keeping scope rules explicit and tying assumptions back to observable indicators, our estimate stays repeatable and easier to audit when clients update their own planning models.


Key Questions Answered in the Report
How large is the global lasers market in 2026 and what growth is expected by 2031?
The market stands at USD 22.92 billion in 2026 and is forecast to reach USD 32.08 billion by 2031, translating to a 6.96% CAGR.
Which laser type holds the greatest share today?
Fiber lasers currently command 41.40% of global revenue thanks to high beam quality and low maintenance needs.
Which end-user industry is growing fastest?
Automotive manufacturing records the highest momentum, expanding at a 8.96% CAGR as electric-vehicle battery welding and LiDAR integration accelerate.
Why is Asia-Pacific the leading region?
Concentrated semiconductor fabs, extensive display production, and strong government funding give Asia-Pacific 46.40% share with 8.17% forecast CAGR.
What is the main supply-chain risk facing laser makers?
Shortages of gallium arsenide and indium phosphide epi-wafers constrain high-power diode output and raise material costs.
How concentrated is competition among leading vendors?
The top five suppliers control roughly 50% of revenue, indicating moderate concentration and ongoing pressure from emerging regional players.
Page last updated on:


 Your data is secure and never sold or shared.


