Market Overview
| Study Period | 2020 - 2031 |
|---|---|
| Forecast Data Period | 2026 - 2031 |
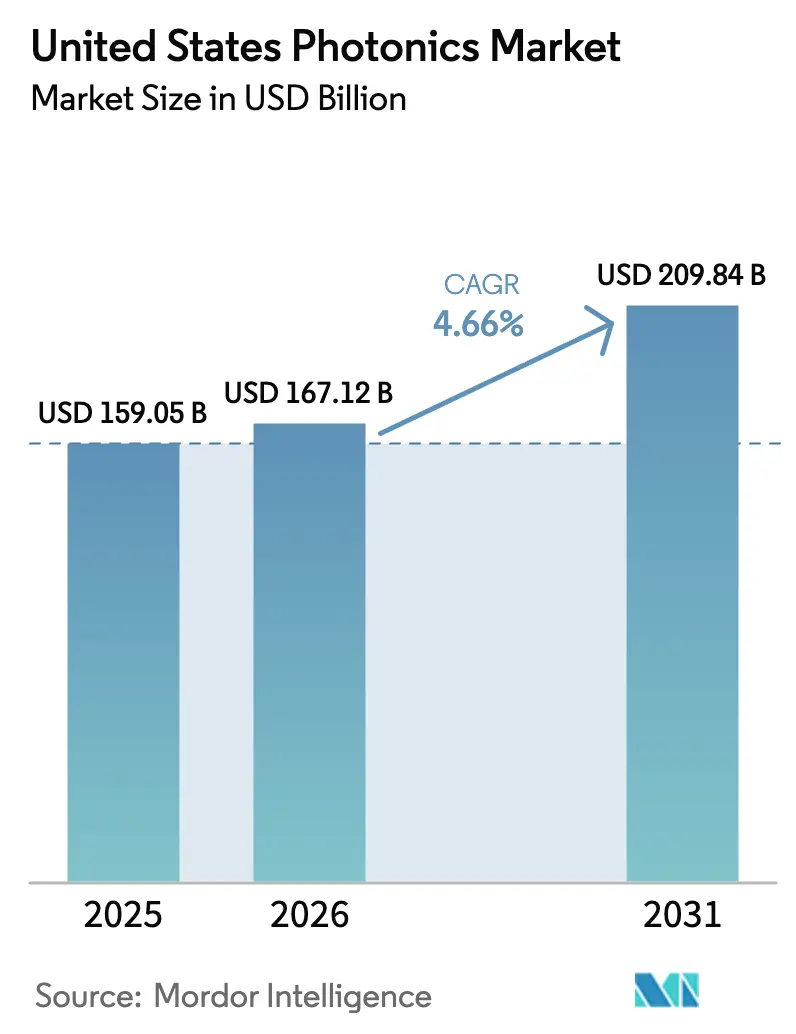
| Base Year Market Size (2025) | USD 159.05 Billion |
| Market Size (2026) | USD 167.12 Billion |
| Market Size (2031) | USD 209.84 Billion |
| Growth Rate (2026 - 2031) | 4.66% CAGR |
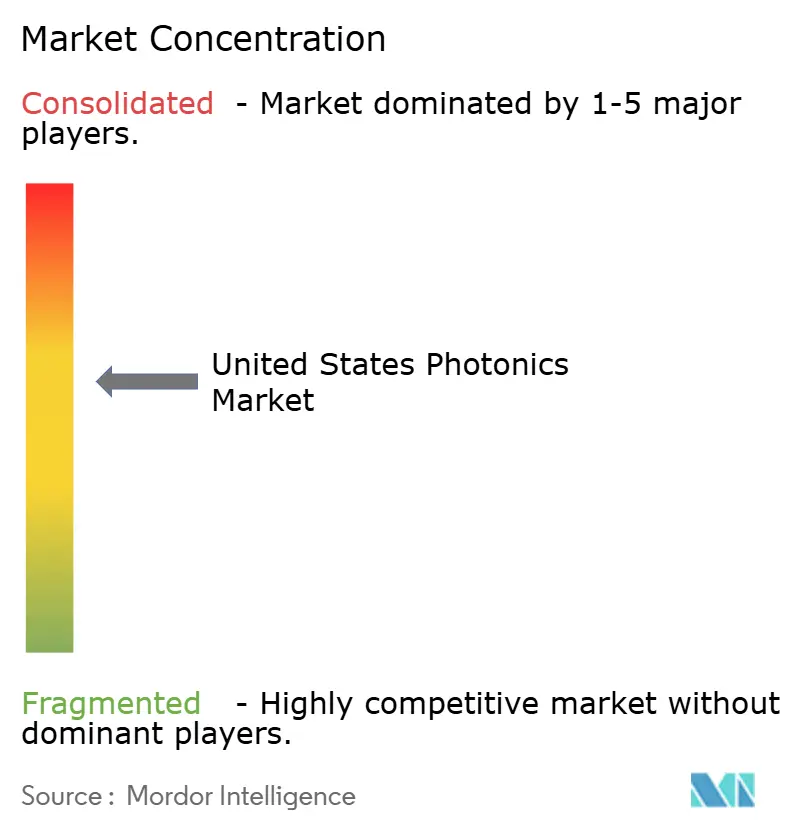
| Market Concentration | Medium |
Major Players *Disclaimer: Major Players sorted in no particular order Image © Mordor Intelligence. Reuse requires attribution under CC BY 4.0. | |
United States Photonics Market Analysis by Mordor Intelligence
The United States photonics market size was valued at USD 159.05 billion in 2025 and estimated to grow from USD 167.12 billion in 2026 to reach USD 209.84 billion by 2031, at a CAGR of 4.66% during the forecast period (2026-2031). Data-communication optics continue to anchor revenue, yet hyperscale operators are pivoting toward co-packaged architectures that lower power and latency. Federal incentives under the CHIPS and Science Act are reshoring wafer fabrication, while defense budgets for high-energy lasers are expanding multi-year backlogs. Automotive LiDAR mandates, quantum-networking pilots, and streamlined FDA clearances for optical-based diagnostics are widening the application slate. Suppliers that combine silicon-photonics scale with III-V performance stand to capture outsized opportunity as end users demand turnkey optical engines.
Key Report Takeaways
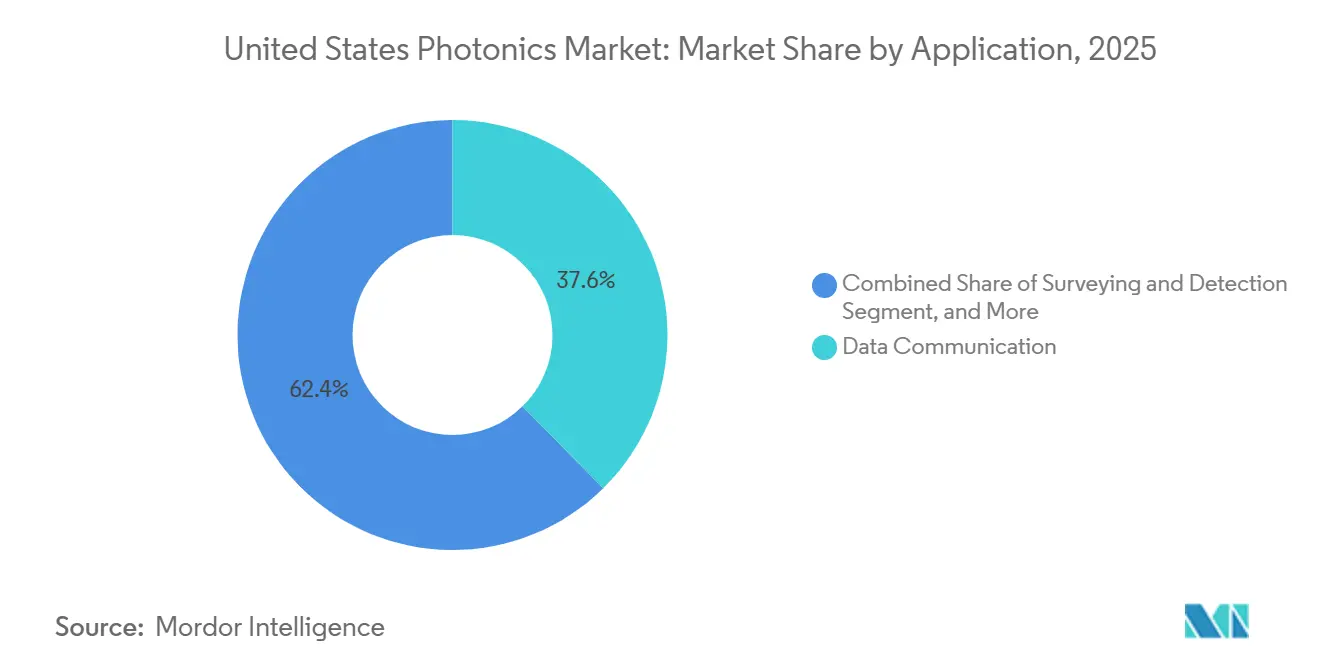
- By application, data communication held 37.64% of the United States photonics market share in 2025, and surveying and detection is advancing at a 6.08% CAGR through 2031.
- By component type, lasers and sources commanded 30.17% of the 2025 revenue base, whereas integrated photonic circuits are projected to expand at a 5.89% CAGR over 2026-2031.
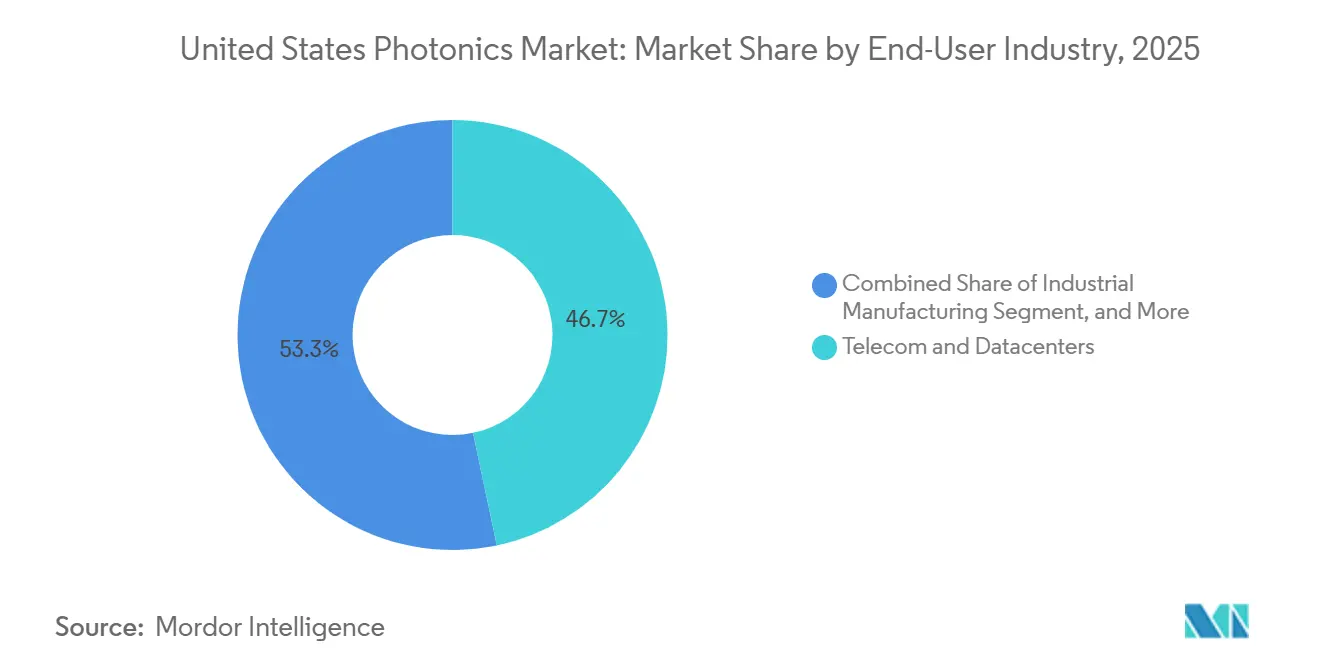
- By end-user industry, telecom and datacenters accounted for 43.49% of 2025 spending, but defense and aerospace are the fastest movers with a 5.93% CAGR outlook to 2031.
- By technology, silicon photonics captured 46.71% of 2025 revenue, while quantum and non-linear photonics is growing at a 5.43% CAGR through 2031.
Note: Market size and forecast figures in this report are generated using Mordor Intelligence’s proprietary estimation framework, updated with the latest available data and insights as of 2026.
United States Photonics Market Trends and Insights
Drivers Impact Analysis*
| Driver | (~) % Impact on CAGR Forecast | Geographic Relevance | Impact Timeline |
|---|---|---|---|
| AI-Driven Datacenter Optical-I/O Boom | +1.2% | National, concentrated in Virginia, Texas, Oregon datacenter hubs | Short term (≤ 2 years) |
| CHIPS Act Domestic Manufacturing Incentives | +0.9% | National, with early gains in Arizona, New York, Ohio fab corridors | Medium term (2-4 years) |
| Defense Laser and Directed-Energy Funding | +0.8% | National, led by DoD prime contractors in California, Massachusetts, Alabama | Medium term (2-4 years) |
| Minimally-Invasive Biomedical Imaging Uptake | +0.6% | National, stronger in academic medical centers and ASC networks | Long term (≥ 4 years) |
| Autonomous-Vehicle LiDAR Integration Race | +0.5% | National, early deployment in California, Michigan, Arizona testing zones | Long term (≥ 4 years) |
| Quantum-Photonics R&D Investments | +0.4% | National, anchored by NSF and DOE centers in Illinois, Colorado, Maryland | Long term (≥ 4 years) |
| Source: Mordor Intelligence | |||
AI-driven datacenter optical-I/O boom
Hyperscalers are inserting co-packaged optics that eliminate copper retimers and shrink switch-ASIC power budgets. Meta’s January 2026 plan to deploy 1.6 terabit optical engines trims per-rack energy by 40%.[1]Meta Platforms, “Meta Unveils Next-Generation AI Infrastructure,” meta.com Microsoft is investing USD 2.3 billion to retrofit 15 facilities with 800G and 1.6terabit links, boosting demand for silicon photonics modulators and indium phosphide lasers. The Open Compute Project released thermal and mechanical guidelines in mid-2025, giving vendors a target for interoperability. Early field data suggest latency cuts of 25 nanoseconds per hop, a figure that incentivizes AI-training operators. Suppliers able to fab photonics and electronics side-by-side at wafer scale hold cost and time-to-market advantages.
CHIPS Act Domestic Manufacturing Incentives
Direct grants and loan guarantees totaling USD 19.5 billion flowed to U.S. photonics projects in 2025. Intel received USD 3.5 billion for its New Mexico expansion, targeting 50,000 wafer starts per month by 2027. GlobalFoundries secured USD 1.5 billion for an upstate New York module that already ships 400-gigabit transceivers at a sub-USD 5 per-gigabit cost. A 25% investment-tax credit on capital equipment narrowed cost gaps with Asian fabs. Workforce agreements lag, with only 40% of awardees finalizing technician pipelines, posing a medium-term execution risk.
Defense Laser and Directed-Energy Funding Upswing
The Department of Defense lifted its high-energy-laser allocation to USD 2.1 billion in the fiscal 2026 request, a 17% jump over 2025.[2]U.S. Department of Defense, “Fiscal Year 2026 Budget Request,” defense.gov Lockheed Martin delivered a 300-kilowatt fiber-laser weapon in December 2025, integrating IPG Photonics gain modules and Coherent beam combiners. DARPA’s Wideband Adaptive RF Protection program, launched in early 2026, seeks photonic frequency-comb jammers with multi-octave coverage. Raytheon is co-developing airborne laser pods with optical outputs exceeding 10 kilowatts. Export-control carve-outs for industrial-class lasers below 500 watts simplify overseas sales while keeping combat systems tightly regulated.
Minimally-Invasive Biomedical Imaging Uptake
The Centers for Medicare & Medicaid Services included swept-source OCT in reimbursable codes in January 2025, unlocking 4 million new procedures per year. Zeiss and Topcon launched OCT platforms capable of 400,000 A-scans per second, enabling real-time intraoperative guidance. FDA 510(k) clearance timelines for photonic devices fell to an average of 7 months in 2025. Academic centers are rolling out multiphoton microscopes that deliver label-free histology within minutes, yet unit costs above USD 500,000 constrain uptake to high-volume hospitals. Device makers that bundle service contracts with hardware are smoothing capital barriers and accelerating fleet refresh cycles.
Restraints Impact Analysis*
| Restraint | (~) % Impact on CAGR Forecast | Geographic Relevance | Impact Timeline |
|---|---|---|---|
| Cap-Intensive Photonic-Fab Infrastructure | −0.7% | National, acute in states without mature semiconductor ecosystems | Medium term (2-4 years) |
| Photonics-Skilled Talent Shortage | −0.5% | National, most severe in emerging fab regions without university feeds | Short term (≤ 2 years) |
| Rare-Earth and III-V Supply-Chain Risks | −0.4% | National, impacts segments reliant on erbium, indium, gallium | Long term (≥ 4 years) |
| Standards and Ecosystem Interoperability Gaps | −0.3% | National, hinders multi-vendor telecom and datacenter deployments | Short term (≤ 2 years) |
| Source: Mordor Intelligence | |||
Cap-Intensive Photonic-Fab Infrastructure
Building a photonic integrated-circuit fab requires USD 500 million to USD 1 billion in upfront capital, covering cleanrooms, wafer bonding, and metrology tools.[3]SEMI, “World Fab Forecast 2025,” semi.org Only six U.S. fabs had photonics capability in 2025. Tower Semiconductor’s proposed New Mexico line stalled awaiting final CHIPS disbursements. Lead times for electron-beam lithography systems stretched to 18 months in 2025. Smaller firms rely on multi-project wafer shuttles that add up to 9 months to product cycles, eroding first-mover advantage and diluting margins.
Photonics-Skilled Talent Shortage
The Optica Foundation found a projected shortfall of 12,000 engineers and technicians by 2028.[4]Optica Foundation, “U.S. Photonics Workforce Survey 2025,” optica.org. Arizona State University and the University of Rochester increased annual optics graduates to just 800 in total, far below the fab demand. Salaries for process engineers climbed 18% year over year in 2025. Community-college technician programs operate in only 12 states, forcing fabs to recruit abroad and incur visa delays. Half of CHIPS grant recipients still lack formal apprenticeship partnerships, slowing ramp schedules.
*Our forecasts treat driver/restraint impacts as directional, not additive. The impact forecasts reflect baseline growth, mix effects, and variable interactions.
Segment Analysis
By Application: Datacenter Optics Anchor Revenue While LiDAR Gains Speed
Datacenter optics accounted for 37.64% of 2025 revenue, reflecting the mass deployment of 800-gigabit modules, which hold the largest slice of the United States photonics market. Surveying and detection, which includes automotive LiDAR and industrial metrology, is forecast to grow 6.08% per year through 2031, outpacing the United States photonics market's growth trajectory.
The acceleration is tied to state safety mandates requiring LiDAR on Level-4 autonomous vehicles and to precision metrology in semiconductor packaging lines. Production-technology applications benefit from 20-kilowatt fiber lasers that halve the time required for thick-steel processing. Imaging and display are expanding as augmented-reality headsets adopt diffractive waveguides. Medical-technology uptake is bolstered by broader reimbursement for swept-source OCT. Lighting remains mature, with LED penetration nearing saturation, but UV-C disinfection opens a niche upside. Environmental sensing could influence whether methane monitoring becomes a regulatory requirement.


By Component Type: Integrated Circuits Disrupt Discrete Optics
Lasers and sources captured 30.17% of 2025 turnover, yet integrated photonic circuits are poised for 5.89% CAGR as monolithic designs weave lasers, modulators, and detectors onto a single die. This trend lifts the overall United States photonics market size and compresses the bill-of-materials cost.
Intel shipped more than 10 million silicon-photonic transceivers in 2025. Detectors and sensors benefit from quantum communication pilots that require sub-nanosecond jitter. Thin-film lithium-niobate modulators cut drive voltage by 70%, enabling coherent 1.6 terabit lanes. Passive-optic suppliers face pricing pressure as precision molding scales, while specialty coatings for high-power lasers maintain premiums. Consolidation, exemplified by Coherent’s II-VI merger, signals that scale and vertical integration now dictate parity.
By End-User Industry: Defense Outpaces Telecom as Priorities Shift
Telecom and data centers accounted for 43.49% of 2025 sales, commanding the largest share of the United States photonics market. Defense and aerospace are set for a 5.93% CAGR, fueled by directed-energy weapons, satellite optical links, and photonics-based jammers.
Industrial manufacturing is adopting ultrafast lasers for precision cutting of battery tabs and turbine blades, while healthcare facilities are adding OCT and multiphoton imaging for real-time diagnostics. Consumer electronics rebounded on micro-LED and holographic displays in Apple Vision Pro and Meta Quest 4, though volumes remain modest relative to telecom. Energy and environment applications will scale if methane leak detection becomes mandatory. Vendors diversified across end-markets, such as Coherent, enjoy steadier revenue than telecom-centric specialists.
By Technology: Silicon Photonics Dominates, Quantum Gains Momentum
Silicon photonics accounted for 46.71% of 2025 revenue, cementing volume leadership in the United States photonics market. CMOS compatibility drives component cost below USD 5 per gigabit at the 400 gigabit level .
Quantum and nonlinear photonics, although just emerging, are advancing at 5.43% annually, with National Quantum Initiative funding of USD 1.2 billion through 2028. Optical-fiber photonics remains essential for long-haul links, even as coherent detection reduces the need for amplifiers. Free-space and diffractive optics earn design wins in LiDAR and holographic displays thanks to solid-state beam steering. Export controls on certain quantum systems could temper commercial deployments. Suppliers that master heterogeneous integration of III-V gain regions on silicon are best positioned for high-performance use cases.
Geography Analysis
Datacenter clusters in Virginia, Texas, and Oregon handle the largest volumes of 800G and 1.6terabit optics, anchoring the United States photonics market. California and Massachusetts drive defense photonics via prime contractors and federally funded research labs. Arizona and New York are evolving into manufacturing corridors under CHIPS incentives, with combined pledges topping USD 5 billion for fab expansions.
The Midwest, led by Ohio and Michigan, is positioning for automotive LiDAR assembly as domestic automakers add solid-state sensors to electric-vehicle platforms. Workforce disparities are visible: states with mature optics curricula meet hiring targets, whereas emerging hubs face shortages that slow ramp schedules. Pacific Northwest salaries run 15% above national medians, challenging retention as software giants compete for engineers.
Federal R&D money favors Illinois, Colorado, and Maryland, whose quantum centers captured 60% of 2025 photonics-related NSF grants. The lack of a domestic indium phosphide wafer supplier leaves all regions exposed to import volatility and to the 22% price hikes that occurred in early 2025. State-level tax abatements, such as New York’s USD 500 million Excelsior Jobs credits, skew capital flows toward a handful of winning locales. Absent policy change, the near-term footprint will remain clustered around Arizona, New York, and Oregon fabs, while secondary regions specialize in assembly or R&D.
Competitive Landscape
The United States photonics market remains moderately fragmented: the top five vendorsIntel, Lumentum, Coherent, IPG Photonics, and Infinera, held about 38% share in 2025, leaving scope for niche specialists. Intel deepened vertical integration by open-sourcing parts of its silicon-photonic process-design kit to lock in ecosystem adoption. Lumentum launched thin-film lithium niobate modulators that slash drive power by 70%, differentiating its co-packaged offerings.
Coherent leverages II-VI’s epitaxial capacity to supply both industrial lasers and space-qualified optics, cushioning cyclical swings. IPG Photonics dominates high-power fiber sources but now faces competition from Chinese entrants in the ≤10 kilowatt range. Infinera relies on indium phosphide PICs for coherent transport, but saw a 12% revenue decline in 2025 as capex paused.
Disruptors such as Ayar Labs and Lightmatter shipped early co-packaged engines adopted by Meta and Microsoft, threatening incumbent pluggable transceiver economics. Patent activity spiked: Intel filed 47 photonics patents in 2025, Coherent filed 32, and GlobalFoundries filed 25, signaling sustained R&D intensity. Compliance with IEEE 802.3dj and Optical Internetworking Forum MSAs is compulsory for datacenter qualification. Defense-oriented suppliers navigate tighter ITAR controls that limit foreign collaboration but secure domestic demand.
United States Photonics Industry Leaders
Intel Corporation
Lumentum Holdings Inc.
Coherent Corp.
IPG Photonics Corporation
Nokia Corporation
- *Disclaimer: Major Players sorted in no particular order

Recent Industry Developments
- January 2026: Meta integrated 1.6 terabit co-packaged optical engines from Ayar Labs and Lightmatter in its next-generation AI cluster, lowering rack power 40%.
- December 2025: Lockheed Martin delivered the first 300 kilowatt fiber-laser weapon system to the U.S. Army, moving directed-energy capability from prototype to deployment.
- November 2025: Intel committed USD 3.5 billion to expand its New Mexico silicon-photonics fab, setting a 50,000 wafer-start-per-month target by 2027.
- October 2025: GlobalFoundries shipped its two-millionth silicon-photonics transceiver, achieving 85% yield and sub-USD 5 per gigabit cost.


United States Photonics Market Report Scope
The United States Photonics Market Report is Segmented by Application (Surveying and Detection, Production Technology, Data Communication, Image Capture and Display, Medical Technology, Lighting, Other Applications), Component Type (Lasers and Sources, Detectors and Sensors, Optical Fibers and Waveguides, Modulators and Switched Devices, Integrated Photonic Circuits, Passive Optics), End-User Industry (Telecom and Datacenters, Industrial Manufacturing, Healthcare and Life Sciences, Defense and Aerospace, Consumer Electronics, Energy and Environment), and Technology (Silicon Photonics, Optical Fiber Photonics, Free-Space and Diffractive Optics, Quantum and Non-Linear Photonics). The Market Forecasts are Provided in Terms of Value (USD).
By Application
| Surveying and Detection |
| Production Technology |
| Data Communication |
| Image Capture and Display |
| Medical Technology |
| Lighting |
| Other Applications |
By Component Type
| Lasers and Sources |
| Detectors and Sensors |
| Optical Fibers and Waveguides |
| Modulators and Switched Devices |
| Integrated Photonic Circuits |
| Passive Optics (Lenses, Filters, etc.) |
By End-User Industry
| Telecom and Datacenters |
| Industrial Manufacturing |
| Healthcare and Life Sciences |
| Defense and Aerospace |
| Consumer Electronics |
| Energy and Environment |
By Technology
| Silicon Photonics |
| Optical Fiber Photonics |
| Free-Space and Diffractive Optics |
| Quantum and Non-Linear Photonics |
| By Application | Surveying and Detection |
| Production Technology | |
| Data Communication | |
| Image Capture and Display | |
| Medical Technology | |
| Lighting | |
| Other Applications | |
| By Component Type | Lasers and Sources |
| Detectors and Sensors | |
| Optical Fibers and Waveguides | |
| Modulators and Switched Devices | |
| Integrated Photonic Circuits | |
| Passive Optics (Lenses, Filters, etc.) | |
| By End-User Industry | Telecom and Datacenters |
| Industrial Manufacturing | |
| Healthcare and Life Sciences | |
| Defense and Aerospace | |
| Consumer Electronics | |
| Energy and Environment | |
| By Technology | Silicon Photonics |
| Optical Fiber Photonics | |
| Free-Space and Diffractive Optics | |
| Quantum and Non-Linear Photonics |


Key Questions Answered in the Report
What is the projected value of the United States photonics market in 2031?
It is forecast to reach USD 209.84 billion by 2031, expanding at a 4.66% CAGR over 2026-2031.
Which application area is growing fastest through 2031?
Surveying and detection, driven by automotive LiDAR and industrial metrology, is tracking a 6.08% CAGR to 2031.
How large is silicon photonics within overall revenue?
Silicon photonics captured 46.71% of 2025 revenue, the largest share among technologies.
Why are co-packaged optics important for datacenters?
They cut per-rack power up to 40% and reduce latency by removing long copper links, accelerating AI-cluster performance.
What is hindering new photonic fab construction?
Up-front capital between USD 500 million and USD 1 billion and long equipment lead times slow project starts.
Which region is emerging as a fabrication hub under the CHIPS Act?
Arizona and New York stand out, combining federal grants with state tax credits to lure large-scale photonics fabs.
Page last updated on:


