
Technology, Media and Telecom
5th MayPricing Strategy for Semiconductor Components
3 Min Read
The Optical Measurement Market Report is Segmented by Offering (Hardware, Software, and Services), Dimension (2D, and 3D), Measurement Range (Small and Medium Components (Less Than 1 M³), and Large Volume (Above 1 M³)), Technique (Laser Triangulation, and More), End-User (Automotive, Aerospace and Defense, Energy and Power, and More), and Geography. The Market Forecasts are Provided in Terms of Value (USD).
Market Overview
| Study Period | 2020 - 2031 |
|---|---|
| Market Size (2026) | USD 6.99 Billion |
| Market Size (2031) | USD 9.51 Billion |
| Growth Rate (2026 - 2031) | 6.35 % CAGR |
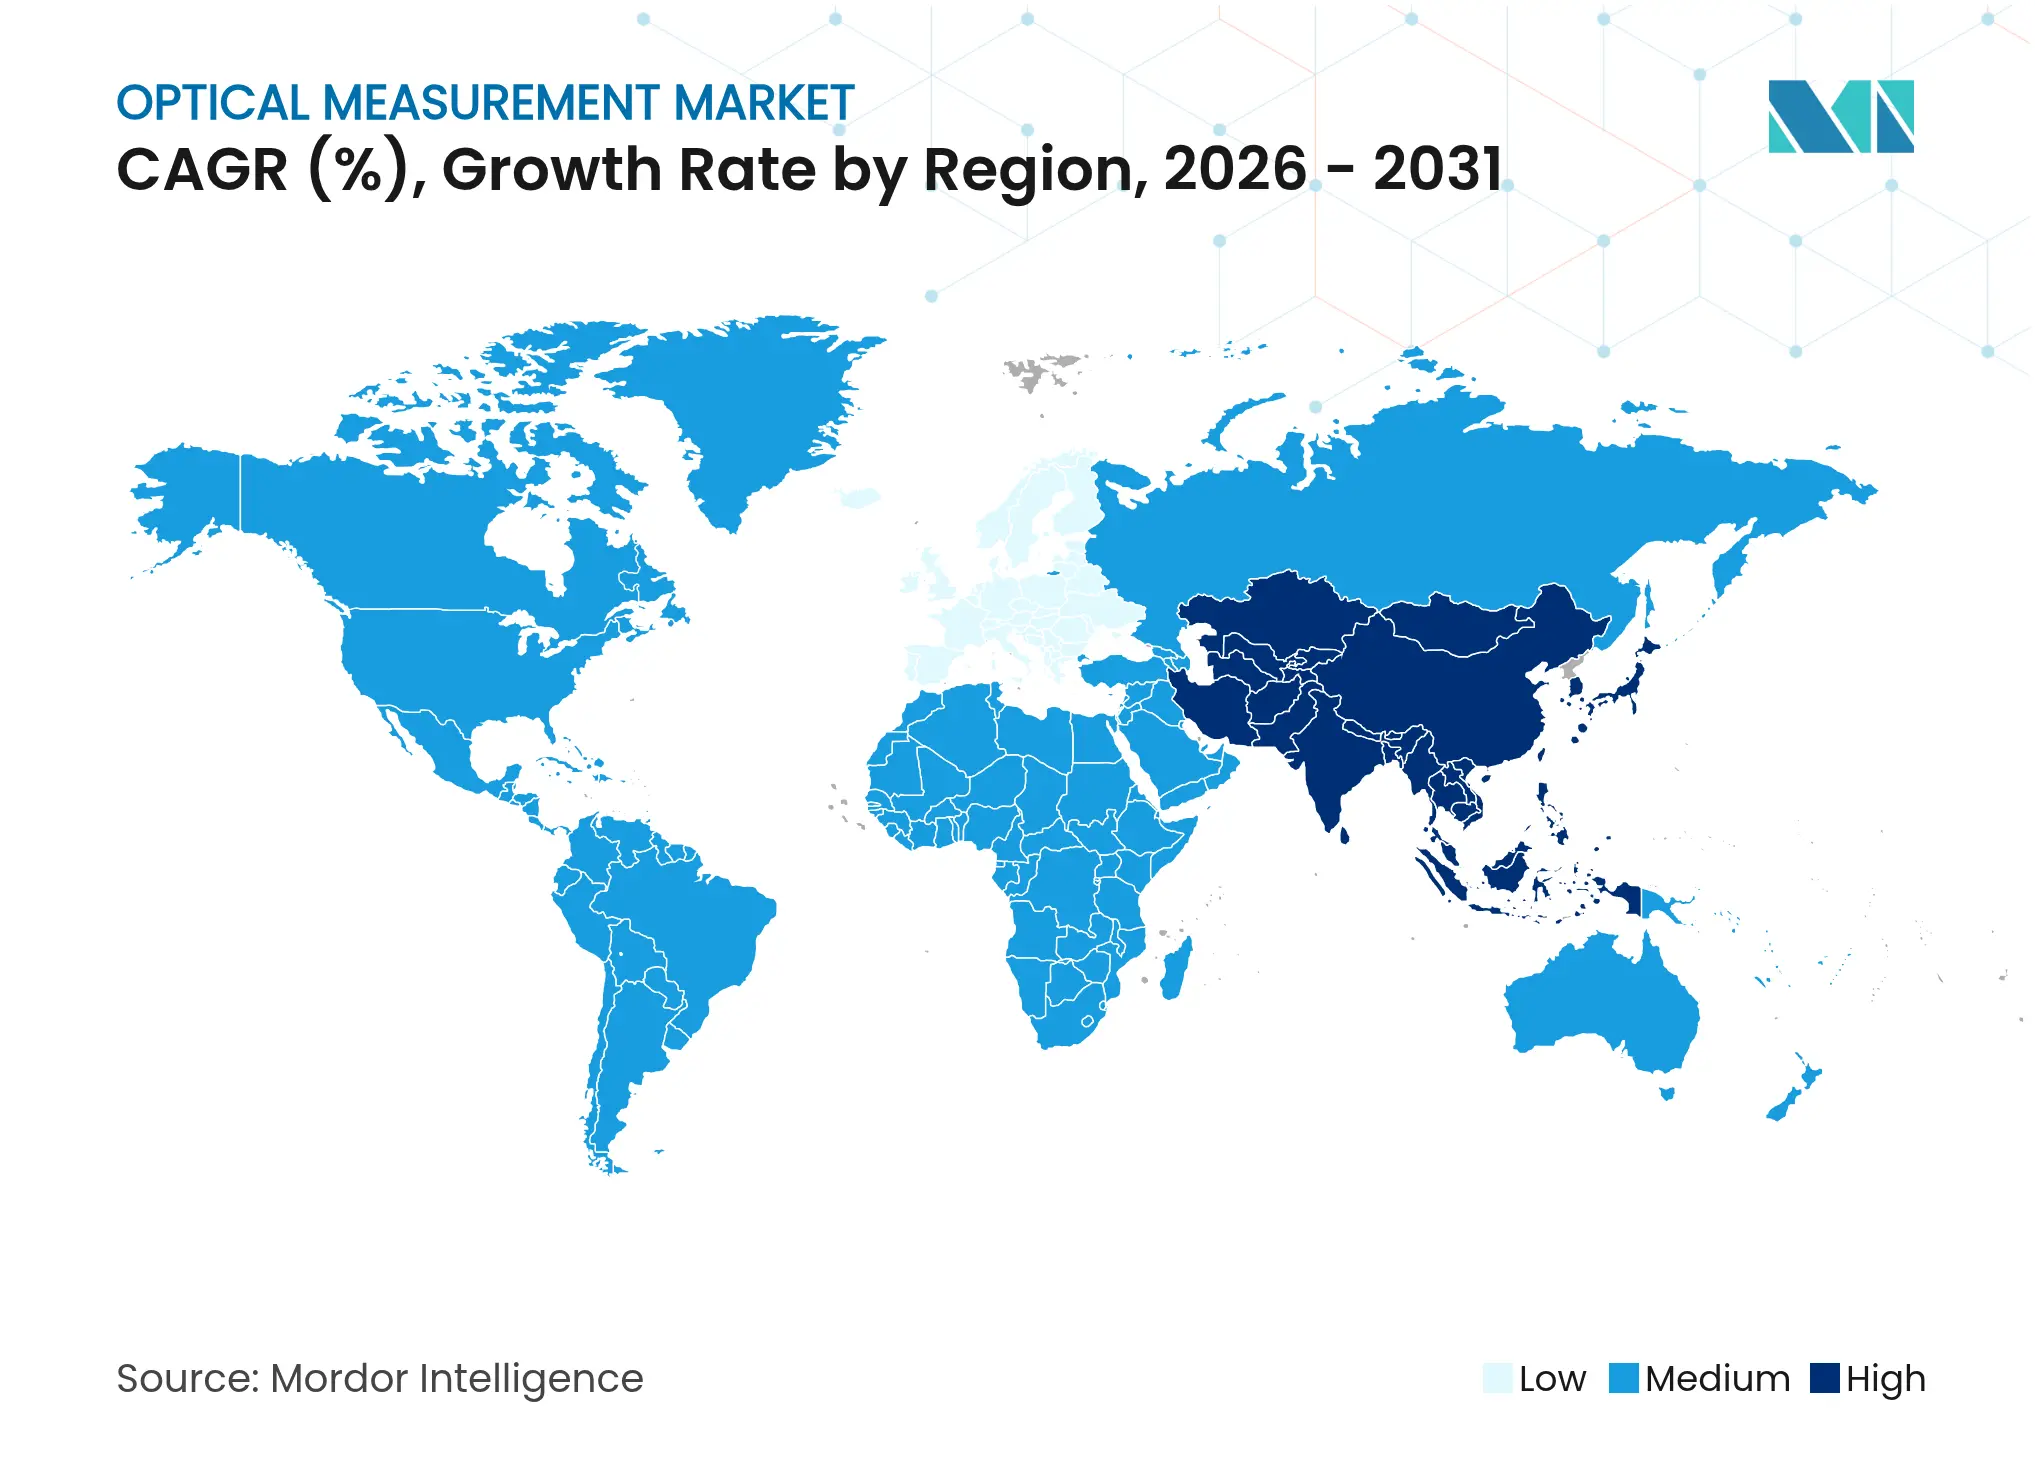
| Fastest Growing Market | Asia Pacific |
| Largest Market | Asia Pacific |
| Market Concentration | Medium |
Major Players *Disclaimer: Major Players sorted in no particular order. Image © Mordor Intelligence. Reuse requires attribution under CC BY 4.0. |
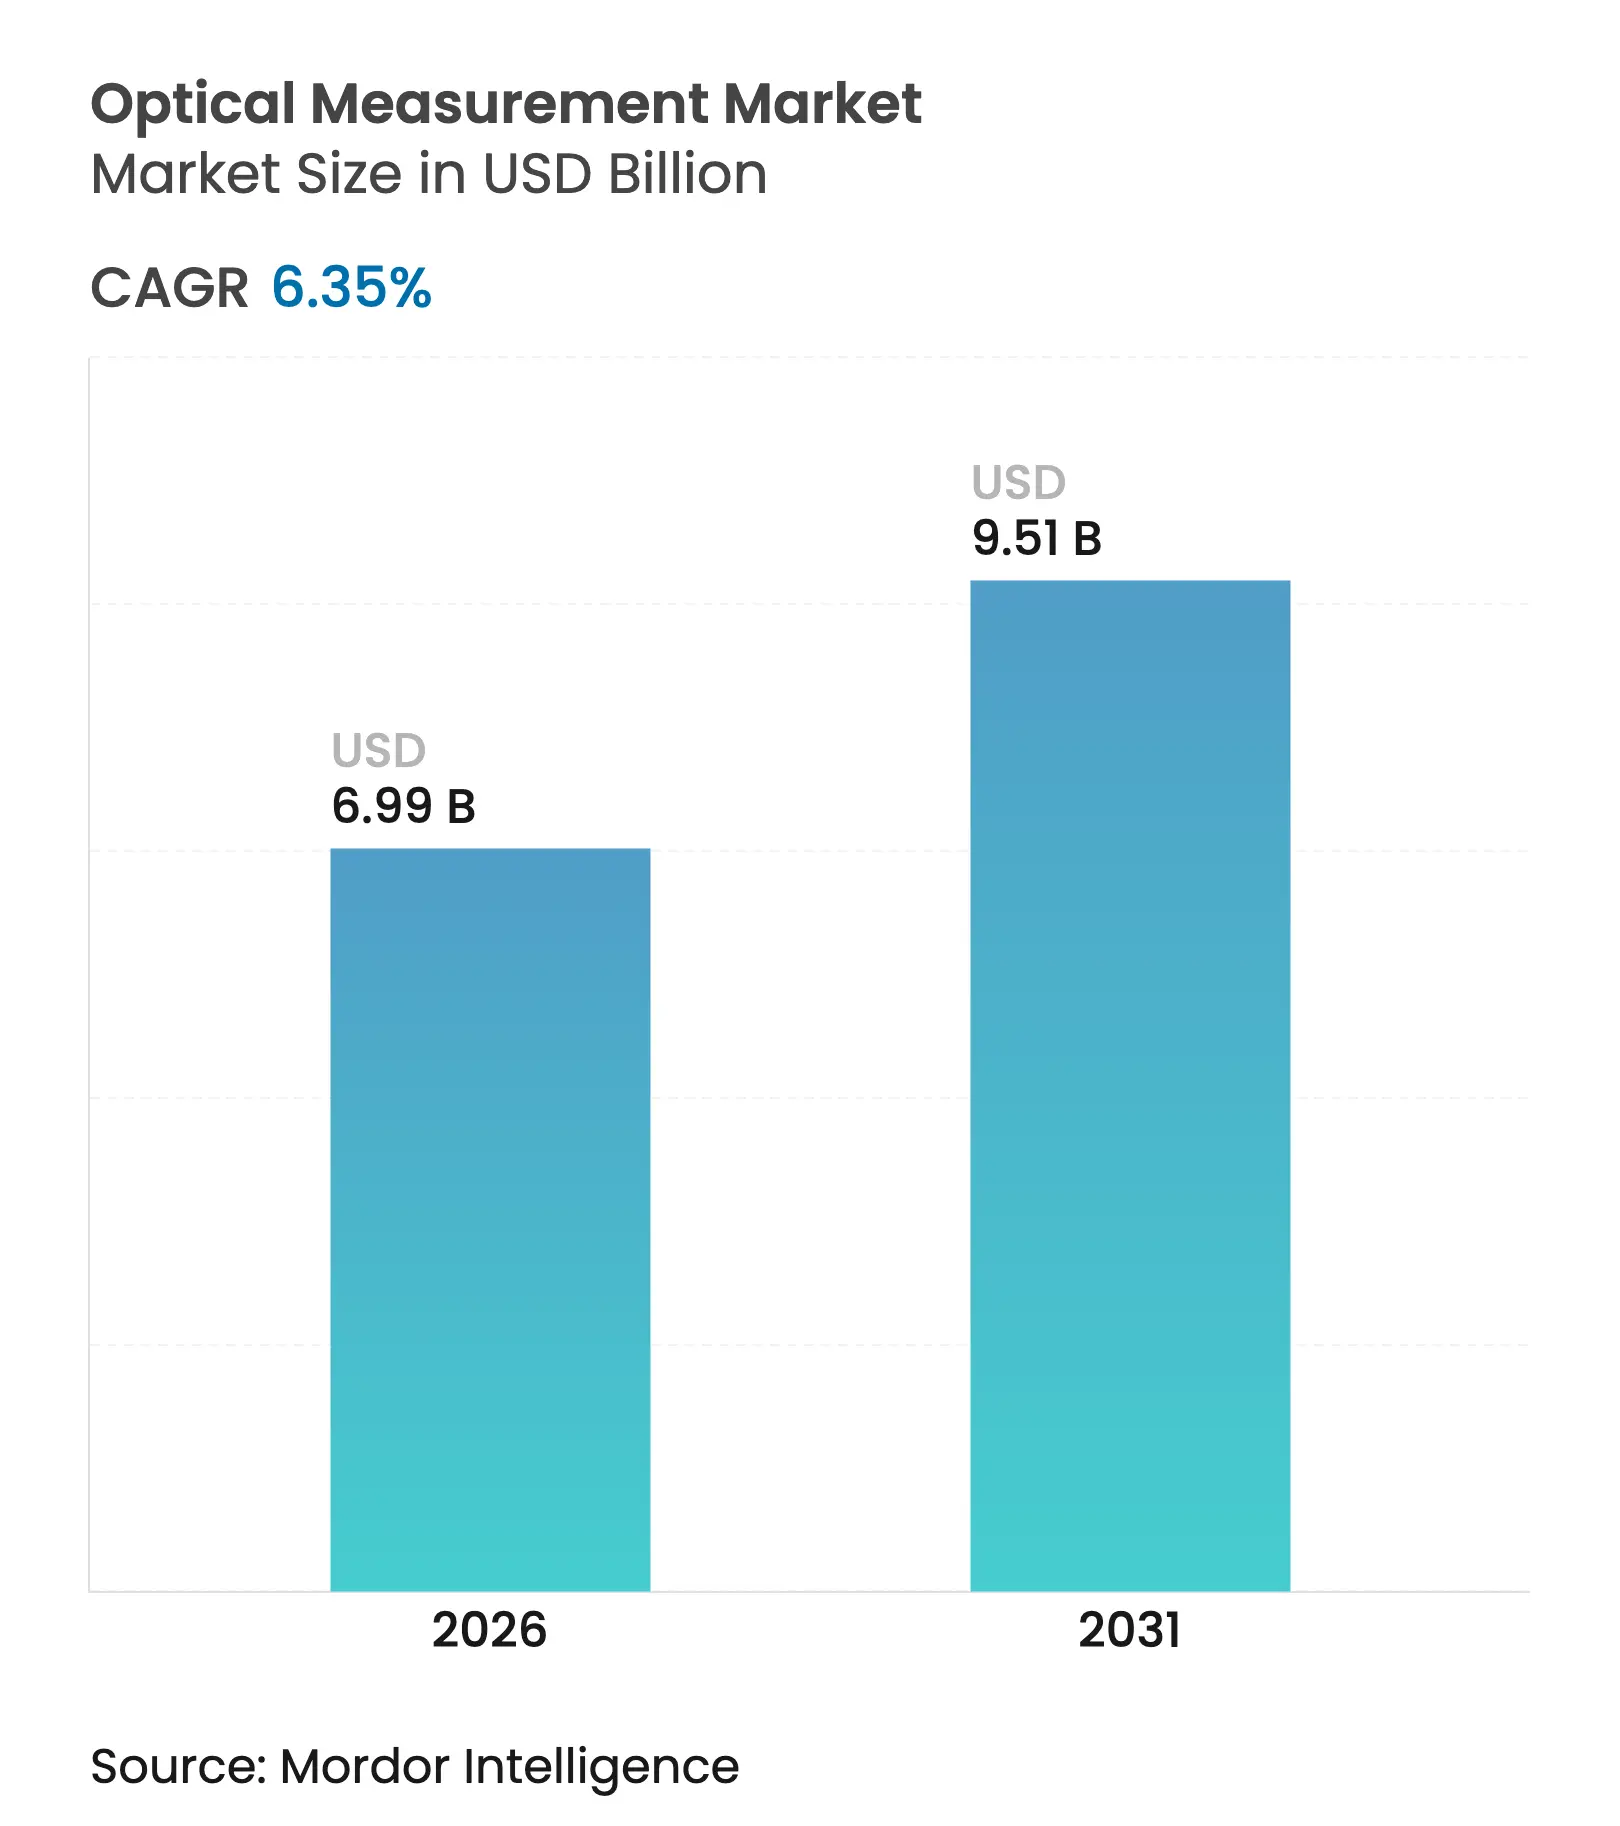
The optical measurement market size is expected to grow from USD 6.57 billion in 2025 to USD 6.99 billion in 2026 and is forecast to reach USD 9.51 billion by 2031 at 6.35% CAGR over 2026-2031. The growth trajectory reflects escalating demand for inline metrology inside EV battery gigafactories, sub-nanometer precision requirements in shrinking semiconductor nodes, and tighter integration of optical sensors with smart-factory ecosystems. Aerospace maintenance operations are migrating toward non-contact inspection of composite airframes, while the miniaturization of medical implants drives wider use of white-light interferometry. Competitive pressure is intensifying as companies pursue technology-heavy acquisitions, and supply-chain constraints for germanium and gallium continue to elevate costs and lead times.
Key Report Takeaways
Note: Market size and forecast figures in this report are generated using Mordor Intelligence's proprietary estimation framework, updated with the latest available data and insights as of 2026.
Drivers Impact Analysis
| Driver | (~)% Impact on CAGR Forecast | Geographic Relevance | Impact Timeline | |||
|---|---|---|---|---|---|---|
Surging EV battery gigafactory demand for in-line optical metrology Surging EV battery gigafactory demand for in-line optical metrology | +1.2% | Asia-Pacific core, spill-over to North America | Medium term (2-4 years) | (~)% Impact on CAGR Forecast:+1.2% | Geographic Relevance:Asia-Pacific core, spill-over to North America | Impact Timeline:Medium term (2-4 years) |
Adoption of optical metrology in additive manufacturing quality loops Adoption of optical metrology in additive manufacturing quality loops | +0.8% | Global, concentrated in North America & EU | Long term (≥4 years) | |||
Node-shrink driven precision needs in semiconductor front-end fabs Node-shrink driven precision needs in semiconductor front-end fabs | +1.5% | Asia-Pacific, North America, select EU fabs | Short term (≤2 years) | |||
Aerospace MRO shift to non-contact inspection for composite airframes Aerospace MRO shift to non-contact inspection for composite airframes | +0.6% | North America & EU core, emerging Asia-Pacific | Medium term (2-4 years) | |||
Miniaturization of medical implants elevating white-light interferometry Miniaturization of medical implants elevating white-light interferometry | +0.4% | Global, early adoption in North America & EU | Long term (≥4 years) | |||
Integration with smart-factory MES and digital twin platforms Integration with smart-factory MES and digital twin platforms | +0.9% | Global, advanced in Germany & Japan | Medium term (2-4 years) | |||
| Source: Mordor Intelligence | ||||||
Surging EV battery gigafactory demand for in-line optical metrology (Asia)
Global investments of USD 195 billion in battery production during 2022-2023 are driving rapid deployment of high-speed optical inspection capable of validating 240 stator contacts in under 30 seconds, 100× faster than legacy methods.[1]Modern Machine Shop, “Precision Inspection System for Electric Vehicle Components,” mmsonline.com The Chinese industrial laser market grew 10.2% to USD 15.9 billion in 2024, paralleling heavier use of laser-based gauges on battery cell lines. Computed-tomography quality analysis now detects anode overhang and delamination non-destructively, mitigating thermal-runaway risks.
Adoption of optical metrology in additive manufacturing quality loops
Additive manufacturing’s shift to serial production requires in-situ 3D topographical monitoring to reach zero-defect goals.[2]MDPI, “In-Situ 3D Surface Monitoring for Additive Manufacturing,” mdpi.com Optical datasets feed machine-learning models that automatically adjust process variables, cutting post-processing and scrap. Structured-light scanners deliver contact-level accuracy on selective-laser-melted parts, while digital moiré analyses reveal a 7% volume gap versus CAD, underscoring the importance of closed-loop inspection.
Node-shrink driven precision needs in semiconductor front-end fabs
Sub-2 nm nodes force metrology accuracy below 0.2 nm, promoting hybrid techniques that fuse multiple sensors.[3]SPIE Digital Library, “Advanced Metrology for Sub-2 nm Nodes,” spiedigitallibrary.org Japan’s renewed investments in wafer-equipment capacity highlight optical flatness metrology’s transition from capacitance-based tools to non-contact systems that eliminate micro-contamination. White-light interferometers maintain topography control inside TSV processes with repeatability aligned to reference gauges.
Aerospace MRO shift to non-contact inspection for composite airframes
Thermographic signal reconstruction now finishes full airframe checks in 3-4 hours versus 10-14 hours previously, cutting downtime while spotting subsurface flaws.[4]CompositesWorld, “Thermography Innovations for Aircraft NDI,” compositesworld.com Dynamic scanning platforms paired with robotics lift point-cloud coverage by 18% on large fuselage parts. Portable systems such as LASLAT eliminate teardown, allowing inspections on the flight line.
Restraints Impact Analysis
| Restraint | (~)% Impact on CAGR Forecast | Geographic Relevance | Impact Timeline | |||
|---|---|---|---|---|---|---|
High up-front CAPEX for large-volume 3D scanners among SMEs High up-front CAPEX for large-volume 3D scanners among SMEs | −0.7% | Global, acute in emerging markets | Short term (≤2 years) | (~)% Impact on CAGR Forecast:−0.7% | Geographic Relevance:Global, acute in emerging markets | Impact Timeline:Short term (≤2 years) |
Measurement uncertainty on highly reflective hybrid composites Measurement uncertainty on highly reflective hybrid composites | −0.4% | NA & EU aerospace, APAC automotive | Medium term (2-4 years) | |||
Fragmented metrology software ecosystem creating data silos Fragmented metrology software ecosystem creating data silos | −0.5% | Global, multi-vendor sites | Long term (≥4 years) | |||
Supply-chain volatility in supercontinuum and UV optics Supply-chain volatility in supercontinuum and UV optics | −0.6% | Global, precision applications | Short term (≤2 years) | |||
| Source: Mordor Intelligence | ||||||
High up-front CAPEX for large-volume 3D scanners among SMEs
Systems such as ZEISS ATOS LRX, capable of scanning 4 m² areas and capturing 2×12 million points per frame, often exceed annual equipment budgets of small manufacturers. Leasing and measurement-as-a-service models offer relief but lack deep integration with automated cells, slowing broader uptake despite India’s incentive schemes that encourage modernization.
Measurement uncertainty on highly reflective hybrid composites
Vision-based methods record 2.4° to 4.6° total uncertainty on reflective TRICAP and TEPEX hybrids. Confocal microscopes require specialized calibration to maintain traceability, while hybrid optical-tactile setups improve accuracy at the cost of higher complexity.
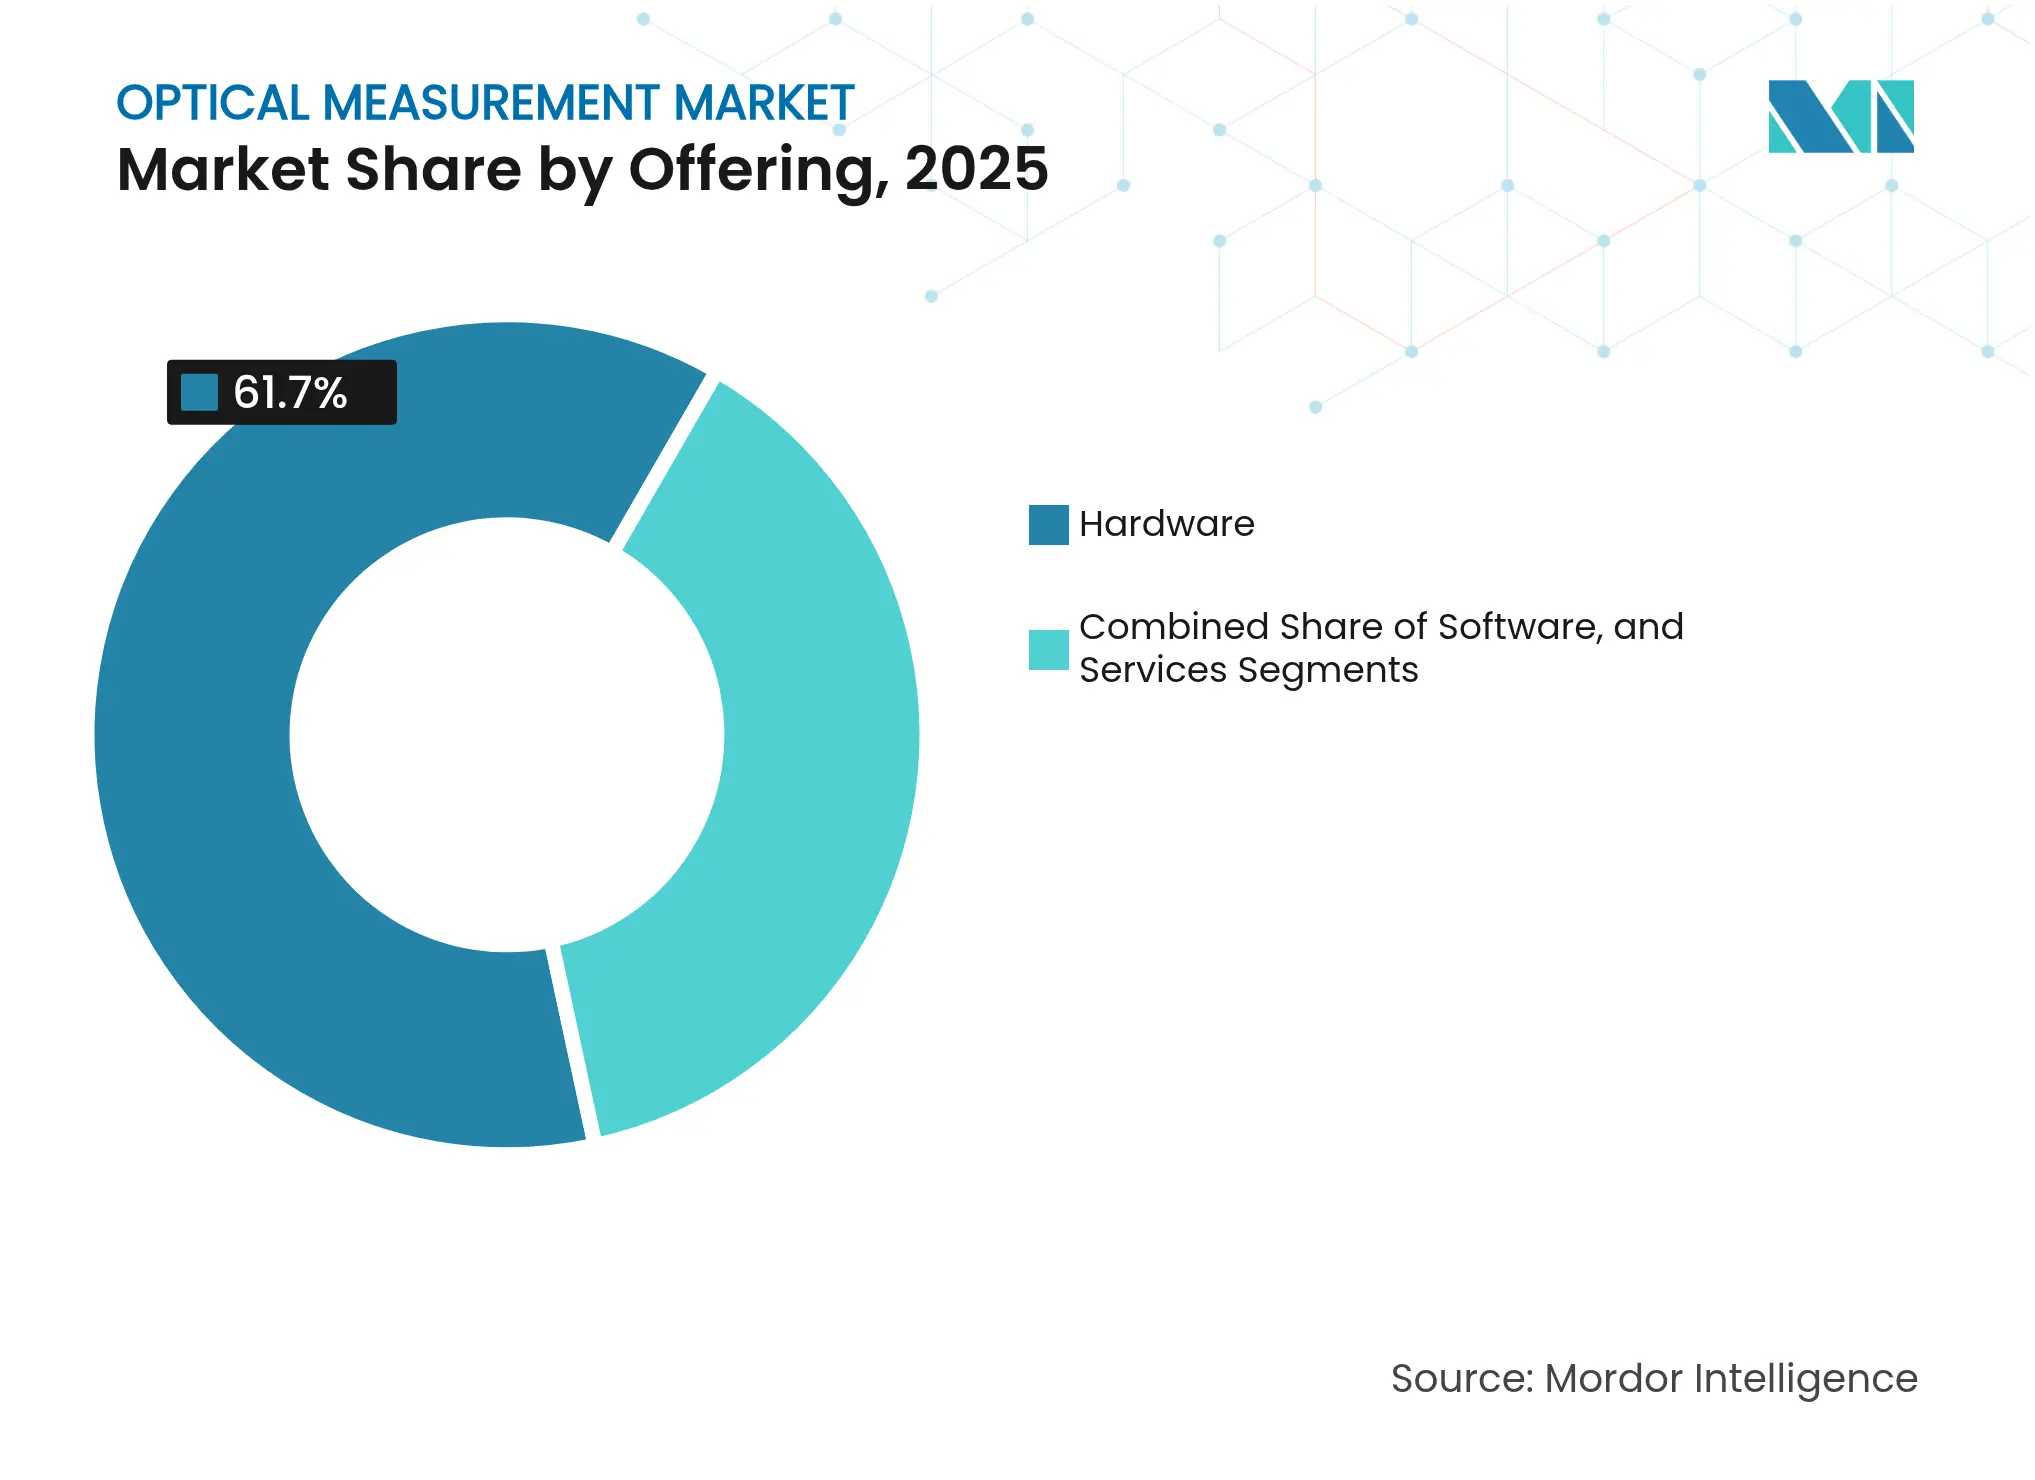
By Offering: Software Acceleration Drives Ecosystem Integration
Hardware dominated revenue with 61.70% share in 2025, reflecting continued dependence on coordinate measuring machines, optical digitizers, scanners, and vision systems for dimensional control mordorintelligence.com. Software, although smaller, is growing fastest at 6.62% CAGR as manufacturers embed analytics, AI, and remote collaboration into workflows. The optical measurement market benefits from vendors bundling sensors with cloud dashboards that unify quality data across plants
Coordinate measuring machines retained 41.10% of hardware revenue, supported by bridge and gantry models for battery packs and aerospace structures. Optical digitizers and scanners headline growth at 7.74% CAGR as additive manufacturing and reverse-engineering proliferate. The convergence of hardware and software blurs boundaries, with platforms such as Mitutoyo MeasurLink 10.1 linking Power BI analytics to inspection data. Services-calibration, retrofit, and trainingcement customer lock-in and open recurring-revenue streams.
Note: Segment shares of all individual segments available upon report purchase
By Dimension: 3D Measurement Dominance Reflects Complexity Demands
Three-dimensional inspection commanded 69.80% of optical measurement market share in 2025, a position underpinned by the need to capture full geometries in fewer setups. 3D systems are projected to compound at 7.89% CAGR through 2031 as free-form surfaces, lattice structures, and complex assemblies become commonplace in EV and aerospace production. Two-dimensional tools remain essential for flat-panel and wafer applications.
Advances in multi-sensor 3D profilers push nanometer-level uncertainty over large areas, while AI-driven defect recognition reduces operator dependency. Structured-light scanners slash cycle times and support reverse-engineering workflows. Chromatic confocal sensors now achieve 620 mm stand-off with sub-micrometer precision, extending optical metrology to deep cavities and large parts.
By Measurement Range: Large Volume Applications Drive Innovation
Small and medium components held 70.95% share in 2025 as electronics, medical, and precision automotive parts dominate inspection counts. However, large-volume (>1 m³) applications are forecast to grow 6.78% CAGR due to wind-turbine blades, aircraft structures, and EV battery enclosures. Portable laser trackers and photogrammetry rigs now reach millimeter accuracy across factory halls.
Robotic automation within these rigs increases accessibility around massive components, boosting repeatability while reducing worker exposure. Multi-station layouts let manufacturers merge point clouds from several arms, enabling full-field analyses of parts that exceed a single system’s envelope. AI scripting automates feature extraction, accelerating first-article approval for large assemblies.

Recognized by Experts. Trusted by Leaders.
A trusted intelligence partner to global decision-makers across 90+ countries.


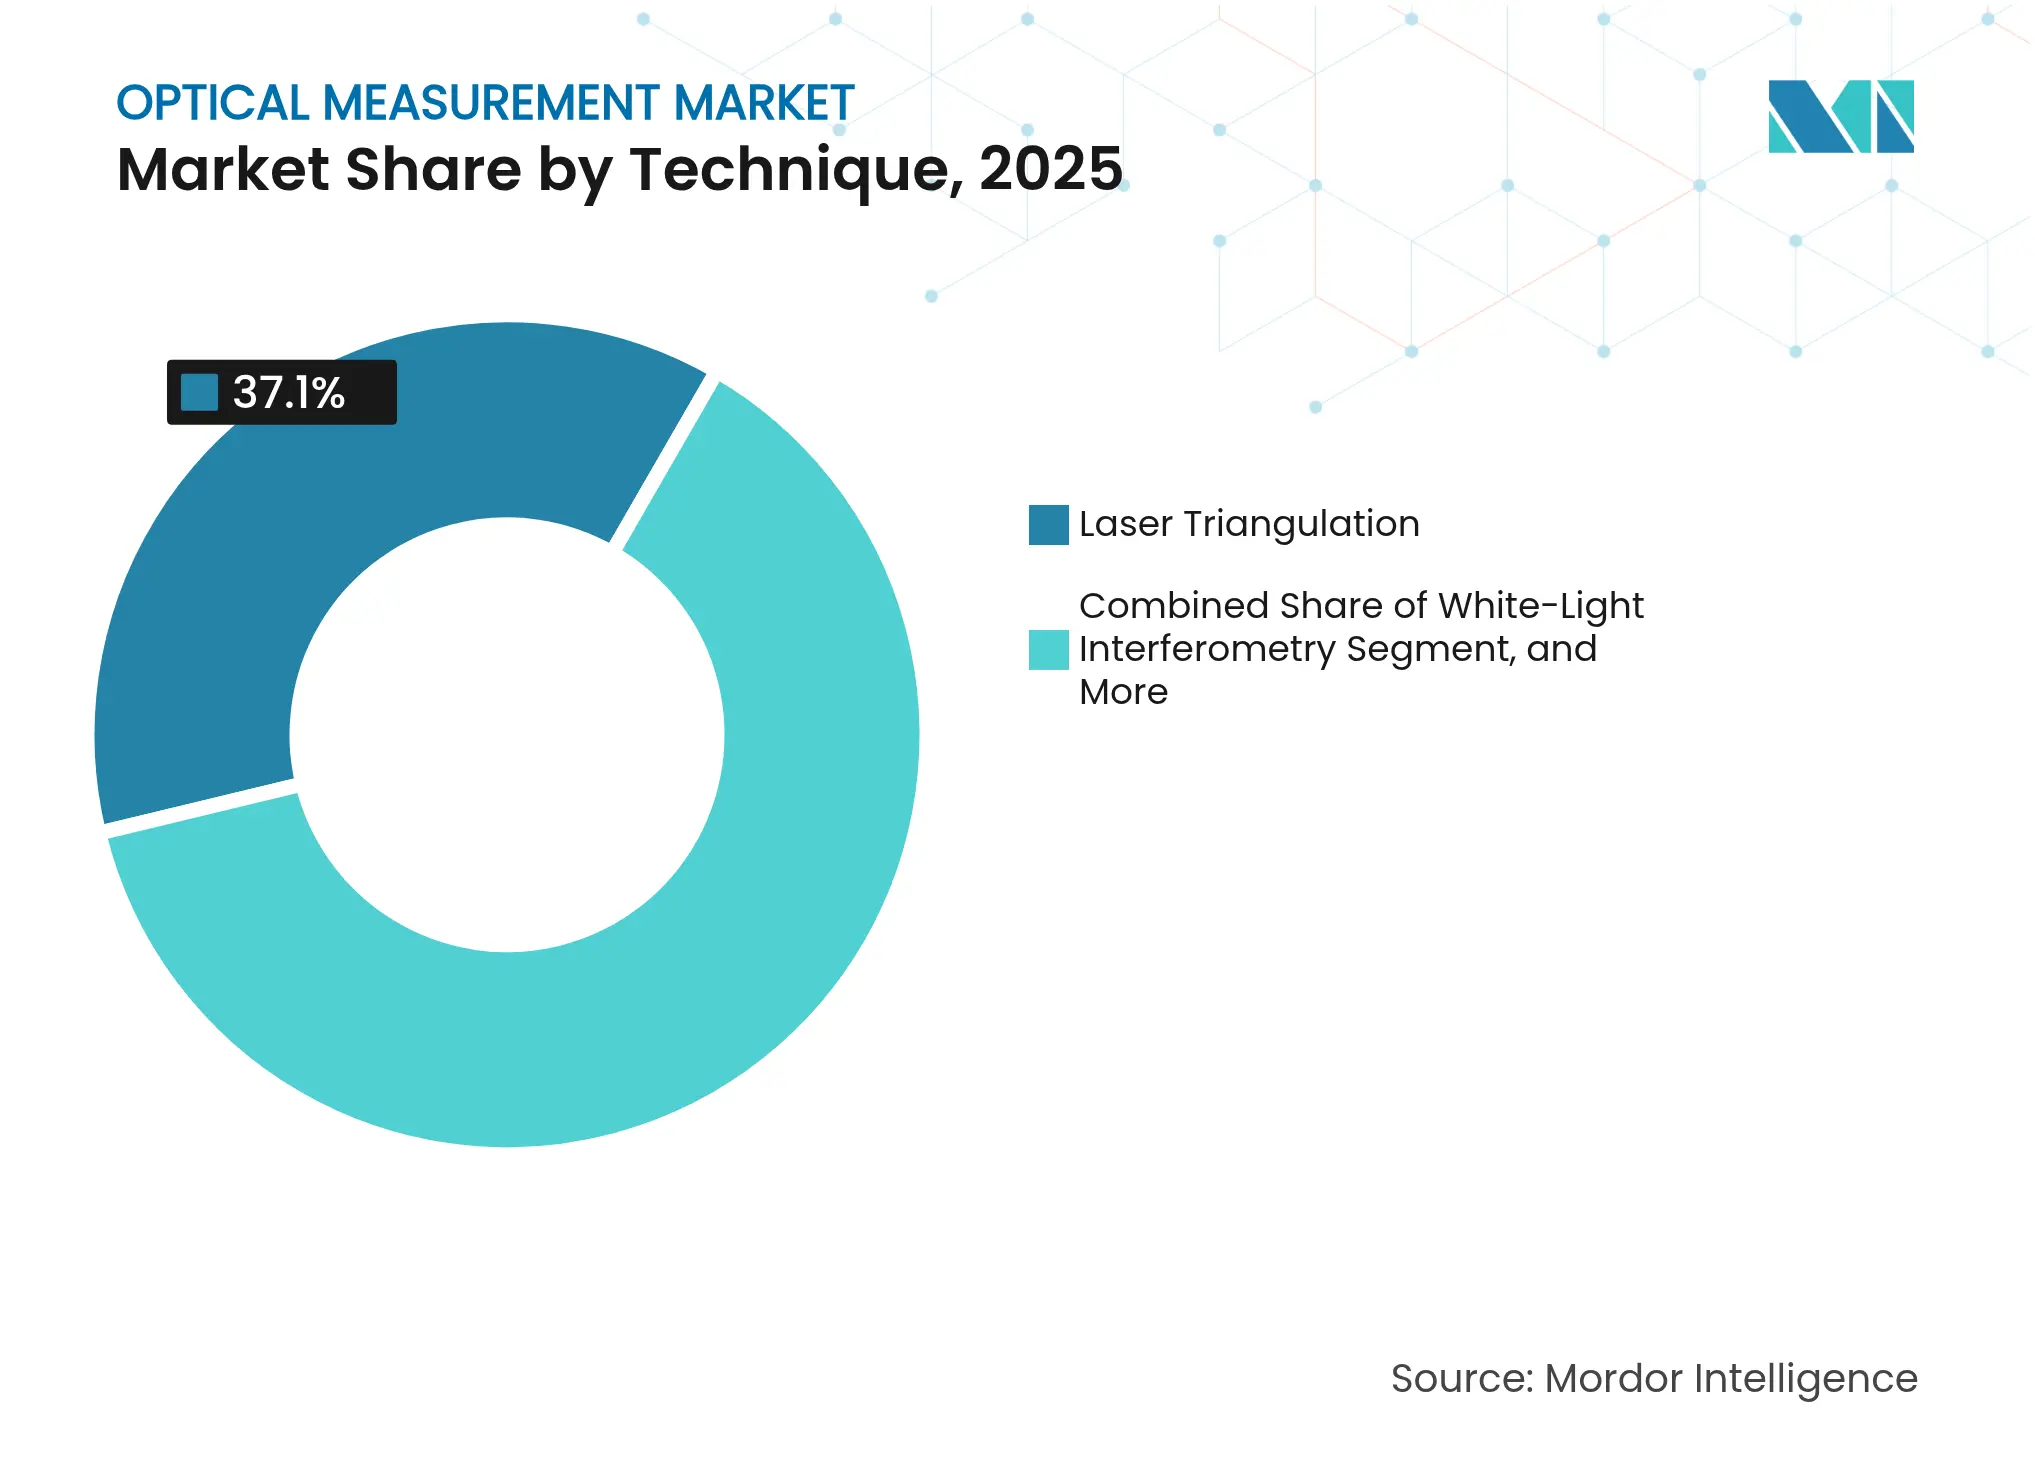
By Technique: White-Light Interferometry Gains Momentum
Laser triangulation remained the top technique with 37.10% share in 2025, prized for robustness and value. White-light interferometry is expected to register the fastest 7.43% CAGR as sub-nanometer precision becomes vital for advanced chips and miniaturized implants. Confocal microscopy usage widens for micro-surface texture, whereas time-of-flight tools find niches in long-range industrial alignment.
Hybrid systems blend interferometry with triangulation or confocal modules, delivering both speed and exactness. The acquisition of supercontinuum-laser pioneer NKT Photonics by Hamamatsu expands light-source choices for these interferometers, allowing broadband illumination for high-resolution, low-noise height mapping.
Note: Segment shares of all individual segments available upon report purchase
By End-user: Electronics-Semiconductor Surge Outpaces Automotive
Automotive lines comprised the largest slice at 25.20% of optical measurement market size in 2025, reflecting EV drivetrain precision and battery safety mandates. Electronics and semiconductor fabs, however, are projected for the quickest 7.08% CAGR, accelerated by AI server demand and China’s 2030 metrology blueprint. Aerospace and defense maintain steady uptake as composites and additive repairs proliferate.
Energy-sector requirements grow alongside wind and hydrogen investments, while medical manufacturing leans on interferometry for implant micro-finishing. Industrial machinery, research labs, and education round out demand, sustaining foundational metrology skills in the workforce.
Asia-Pacific delivered 37.80% of 2025 revenue and is expected to grow at a 6.97% CAGR to 2031, buoyed by Chinese laser-tool investment and Japan’s JPY 3.9 trillion semiconductor outlay between fiscal 2021 and 2023. India’s Production-Linked Incentive plans target a leap from 17% to 25% manufacturing GDP share, helping local firms finance metrology upgrades. Southeast Asian nations deepen electronics value-chains, further enlarging regional demand for dimensional control.
North America remains an innovation hub anchored by aerospace, defense, and advanced-node semiconductor fabs. Mexico’s light-vehicle plants and electronics assembly drive cross-border optical metrology installs, while Canada expands service networks via partnerships such as Hexagon–Elliott Matsuura. The United States gains from reshoring policies that tie incentives to stringent quality audits.
Europe secures share through German automotive excellence, French aerospace programs, and UK composites research. Germany’s Industry 4.0 adoption accelerates MES–metrology integration, whereas Nordic suppliers provide niche equipment for wind-energy blade and space-component inspections. Supply-chain volatility in germanium and gallium has tested European OEMs but also encouraged local sourcing of optical elements.
Market Concentration
The field shows moderate consolidation. Hexagon AB, Carl Zeiss AG, Nikon Corporation, and Renishaw plc deploy broad portfolios combined with global service reach. Recent moves include Hexagon’s USD 123 million take-over of Geomagic to couple point-cloud automation with sensor hardware. Hamamatsu’s purchase of NKT Photonics strengthens light-source breadth for interferometry, while Viavi’s acquisition of Inertial Labs widens inertial-navigation and optical test coverage. Supply-chain disruptions, particularly China’s export curbs on germanium and gallium, inflate optics costs and elongate lead times by 40 weeks, spurring multi-source strategies.
Emerging specialists such as Chipmetrics, funded with €2.4 million for ALD metrology, and Onto Innovation, securing a USD 69 million DRAM deal for thin-film gauges, signal that niche innovation still attracts capital. Private equity interest surfaced with Luxium’s USD 19 million bid for Inrad Optics, demonstrating confidence in component suppliers to high-precision instruments. AI-enhanced vision, multi-sensor fusion, and hybrid optical–tactile rigs headline next-wave differentiation.

*Disclaimer: Major Players sorted in no particular order
1. INTRODUCTION
2. RESEARCH METHODOLOGY
3. EXECUTIVE SUMMARY
4. MARKET LANDSCAPE
5. MARKET SIZE AND GROWTH FORECASTS (VALUES)
6. COMPETITIVE LANDSCAPE
7. MARKET OPPORTUNITIES AND FUTURE OUTLOOK
The optical measurement market encompasses the development, production, and application of technologies that use light, whether visible, infrared, or ultraviolet, to measure and analyze physical properties such as distance, shape, thickness, surface roughness, temperature, and displacement.
The study tracks the revenue accrued through the sale of optical measurements by various players across the globe. It also tracks the key market parameters, underlying growth influencers, and major vendors operating in the industry, which supports the market estimations and growth rates over the forecast period. The study further analyses the overall impact of COVID-19 aftereffects and other macroeconomic factors on the market. The report’s scope encompasses market sizing and forecasts for the various market segments.
The optical measurement market is segmented by offering (hardware and software), end-user (automotive, aerospace & defense, energy and power, electronics manufacturing, industrial, medical, and others), and geography (North America, Europe, Asia Pacific, Middle East and Africa, and Latin America. The market sizes and forecasts regarding value (USD) for all the above segments are provided.
Pricing Strategy for Semiconductor Components
3 Min Read
Accelerating Additive Manufacturing Adoption in India
3 Min Read
Deep-Dive Analysis of Feed Probiotics Across Key Regions
5 Min Read
When decisions matter, industry leaders turn to our analysts. Let’s talk.