Programmable Optics Market Size and Share
Market Overview
| Study Period | 2019 - 2030 |
|---|---|
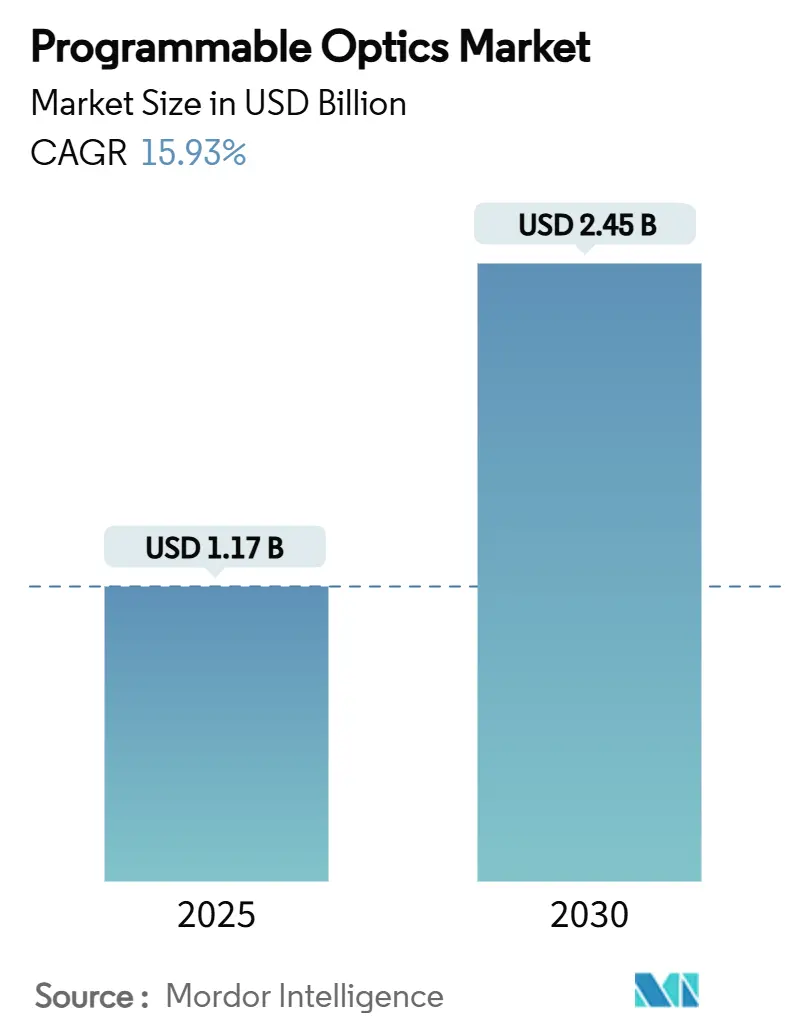
| Market Size (2025) | USD 1.17 Billion |
| Market Size (2030) | USD 2.45 Billion |
| Growth Rate (2025 - 2030) | 15.93% CAGR |
| Fastest Growing Market | Asia Pacific |
| Largest Market | North America |
| Market Concentration | Medium |
Major Players *Disclaimer: Major Players sorted in no particular order Image © Mordor Intelligence. Reuse requires attribution under CC BY 4.0. | |
Programmable Optics Market Analysis by Mordor Intelligence
The programmable optics market size was USD 1.17 billion in 2025 and is projected to reach USD 2.45 billion by 2030, registering a 15.93% CAGR in the forecast period. This growth stems from rapid shifts toward active, software-defined optical architectures that overcome the performance ceilings of conventional static components. Rising LiDAR content per vehicle, AI-intensive datacenters, and defense modernization are pushing procurement teams to favor devices that re-shape phase, amplitude, or polarization in real time. The pivot to metasurface platforms signals a structural cost curve shift, while rare-earth material supply risks remain the principal brake on scaling. Early evidence of 48-hour additive manufacturing cycles and AI-generated optical layouts indicates a future in which design velocity rivals that of electronics, positioning the programmable optics market for sustained double-digit expansion.
Key Report Takeaways
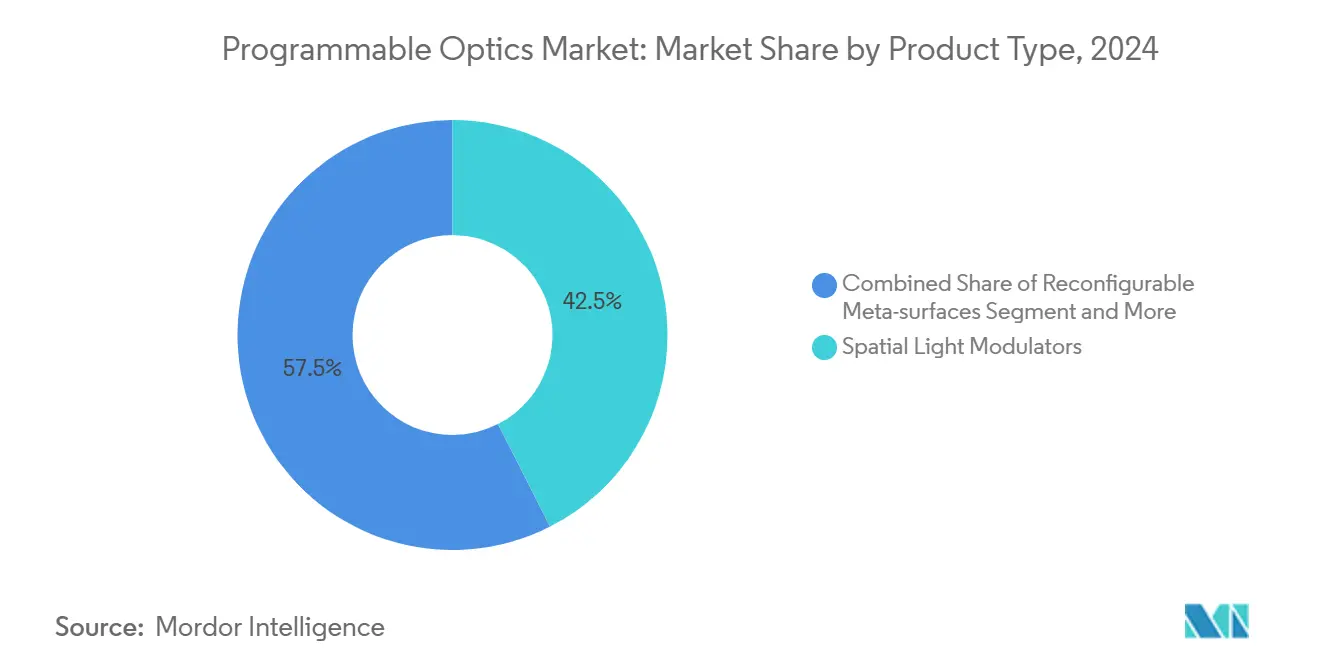
- By product type, Spatial Light Modulators led with 42.5% revenue share in 2024; reconfigurable metasurfaces are forecast to expand at a 17.16% CAGR to 2030.
- By end-user industry, telecommunications held 28.4% of the programmable optics market share in 2024; automotive records the highest projected CAGR at 18.76% to 2030.
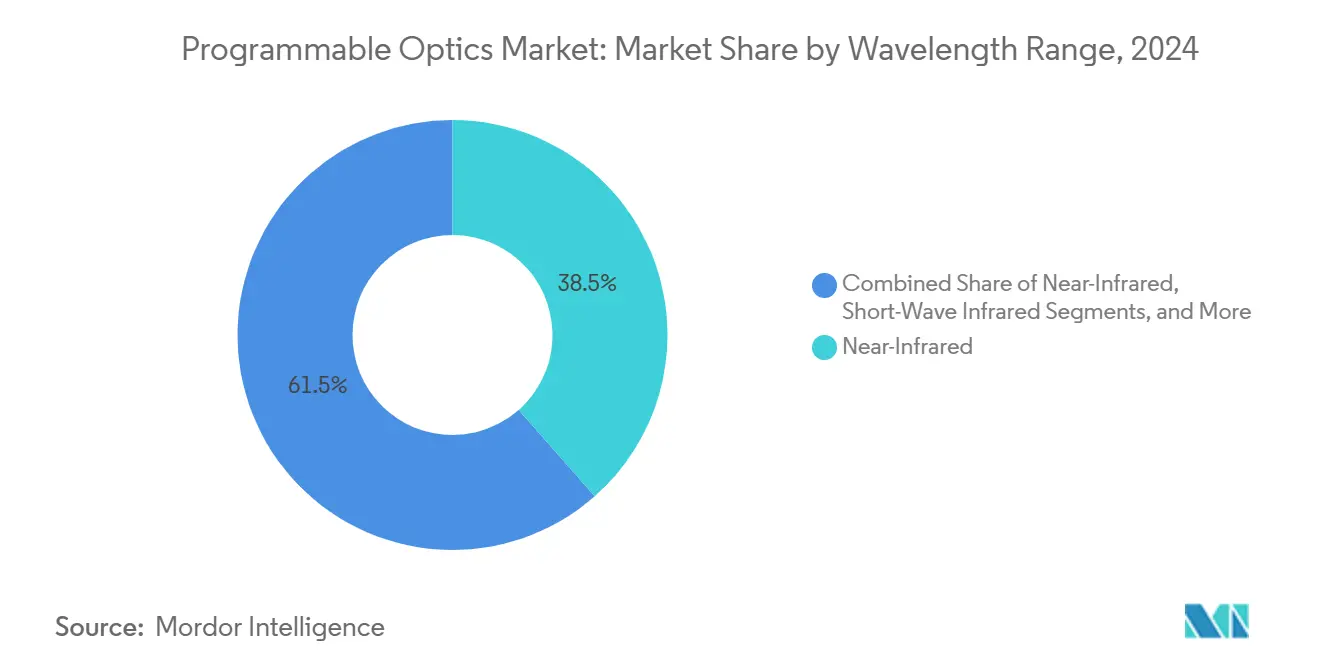
- By wavelength range, near-infrared dominated with 38.5% share in 2024; short-wave infrared is set to rise at a 17.96% CAGR through 2030.
- By geography, North America commanded a 36.2% share in 2024, whereas the Asia-Pacific is projected to post the fastest 19.15% CAGR through 2030.
Global Programmable Optics Market Trends and Insights
Drivers Impact Analysis*
| Driver | (~) % Impact on CAGR Forecast | Geographic Relevance | Impact Timeline |
|---|---|---|---|
| Surge in LiDAR adoption for autonomous vehicles | +3.20% | North America and APAC core, spill-over to Europe | Medium term (2-4 years) |
| Bandwidth-hungry optical communication networks | +4.10% | Global, with concentration in APAC and North America | Long term (≥ 4 years) |
| High-resolution AR/VR display demand | +2.80% | North America and APAC core, expanding to Europe | Medium term (2-4 years) |
| Rising defense spend on adaptive-optics systems | +2.30% | North America and Europe, selective APAC markets | Long term (≥ 4 years) |
| Photonic neural-network hardware requirements | +2.90% | Global, led by North America and China | Long term (≥ 4 years) |
| Eco-efficient datacenter optical interconnects | +1.80% | Global, concentrated in major datacenter hubs | Medium term (2-4 years) |
| Source: Mordor Intelligence | |||
Surge in LiDAR Adoption for Autonomous Vehicles
Vehicle OEMs are replacing bulky mechanical scanners with programmable beam-steering modules that cut component count 40% while preserving 200 m range, as illustrated by MicroVision’s MOVIA platform. Regulatory momentum for Level 4 autonomy in China and the United States converts each car into a multi-sensor hub, expanding the addressable programmable optics market. Partnerships such as Continental–NVIDIA fuse adaptive optics with AI, enabling on-the-fly tuning to rain, fog, or glare. The 2024 semiconductor crunch further accelerated this shift because multi-function optical engines reduce chip demand.
Bandwidth-Hungry Optical Communication Networks
AI training clusters now require 51.2 Tbps optical fabrics with sub-microsecond reconfiguration, delivered by coherent switches that adjust wavelength paths in real time. China’s CNY 8.2 billion silicon-photonics program funds domestic programmable interconnects, while IOWN Global Forum aligns Microsoft, Google, and Intel behind all-photonic networks. As 6 G moves toward optical fronthaul, carriers such as Lumen are repositioning as AI infrastructure providers, embedding programmable optics deep inside backbone routes.
High-Resolution AR/VR Display Demand
Enterprise XR rollouts need eyewear that adapts focal length to user tasks across multi-hour sessions. Meta’s filed patents on gradient-index liquid-crystal optics attack the long-standing vergence-accommodation conflict. Samsung’s waveguide stacks hit 4 K per eye by integrating programmable holographic layers, driving new premium-price opportunities in medical visualization and engineering design. Academic advances, including Princeton’s glasses-free holography, reinforce uptake beyond entertainment.
Photonic Neural-Network Hardware Requirements
Optical tensor processors demonstrated at MIT show 137× energy efficiency versus electronics, validating capital inflows to startups like Celestial AI (USD 175 million Series C)[1]Febin Sunny, “OPIMA: Optical processing-in-memory for convolutional neural network acceleration,” arXiv, arxiv.org. Tsinghua’s Taichi chip drives 160 TOPS/W by embedding programmable waveguides, cutting datacenter energy budgets. Algorithm-defined optics empower dynamic shifts between training and inference modes without hardware swaps, cementing a long-run pull for adaptive photonics in AI clusters.
Restraints Impact Analysis*
| Restraint | (~) % Impact on CAGR Forecast | Geographic Relevance | Impact Timeline |
|---|---|---|---|
| High manufacturing cost of SLMs | -2.10% | Global, particularly impacting emerging markets | Short term (≤ 2 years) |
| Lack of metasurface design standards | -1.80% | Global, with regulatory gaps in APAC | Medium term (2-4 years) |
| Thermal-stability limits of phase-change media | -1.30% | Global, acute in high-temperature applications | Long term (≥ 4 years) |
| Rare-earth material supply risks | -2.40% | Global, concentrated impact on China-dependent supply chains | Medium term (2-4 years) |
| Source: Mordor Intelligence | |||
High Manufacturing Cost of SLMs
Liquid-crystal alignment and micro-mirror arrays rely on specialty fabs outside mainstream CMOS lines, constraining yield economics. Fraunhofer IPMS showed 2.2 million-mirror SLMs with technical success, yet cost hurdles that limit consumer volumes[2]Fraunhofer IPMS, “Spatial light modulators,” ipms.fraunhofer.de. The OPTICS48 project is piloting laser-printed optics in 48 hours, hinting at near-term cost compression paths. Until alternative workflows reach scale, price points restrain mass adoption.
Rare-Earth Material Supply Risks
China’s export curbs on gallium and germanium pushed spot germanium prices up 75% since 2023, jeopardizing dielectric layer supply for adaptive lenses. Research into graphene-oxide metalenses offers functional parity without heavy reliance on restricted elements[3]Yuxi Chen, “Design of an achromatic graphene oxide metalens with multi-wavelength for visible light,” Photonics, doi.org. However, qualification and tooling transitions need 3–5 years, leaving the programmable optics market sensitive to geopolitical shocks in the mid-term.
*Our forecasts treat driver/restraint impacts as directional, not additive. The impact forecasts reflect baseline growth, mix effects, and variable interactions.
Segment Analysis
By Product Type: Metasurfaces Challenge SLM Dominance
The Spatial Light Modulators (SLMs) retain a 42.5% share in the market in 2024. Reconfigurable metasurfaces are scaling at 17.16% CAGR, steadily closing the gap as electronics-grade lithography cuts unit cost. This shift anchors the programmable optics market size leadership contest between macro-pixel SLM arrays and nanostructured films.
Metasurfaces rewrite beam-steering physics by sculpting phase at the unit-cell level, enabling wafer-level optics for LiDAR mirrors or AR waveguides. Caltech’s electrically tunable metasurface that splits one pulse into multiple steered beams eliminates mechanical tilt stages[4]Margo Anderson, “Optical metasurfaces shine a light on Li-Fi, Lidar,” IEEE Spectrum, spectrum.ieee.org. As additive nano-printing matures, metasurface cost trajectories intersect SLM pricing, accelerating substitution.


By End-User Industry: Automotive Disrupts Telecom Leadership
Telecom and Datacom contributed the largest revenue slice at 28.4% in 2024, anchored in fiber switching and ROADMs. Automotive, however, is compounding 18.76% annually as Level 3-4 autonomy and adaptive headlights embed optics across drivetrain, cabin, and chassis.
Continental’s intelligent headlamp projects navigation cues directly onto asphalt, illustrating the drive toward software-defined vehicles. Consumer electronics and healthcare follow, incorporating antenna-in-package optics for computational imaging and precision surgery tools.
By Wavelength Range: Infrared Expansion Drives Growth
Near-infrared kept top share at 38.5% yet short-wave infrared is growing 17.96% CAGR as telecom carriers exploit low-loss atmospheric windows. Mid-infrared adoption in thermal imaging and chemical sensing benefits from on-chip tunable metasurface filters, while ultraviolet remains niche but indispensable for semiconductor lithography.
Graphene-oxide metalens research shows achromatic response across visible-to-SWIR windows, hinting at single-lens multi-band products[5]Yuxi Chen, “Design of an achromatic graphene oxide metalens with multi-wavelength for visible light,” Photonics, doi.org.
Geography Analysis
North America generated the largest revenue in 2024, accounting for 36.2% of the programmable optics market share. Defense allocations, spearheaded by a USD 277 million Air Force adaptive-optics contract to Boeing, anchor stable demand. Venture funding clusters around Silicon Valley, where Celestial AI and Lumotive secured USD 175 million and USD 45 million rounds, respectively, tightening the innovation loop between startups and hyperscalers. Federal incentives under the CHIPS Act lower domestic fab costs, although raw-material exposure to Chinese restrictions remains a strategic weak spot.
Asia-Pacific is forecast to post the fastest 19.15% CAGR through 2030, thanks to China’s CNY 8.2 billion silicon-photonics build-out and Japan’s precision optics leadership via Hamamatsu. Korea’s logic-optics co-packaging roadmaps accelerate integration, while Taiwan’s contract fabs prepare multi-project wafers for photonic ICs. Regional 5 G–to-6 G upgrades mandate adaptive optical switching, and domestic automakers’ LiDAR adoption pulls volumes into local supply chains.
Europe represents a technology-rich yet fragmented opportunity base. German institutes like Fraunhofer IPT pioneer 48-hour optics manufacturing, and EU digital sovereignty policies direct grants toward indigenous metasurface startups. Automotive stalwarts such as Continental fuel demand for adaptive headlights and cabin displays, yet multi-country regulatory hurdles can delay commercialization relative to U.S. or Chinese markets.


Competitive Landscape
Competition is moderately fragmented. Incumbents Hamamatsu Photonics and Santec leverage decades of coating and detector know-how, defending share in industrial and biomedical channels. Disruptors Celestial AI, Lumotive, and Lightmatter target photonic compute and LiDAR niches with venture capital-backed agility.
Strategic tie-ups blur sector lines: NVIDIA pairs with Continental to meld programmable optics and autonomous-drive AI; Microsoft co-leads the IOWN Global Forum to steer optical internet architectures. Patent races intensify around metasurface phase engineering and neural-network topologies, with Meta and Google filing slanted-grating and holographic IP. Acquisition activity rose in 2024–2025 as Torrent Photonics bought Knight Optical to consolidate mid-tier capabilities, and ams OSRAM divested laser assets to Focuslight for footprint rationalization.
Cost leadership is pivoting from wafer volume to algorithmic design; UCLA’s OptoGPT produced multilayer layouts using fewer patterning steps, a software advantage unattainable via classic optical houses. Standards participation confers additional leverage—players seated on ISO/TC 172 committees can shape compliance paths that favor their component portfolios.
Programmable Optics Industry Leaders
Lumotive, Inc.
Thorlabs, Inc.
HOLOEYE Photonics AG
Meadowlark Optics, Inc.
Hamamatsu Photonics K.K.
- *Disclaimer: Major Players sorted in no particular order


Recent Industry Developments
- July 2025: UCLA unveiled AI-designed 3D refractive function generators that route light unidirectionally, boosting prospects for low-latency optical interconnects. Strategy: capitalize on software-driven design to sidestep lithography limits.
- June 2025: Nagoya Institute of Technology introduced passive metasurface filters that raise the desired signal magnitude by 10 dB, pitching zero-power IoT links. Strategy: remove power budgets from RF front ends in battery-constrained devices.
- May 2025: Fraunhofer IPMS scaled SLM mirror counts to 2.2 million, paving paths for high-resolution holography. Strategy: offer an alternative to metasurfaces by pushing legacy platform resolution ceilings.
- April 2025: ISO confirmed Seoul as host of the 2025 International AI Standards Summit, signaling formal governance frameworks that will shape autonomous-system optics. Strategy: influence rule-making that can favor compliant component vendors.


Global Programmable Optics Market Report Scope
| Spatial Light Modulators (SLM) |
| Reconfigurable Meta-surfaces |
| Tunable Lenses and Mirrors |
| Reconfigurable Optical Filters |
| Others (Beam Steering Modules, Optical Switches and more) |
| Telecom and Datacom |
| Aerospace and Defense |
| Automotive |
| Consumer Electronics |
| Medical and Life Sciences |
| Industrial and Manufacturing |
| Scientific Research |
| Visible |
| Near-Infrared |
| Short-Wave Infrared |
| Others (Ultraviolet (UV), Mid-Infrared (Mid-IR)) |
| North America | United States |
| Canada | |
| Mexico | |
| Europe | United Kingdom |
| Germany | |
| France | |
| Italy | |
| Spain | |
| Rest of Europe | |
| Asia-Pacific | China |
| Japan | |
| South Korea | |
| India | |
| Australia | |
| Rest of Asia-Pacific | |
| Middle East and Africa | |
| South America |
| By Product Type | Spatial Light Modulators (SLM) | |
| Reconfigurable Meta-surfaces | ||
| Tunable Lenses and Mirrors | ||
| Reconfigurable Optical Filters | ||
| Others (Beam Steering Modules, Optical Switches and more) | ||
| By End-User Industry | Telecom and Datacom | |
| Aerospace and Defense | ||
| Automotive | ||
| Consumer Electronics | ||
| Medical and Life Sciences | ||
| Industrial and Manufacturing | ||
| Scientific Research | ||
| By Wavelength Range | Visible | |
| Near-Infrared | ||
| Short-Wave Infrared | ||
| Others (Ultraviolet (UV), Mid-Infrared (Mid-IR)) | ||
| By Geography | North America | United States |
| Canada | ||
| Mexico | ||
| Europe | United Kingdom | |
| Germany | ||
| France | ||
| Italy | ||
| Spain | ||
| Rest of Europe | ||
| Asia-Pacific | China | |
| Japan | ||
| South Korea | ||
| India | ||
| Australia | ||
| Rest of Asia-Pacific | ||
| Middle East and Africa | ||
| South America | ||


Key Questions Answered in the Report
What is the projected value of the programmable optics market in 2030?
The programmable optics market is forecast to reach USD 2.45 billion by 2030.
Which product category is expected to grow the fastest?
Reconfigurable metasurfaces are projected to grow at a 17.16% CAGR between 2025 and 2030.
Why is Asia-Pacific the fastest-growing region?
Massive silicon-photonics investments in China and extensive 5 G-to-6 G upgrades propel a 19.15% CAGR through 2030.
How will automotive demand affect optical suppliers?
Automotive applications are expanding 18.76% annually, increasingly specifying adaptive LiDAR, headlamp, and cabin optics modules.
What is the main supply-chain risk for manufacturers?
Dependence on rare-earth materials such as gallium and germanium exposes producers to geopolitical export restrictions that could limit output.
Page last updated on:


