Market Overview
| Study Period | 2020 - 2031 |
|---|---|
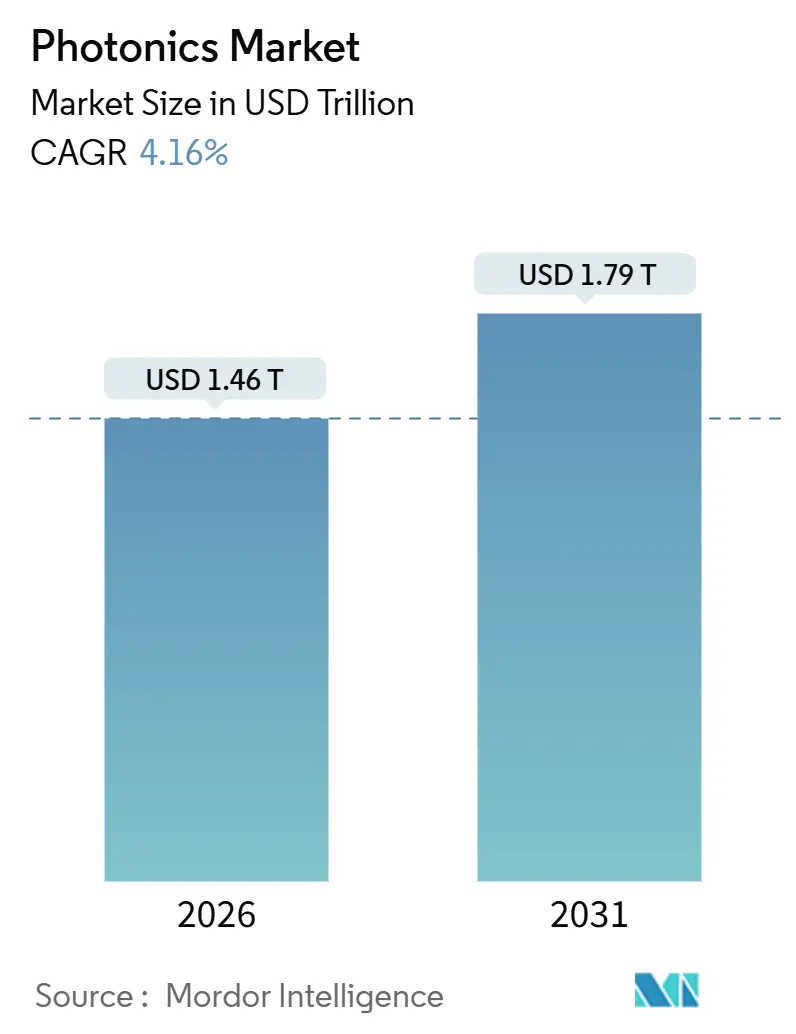
| Market Size (2026) | USD 1.46 Trillion |
| Market Size (2031) | USD 1.79 Trillion |
| Growth Rate (2026 - 2031) | 4.16% CAGR |
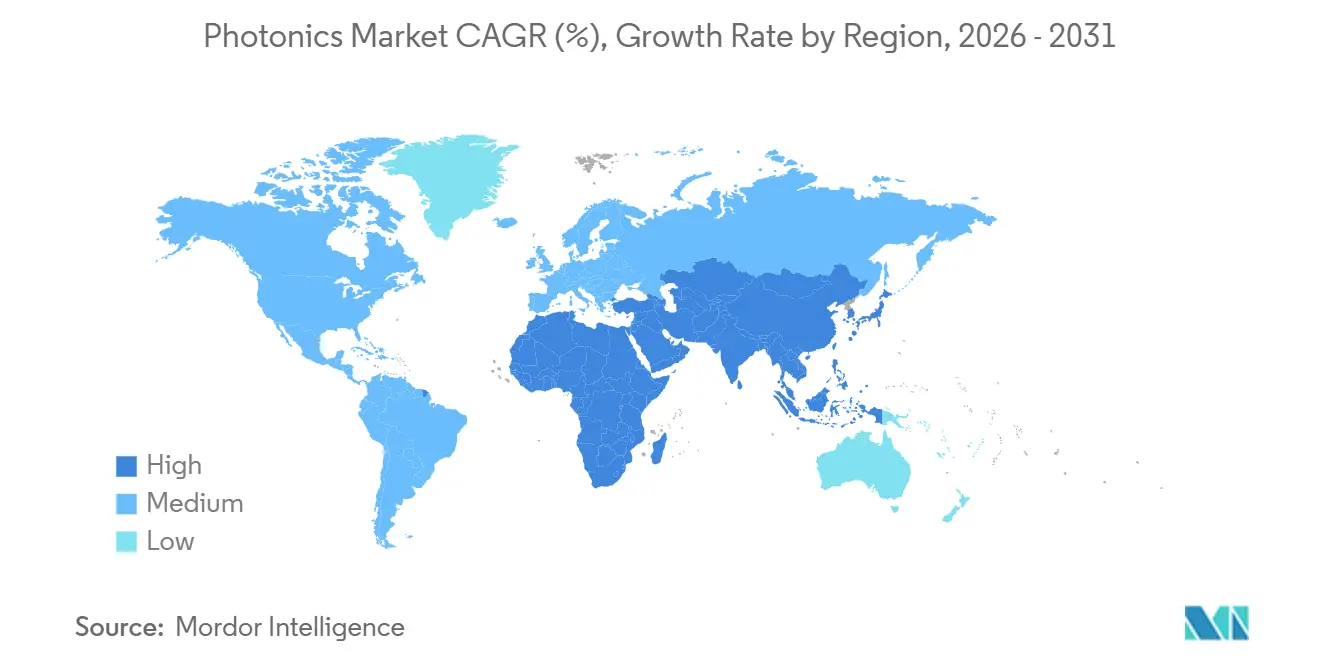
| Fastest Growing Market | Middle East and Africa |
| Largest Market | Asia Pacific |
| Market Concentration | Low |
Major Players*Disclaimer: Major Players sorted in no particular order Image © Mordor Intelligence. Reuse requires attribution under CC BY 4.0. |
|
Photonics Market Analysis by Mordor Intelligence
The photonics market size reached USD 1.46 trillion in 2026 and is projected to climb to USD 1.79 trillion by 2031, translating into a 4.16% CAGR over the forecast period. A structural pivot toward compound-semiconductor platforms and integrated photonic circuits is lifting average selling prices despite commoditization pressures in legacy LED backlighting. Hyperscale data-center operators have begun volume deployments of 800-gigabit and 1.6-terabit silicon-photonics transceivers to support artificial-intelligence training clusters. Chinese automotive OEMs are embedding light-detection-and-ranging (LiDAR) units in mid-tier electric vehicles at penetration rates that already surpass Western adoption curves. Meanwhile, the European Union and India are directing capital-expenditure subsidies toward gallium-nitride and indium-phosphide wafer fabs, reshoring supply chains historically centered in East Asia.
Key Report Takeaways
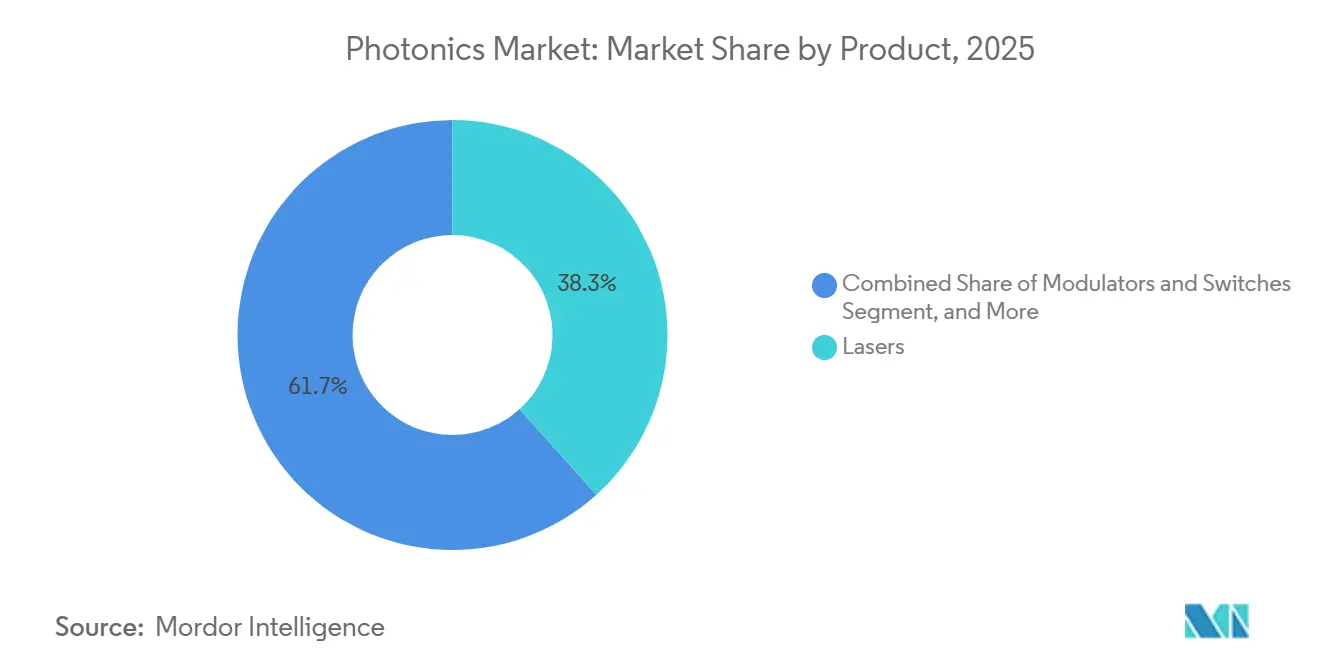
- By product category, lasers held a 38.32% share of the photonics market in 2025, whereas modulators and switches are forecast to expand at a 4.91% CAGR through 2031.
- By material, silicon captured 34.52% revenue share in 2025, while polymers and plastics are growing at a 4.67% CAGR to 2031.
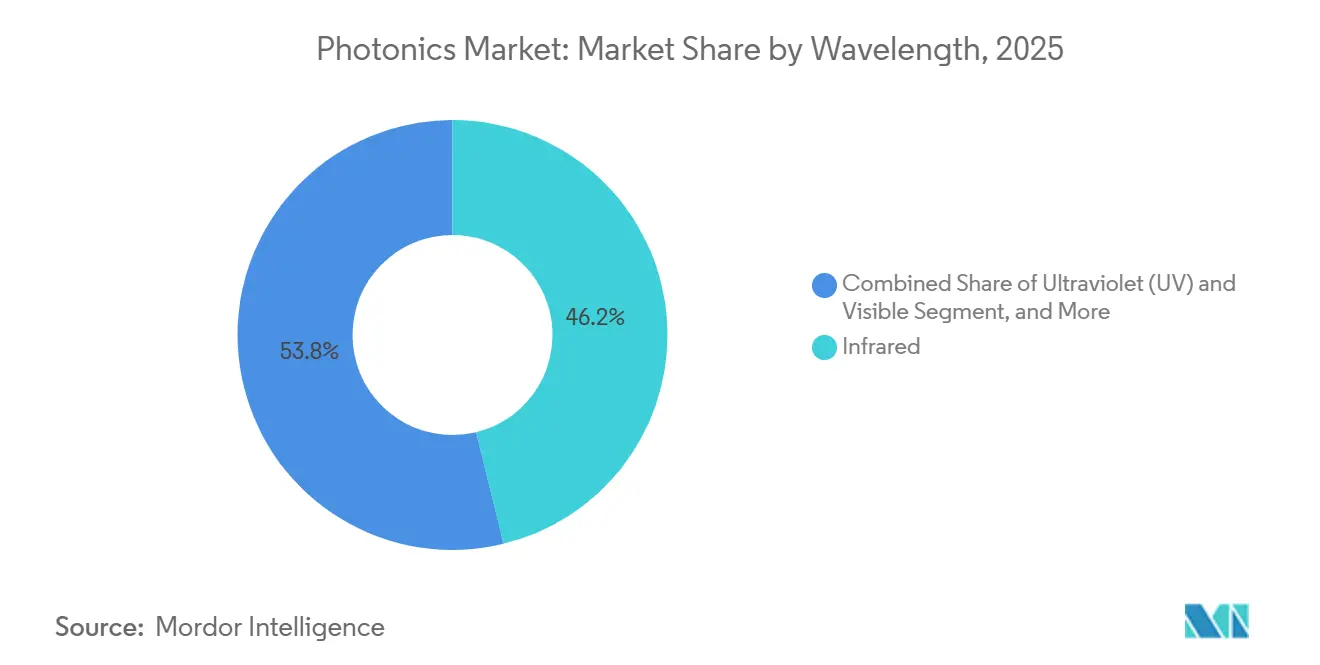
- By wavelength, infrared accounted for 46.18% of the photonics market share in 2025, and ultraviolet applications are advancing at a 5.02% CAGR through 2031.
- By end-user industry, data and telecom led with 27.71% revenue share in 2025; the automotive segment is projected to rise at a 4.78% CAGR through 2031.
- By geography, Asia Pacific commanded 41.37% of 2025 revenue, and the Middle East is set to post a 5.23% CAGR to 2031.
Note: Market size and forecast figures in this report are generated using Mordor Intelligence’s proprietary estimation framework, updated with the latest available data and insights as of January 2026.
Global Photonics Market Trends and Insights
Drivers Impact Analysis*
| Driver | (~) % Impact on CAGR Forecast | Geographic Relevance | Impact Timeline |
|---|---|---|---|
| Proliferation of Data-Center Interconnect Spurring Silicon Photonics Transceiver Demand | +0.90% | North America, Europe, Asia Pacific (China hyperscalers) | Medium term (2-4 years) |
| Adoption of LiDAR-Based ADAS Across Chinese Automotive OEMs | +0.70% | Asia Pacific (China core, spill-over to ASEAN) | Short term (≤ 2 years) |
| EU Green-Deal Incentives for Micro-LED and GaN Photonics Fabs | +0.50% | Europe (Germany, France, Netherlands) | Long term (≥ 4 years) |
| India's PLI Scheme Catalyzing Domestic Photonics Clusters | +0.30% | Asia Pacific (India, early gains in Bengaluru, Hyderabad) | Medium term (2-4 years) |
| Point-of-Care Biosensing Surge in United States and Europe | +0.40% | North America and Europe | Short term (≤ 2 years) |
| Satellite Mega-Constellation Investments in Space-Qualified Photonics | +0.30% | Global (launch sites in North America, Europe, Asia Pacific) | Long term (≥ 4 years) |
| Source: Mordor Intelligence | |||
Proliferation Of Data-Center Interconnect Spurring Silicon-Photonics Transceiver Demand
Hyperscale operators are upgrading from 400-gigabit pluggable optics to 800-gigabit and 1.6-terabit co-packaged modules to lower latency and power budgets in AI training clusters.[1]Broadcom Inc., “Tomahawk 5 Co-Packaged Optics Announcement,” broadcom.com Intel reported 40% year-over-year silicon-photonics revenue growth in 2024, anchored by shipments into GPU pods exceeding 10,000 accelerators per hall.[2] Lumentum’s 1.6-terabit Cloud AI platform delivers 15-watt thermal envelopes, encouraging data-center architects to replace discrete transceivers with on-board optics. Traditional module vendors are therefore acquiring photonic-IC design houses to protect gross margins. The ramp is exposing a shortage of indium-phosphide gain chips, where substrate capacity remains limited to 100 mm wafers in Japan and the United States.
Adoption Of LiDAR-Based ADAS Across Chinese Automotive OEMs
Chinese electric-vehicle brands integrated LiDAR sensors into 1.2 million passenger cars during 2025, an 18% penetration rate that dwarfed the 7% seen in Europe and North America. BYD’s Seal and Han models employ USD 500 solid-state units from Hesai, halving the cost of mechanically scanned alternatives.[3]Hesai Technology, “AT128 Solid-State LiDAR Specifications,” hesaitech.com NIO pairs Innovusion 1,550-nanometer fiber-laser units with long-range detection that EU regulators are evaluating for Level 3 autonomy certification. Rapid uptake is compressing cost curves for gallium-arsenide edge-emitting lasers, enabling tier-two suppliers to introduce sub-USD 300 modules by late 2026. The trend is creating spill-over demand for silicon avalanche photodiodes and high-frequency driver ICs.
EU Green-Deal Incentives for Micro-LED And GaN Photonics Fabs
The European Commission allocated EUR 1.2 billion (USD 1.3 billion) in 2024 to co-finance gallium-nitride and micro-LED lines in Germany, France, and the Netherlands. Germany approved EUR 500 million (USD 545 million) for a 200 mm GaN-on-silicon fab in Saxony led by Infineon and AMS OSRAM. France earmarked EUR 300 million (USD 327 million) for a micro-LED pilot line in Grenoble targeting automotive head-up displays. Subsidies cover up to 40% of capital expenditure, contingent on local-content and carbon-intensity thresholds. The initiative seeks to cut reliance on Taiwanese epitaxial suppliers that hold 70% of global GaN capacity.
India’s PLI Scheme Catalyzing Domestic Photonics Clusters
In March 2024, India extended its Production-Linked Incentive scheme to silicon photonics, offering 50% capital-expenditure reimbursement for fabs producing integrated photonic circuits and optical transceivers. The program targets INR 50 billion (USD 600 million) in investment by 2028 and requires 60% domestic value addition plus 40% export commitments. Bengaluru and Hyderabad are emerging as hubs, with the Indian Institute of Science establishing a 200 mm foundry in partnership with Applied Materials and Lam Research. Tata Electronics has committed INR 12 billion (USD 144 million) to a transceiver assembly plant in Gujarat, scheduled to ship in 2026. Fast-track environmental clearances and duty exemptions are mitigating historical barriers to upstream manufacturing.
Restraints Impact Analysis*
| Restraint | (~) % Impact on CAGR Forecast | Geographic Relevance | Impact Timeline |
|---|---|---|---|
| Compound-Semiconductor Wafer Bottlenecks (InP, GaN <150 mm) | -0.60% | Global (acute in Asia Pacific, North America) | Medium term (2-4 years) |
| Thermal-Management Limits on >10 kW Diode Lasers | -0.30% | Europe, North America (industrial manufacturing hubs) | Short term (≤ 2 years) |
| Interoperability Gaps Among Integrated Photonic IC Standards | -0.20% | Global (data-center and telecom segments) | Long term (≥ 4 years) |
| U.S.–China Trade Controls Elevating Cap-Ex Risk for Tool Makers | -0.40% | Global (acute in Asia Pacific, North America equipment suppliers) | Medium term (2-4 years) |
| Source: Mordor Intelligence | |||
Compound-Semiconductor Wafer Bottlenecks (InP, GaN <150 mm)
Indium-phosphide and gallium-nitride substrates remain confined to 100 mm and 150 mm sizes, keeping wafer prices at USD 1,500 and USD 800 respectively versus USD 50 for 300 mm silicon. Lead times stretched to 26 weeks in 2025 as coherent-transceiver demand spiked. Trade controls imposed by the United States on metal-organic chemical-vapor-deposition tools further tightened supply, forcing Chinese fabs to qualify domestic equipment. Scaling to 200 mm faces defect densities above 10^4 cm^-2 that degrade yield. The constraint is most acute in radio-frequency power amplifiers and high-power lasers where silicon substitutes are infeasible.
Thermal-Management Limits On >10 kW Diode Lasers
Diode-laser bars above 10 kW generate heat fluxes exceeding 500 W cm^-2, necessitating micro-channel coolers with <50 µm channels to keep junction temperatures below 60 °C. IPG’s 15 kW fiber-laser modules incorporate diamond heat spreaders and two-phase liquid cooling, adding USD 8,000 to the bill of materials. Coherent found that mean-time-to-failure drops from 50,000 hours at 8 kW to 15,000 hours at 14 kW due to facet damage. Thermal-expansion mismatch between GaAs emitters and copper submounts cuts wall-plug efficiency by 5 percentage points over 10,000 hours. Alternative cooling such as spray or thermoelectric modules raises complexity and lowers system reliability, slowing adoption in cost-sensitive industries.
*Our forecasts treat driver/restraint impacts as directional, not additive. The impact forecasts reflect baseline growth, mix effects, and variable interactions.
Segment Analysis
By Product: Fiber Lasers Anchor Industrial Demand
Lasers generated 38.32% of 2025 product revenue, underscoring their status as the largest slice of the photonics market. Fiber-laser systems from IPG and Trumpf dominate metal cutting, welding, and additive manufacturing. Coherent shipped 2 million edge-emitting diode bars in 2024 for sensing and pumping, highlighting deep penetration into LiDAR and medical pumping tasks. Modulators and switches are slated for a 4.91% CAGR through 2031 as co-packaged optics displace pluggable modules in 51.2-terabit switches. Although general-illumination LEDs face margin pressure, micro-LED displays for augmented reality and automotive head-up systems are drawing USD-scale investments from AMS OSRAM and Plessey.
The long tail of sensors, detectors, fibers, and optical components remains essential for system performance. Hamamatsu recorded 25% shipment growth in detectors during 2024, driven by biosensing and autonomous-vehicle demand. Corning’s bend-insensitive fiber met 5G fronthaul bend-radius requirements, shipping more than 100 million fiber-kilometers in 2024. Micro-optics such as isolators and circulators continue to enable telecom-grade reliability. While each niche is small, collectively they support the broader rise of the photonics market.


By Material: Compound Semiconductors Command Premium Pricing
Silicon retained 34.52% revenue share in 2025 due to dominant use in silicon-photonics transceivers and CMOS image sensors. Yet compound semiconductors fetch higher gross margins because performance hinges on direct bandgap and wide-bandgap attributes. Indium-phosphide underpins coherent 400G and 800G transceivers with laser linewidths below 100 kHz, an unattainable parameter for silicon alone. Gallium-nitride is replacing silicon carbide above 1,200 V in electric-vehicle inverters, with Infineon and Wolfspeed shipping 200 mm wafers into traction platforms. Polymers and plastics, while only a niche, are registering a 4.67% CAGR as flexible waveguides enter wearable biosensors and foldable displays.
Diamond and sapphire substrates address extreme thermal or mechanical demands in defense and laser markets. Glass and silica remain workhorses for optical fibers, lithography mirrors, and precision lenses, with Schott and Ohara supplying ultra-low-expansion grades for deep-ultraviolet scanners. The evolving material mix signals a steady shift toward compound and specialty platforms, a core theme inside the wider photonics market.
By Wavelength: Infrared Dominates Telecom and Sensing
Infrared held 46.18% of 2025 revenue, reflecting entrenched positions at 1,310 nm and 1,550 nm for fiber-optic links and at 905 nm and 1,550 nm for automotive LiDAR. Thermal imaging from 8-14 µm supports industrial safety and defense systems. Visible wavelengths serve display backlights and solid-state lighting, while emerging RGB laser projectors from Sony and Epson are opening premium entertainment niches. Ultraviolet, the smallest category today, is on course for a 5.02% CAGR as 193 nm lithography and far-UVC disinfection systems proliferate.
Photonics market size metrics track closely with these wavelength trends. Ultraviolet’s contribution to the photonics market size is modest today but grows disproportionately fast, whereas infrared retains the lion’s share due to telecom volumes. Stability in wavelength allocation is expected because eye-safety and atmospheric-transmission constraints lock application developers into established windows.
By End-User Industry: Automotive Segment Accelerates
Data and telecom represented 27.71% of 2025 revenue and remain the anchor for the photonics market. However, automotive applications are projected for the fastest 4.78% CAGR, lifted by regulatory mandates for advanced driver-assistance systems in China and Europe. Chinese OEMs alone consumed 60% of global LiDAR units in 2025, evidencing scale effects that push component costs lower. Consumer electronics absorb cutting-edge sensors for under-display fingerprint, facial recognition, and health metrics. Aerospace and defense provide a stable, qualification-intensive outlet for radiation-hardened lasers and detectors.
Industrial and manufacturing users deploy high-power lasers for cutting, welding, and additive processes. Medical and bio-instrumentation segments are transitioning toward point-of-care photonic diagnostics, energized by continuous glucose monitors cleared by the U.S. FDA. Each end-user vertical focuses on specific performance parameters, yet collectively they sustain the diversified demand profile that characterizes the global photonics market.
Geography Analysis
Asia Pacific commanded 41.37% of 2025 revenue, confirming its position as the largest regional block within the photonics market. China’s LiDAR ecosystem, Japan’s precision optics, and South Korea’s display backlights create a dense supplier network. China alone shipped 60% of global LiDAR units in 2025, with Hesai and RoboSense controlling 65% of that volume. India’s Production-Linked Incentive policy is drawing assembly lines from Southeast Asia into Bengaluru and Hyderabad, a shift expected to raise India’s photonics market share modestly by 2031. Regional governments continue to balance export controls with domestic content targets, shaping how the photonics market evolves.
North America remains the design nucleus for silicon-photonics transceivers and defense photonics. Intel, Broadcom, and a cluster of fabless startups claimed roughly 55% of data-center optical-module sales in 2024. Defense contracting funnels steady demand for night-vision and missile-seeker optics that require U.S. export-license compliance. Despite these advantages, cost-sensitive manufacturing is gradually migrating toward Mexico for assembly and test operations. Europe leverages equipment suppliers ASML, Trumpf, and Carl Zeiss, positioning the region as a value-added node in the photonics supply chain.
The Middle East is the fastest-growing geography, forecast for a 5.23% CAGR through 2031. Sovereign wealth funds in the United Arab Emirates and Saudi Arabia have earmarked USD 3 billion for hyperscale data centers that each require hundreds of petabits of optical connectivity. Regulatory incentives include 50-year tax holidays and relaxed data-residency mandates, attracting cloud platforms previously concentrated in Europe. South America and Africa remain nascent but show fiber-to-the-home and 5G backhaul opportunities that will incrementally enlarge the photonics market size over the next decade.

Competitive Landscape
Photonics suppliers form a moderately fragmented ecosystem in which the top 10 vendors held roughly 35% of global revenue in 2025. Coherent’s USD 7 billion acquisition of II-VI consolidated 25% of indium-phosphide wafer capacity and 30% of gallium-arsenide epi production, delivering end-to-end control from substrate growth to packaged lasers. Fabless photonic-IC designers such as Rockley Photonics and Ayar Labs are licensing IP for wearable biosensors and chiplet interconnects, sidestepping heavy capital requirements. Patent filings at the United States Patent and Trademark Office for silicon-photonics packaging rose 40% in 2024, led by Broadcom, Intel, and TSMC, underscoring an arms race to own co-packaged optics.
Incumbents are defending share by integrating artificial-intelligence-based design automation. Ansys Lumerical and Synopsys reported 50% shorter tape-out cycles for new photonic-integrated circuits in 2024. White-space opportunities persist in mid-infrared gas sensing and terahertz imaging, fields where performance premiums allow startups to coexist profitably. Aeva Technologies, for example, raised USD 200 million in 2024 to commercialize frequency-modulated continuous-wave LiDAR that simultaneously measures range and velocity, simplifying sensor fusion for autonomous vehicles.
Supply-chain risk management now shapes corporate strategy. U.S. export controls on deep-ultraviolet tools forced Chinese fabs to develop domestic alternatives, while European toolmakers navigate dual-use licensing regimes. Coherent, Lumentum, and IPG diversified substrate sourcing by jointly investing in new crystal-growth capacity in North America and Europe. Collectively, these moves illustrate how geopolitics, capital intensity, and intellectual-property positioning drive competitive dynamics within the photonics market.
Photonics Industry Leaders
-
Hamamatsu Photonics KK
-
Intel Corporation
-
Polatis Incorporated (HUBER+SUHNER)
-
Alcatel-lucent SA (Nokia Corporation)
-
Molex Inc. (koch Industries)
- *Disclaimer: Major Players sorted in no particular order

Recent Industry Developments
- May 2025: Soitec reported surging demand for Photonics-SOI wafers and joined the SEMI Silicon Photonics Industry Alliance.
- May 2025: Hesai Technology deepened its BYD partnership, covering LiDAR for 10+ vehicle models entering production in 2025.
- April 2025: GlobalFoundries unveiled a USD 700 million silicon photonics facility to expand capacity.
- March 2025: Heriot-Watt researchers demonstrated temporal control of photons using transparent conducting oxides, published in Nature Photonics.
- February 2025: Celestial AI raised USD 175 million in Series C to accelerate Photonic Fabric optical interconnects
- January 2025: AIM Photonics showcased tunable add-drop filters and compact ring modulators built on 300 mm CMOS-compatible processes.


Research Methodology Framework and Report Scope
Market Definitions and Key Coverage
According to Mordor Intelligence, the photonics market spans every device, module, and complete system in which photons are the principal medium for generating, guiding, modulating, or detecting light across consumer electronics, manufacturing, telecommunications, medical, and scientific arenas. Our analysis tracks revenue from newly manufactured photonics-enabled goods sold to end users.
Scope exclusion: we do not count legacy incandescent lamps or passive electrical fittings that simply host a light source without influencing photon behavior.
Segmentation Overview
-
By Product
-
Lasers
- Diode Lasers
- Fiber Lasers
- Solid-State and Others
- LEDs
- Sensors and Detectors
- Optical Fibers and Waveguides
- Modulators and Switches
- Other Products
-
Lasers
-
By Material
- Silicon
- Glass and Silica
- Compound Semiconductors (InP, GaAs, GaN)
- Polymers and Plastics
- Other Materials
-
By Wavelength
- Ultraviolet (UV)
- Visible
- Infrared
-
By End-User Industry
- Consumer Electronics
- Aerospace and Defense
- Display and Imaging
- Solar Photovoltaics
- LED Lighting
- Medical and Bio-Instrumentation
- Industrial and Manufacturing
- Automotive (incl. LiDAR)
- Data and Telecom
- Other End-User Industries
-
By Geography
-
North America
- United States
- Canada
- Mexico
-
Europe
- Germany
- United Kingdom
- France
- Italy
- Spain
- Rest of Europe
-
Asia Pacific
- China
- Japan
- South Korea
- India
- South-East Asia
- Rest of Asia Pacific
-
South America
- Brazil
- Rest of South America
-
Middle East
- United Arab Emirates
- Saudi Arabia
- Rest of Middle East
-
Africa
- South Africa
- Rest of Africa
-
North America
Detailed Research Methodology and Data Validation
Primary Research
Mordor analysts interview photonics engineers, contract manufacturers, equipment buyers, and regional distributors across North America, Europe, and Asia-Pacific. These discussions validate adoption thresholds, average selling prices, and supply constraints that public sources cannot reveal, giving us the confidence to triangulate every assumption.
Desk Research
We begin with publicly available demand-side datasets, drawing on OECD telecom bandwidth statistics, International Energy Agency lighting efficiency updates, WTO optical-component trade codes, Photonics21 industry briefs, and peer-reviewed articles indexed by the Optical Society of America. Company filings, investor decks, and reliable press releases reveal shipment trajectories, while D&B Hoovers, Dow Jones Factiva, and Questel patent analytics help our team connect revenue signals with technology lifecycles, thereby refining growth inflection points. These examples are illustrative only. Countless additional articles, customs records, and conference proceedings rounded out the secondary evidence base.
Market-Sizing & Forecasting
We start with a top-down reconstruction of end-market spending that blends telecom traffic growth, semiconductor capex earmarked for optical processes, LED lighting penetration, laser unit shipments, and medical imaging procedure volumes. Selective bottom-up checks, supplier roll-ups for high-power laser makers and sampled ASP-by-volume curves, confirm and fine-tune totals before forecasts extend to 2030. A multivariate regression coupled with ARIMA projects each driver, after which scenario analysis adjusts for policy shocks such as 6G rollouts or export controls. Gaps in sub-segment estimates are bridged by interpolating missing regional trade data against nearest neighbor markets.
Data Validation & Update Cycle
Our model passes a tiered review in which analysts rerun variance checks against customs codes and quarterly earnings, senior reviewers challenge anomalies, and fresh interviews are triggered if deviations persist. We refresh every twelve months, and material events, factory disruptions, regulatory bans, or major technology launches, prompt an immediate interim update so clients receive the latest viewpoint.
Why Mordor's Photonics Industry Size & Share Analysis Baseline Stands Up to Scrutiny
Published estimates often diverge, and we find the spread stems from differing scopes, currency treatments, and refresh cadences that cloud true demand signals.
When other publishers omit full telecom photonic systems, apply aggressive price-deflation factors, or freeze Asian data for years, totals shrink. Our study consolidates system revenues, converts currencies at transaction-weighted rates, and refreshes inputs annually, delivering a balanced, current baseline.
Benchmark comparison
| Market Size | Anonymized source | Primary gap driver |
|---|---|---|
| USD 1.75 trillion (2025) | Mordor Intelligence | - |
| USD 1.03 trillion (2025) | Global Consultancy A | Excludes telecom photonic systems; narrow component scope |
| USD 0.98 trillion (2024) | Industry Journal B | Uses conservative ASPs and omits mid-tier Asian suppliers |
| USD 0.99 trillion (2024) | Regional Consultancy C | Three-year refresh cycle and limited primary validation |
The comparison shows that, once scope, pricing, and refresh rigor align, Mordor's estimate emerges as a dependable midpoint, traceable to clear variables and repeatable steps that decision-makers can trust.


Key Questions Answered in the Report
What is the current global photonics market size?
The photonics market size reached USD 1.46 trillion in 2026.
How fast is the photonics market expected to grow?
The market is forecast to register a 4.16% CAGR, reaching USD 1.79 trillion by 2031.
Which product category leads revenue in the photonics space?
Lasers held 38.32% of 2025 revenue, making them the largest product group.
Which region offers the fastest growth opportunity?
The Middle East is projected to expand at a 5.23% CAGR through 2031 due to hyperscale data-center build-outs.
Why are compound semiconductors important to photonics?
Materials such as indium-phosphide and gallium-nitride enable higher performance per watt than silicon, supporting telecom, LiDAR, and power-electronics applications.
What limits adoption of ultra-high-power diode lasers?
Thermal-management challenges above 10 kW raise system cost and reduce mean-time-to-failure, slowing uptake in cost-sensitive industrial sectors.
Page last updated on:


