Market Overview
| Study Period | 2021 - 2031 |
|---|---|
| Forecast Data Period | 2026 - 2031 |
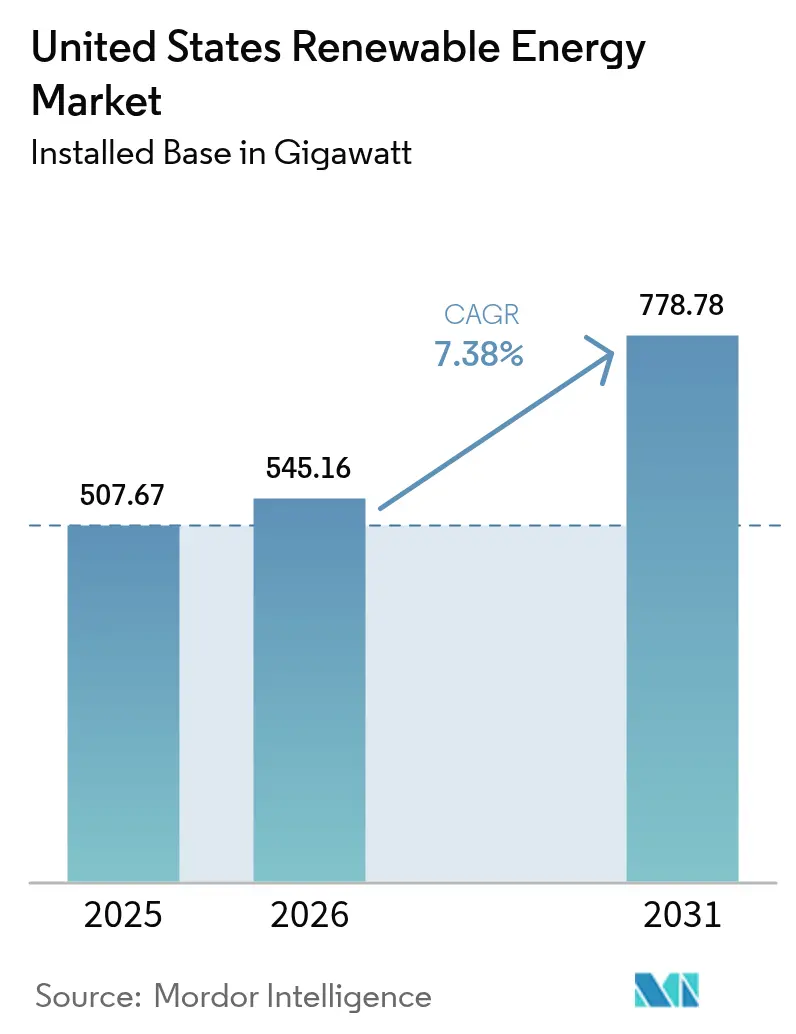
| Base Year Market Size (2025) | 507.67 gigawatt |
| Market Volume (2026) | 545.16 gigawatt |
| Market Volume (2031) | 778.78 gigawatt |
| Growth Rate (2026 - 2031) | 7.38% CAGR |
| Market Concentration | Low |
Major Players *Disclaimer: Major Players sorted in no particular order Image © Mordor Intelligence. Reuse requires attribution under CC BY 4.0. | |
United States Renewable Energy Market Analysis by Mordor Intelligence
The United States Renewable Energy Market size was valued at 507.67 gigawatt in 2025 and estimated to grow from 545.16 gigawatt in 2026 to reach 778.78 gigawatt by 2031, at a CAGR of 7.38% during the forecast period (2026-2031).
Federal incentives under the Inflation Reduction Act, steep cost declines in solar photovoltaic and wind equipment, and record-high corporate clean-electricity commitments are driving an investment cycle that no longer depends solely on subsidies. Transmission reforms, battery-plus-renewable project structures, and domestic manufacturing expansion further strengthen the economics of the US renewable energy market. Solar holds the leading 41.2% technology share, while wind remains a foundational resource, and storage solutions accelerate grid flexibility. Utilities still dominate installed capacity, yet distributed resources in homes and businesses grow quickly, reshaping revenue models and spurring service innovation across the US renewable energy market.
Key Report Takeaways
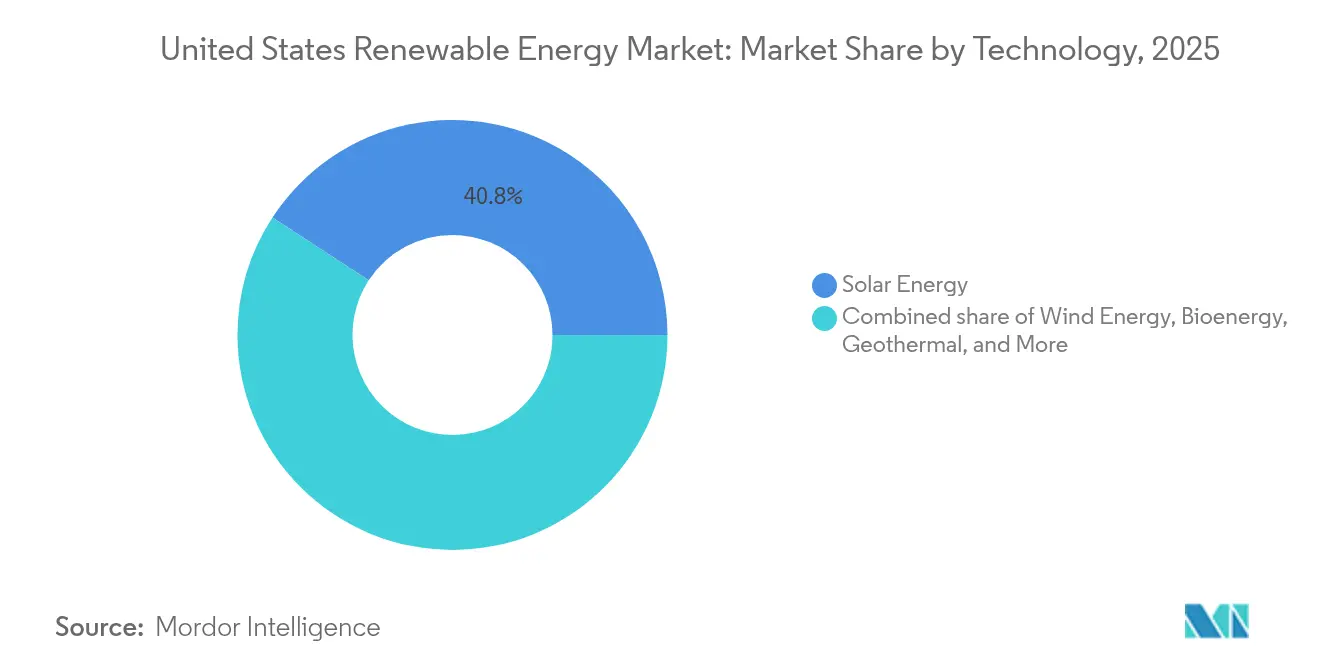
- By technology, solar commanded 40.80% of the US renewable energy market share in 2025 and is projected to grow at a 12.05% CAGR through 2031.
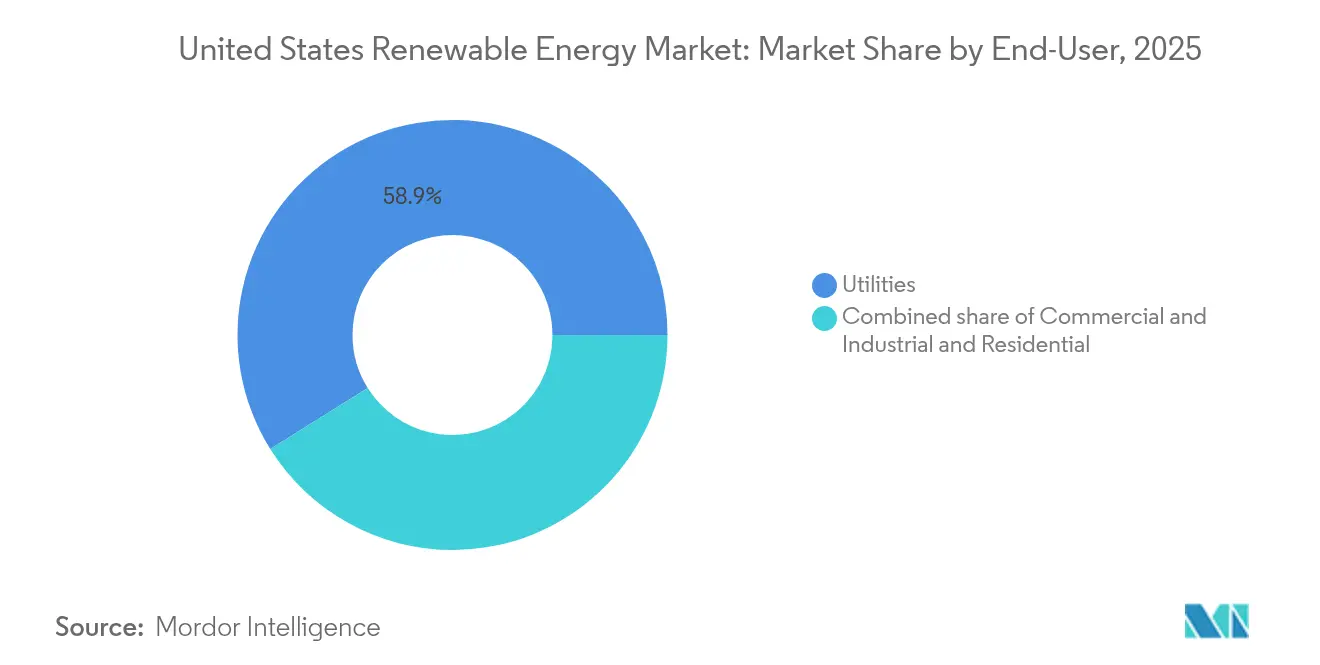
- By end-user, utilities held a 58.90% revenue share of the US renewable energy market size in 2025, while the residential segment is expected to advance at a 13.95% CAGR to 2031.
Note: Market size and forecast figures in this report are generated using Mordor Intelligence’s proprietary estimation framework, updated with the latest available data and insights as of 2026.
United States Renewable Energy Market Trends and Insights
Drivers Impact Analysis*
| Driver | (~) % Impact on CAGR Forecast | Geographic Relevance | Impact Timeline |
|---|---|---|---|
| Extension of Federal Investment & Production Tax Credits | +1.20% | National, with concentrated benefits in high-solar states | Medium term (2-4 years) |
| Rapid Decline in Solar-PV & Wind LCOE | +1.60% | National, with regional variations based on resource quality | Long term (≥ 4 years) |
| Corporate Net-Zero & RE100 Procurement Targets | +1.40% | National, concentrated in corporate headquarters regions | Medium term (2-4 years) |
| Inflation Reduction Act–linked Manufacturing Upswing | +0.90% | Regional, focused on manufacturing hub states | Long term (≥ 4 years) |
| Grid-enhancing Technologies enabling higher renewable penetration | +0.80% | National, with priority in high-renewable penetration states | Long term (≥ 4 years) |
| Source: Mordor Intelligence | |||
Extension of Federal Investment & Production Tax Credits
Long-term certainty through 2032 for the 30% investment tax credit on solar and USD 26 per MWh production tax credit for wind keeps the US renewable energy market on a steady build schedule, avoiding the historical boom-bust pattern.(1)U.S. Department of Energy, “Inflation Reduction Act 2022 Resources for Solar,” energy.govDomestic-content bonuses lift effective credits by 10 percentage points and have already encouraged a 40% increase in US solar panel output during 2024. Layered manufacturing credits, worth up to USD 0.07 per watt for solar cells, further improve project economics and anchor new factories in traditional industrial states, broadening the tax base benefits of the US renewable energy market.
Rapid Decline in Solar-PV & Wind LCOE
Utility-scale solar reached USD 0.048 per kWh and onshore wind USD 0.033 per kWh in 2024, both undercutting combined-cycle gas prices without subsidies.(2)National Renewable Energy Laboratory, “2024 Annual Technology Baseline,” nrel.gov Larger turbines, high-density cell architectures, and supply-chain optimization compress capital costs, while energy storage attachments convert variable output into dispatchable power. Corporate buyers treat these falling prices as a hedge against fossil-fuel volatility, adding momentum to the US renewable energy market’s project pipeline and creating predictable revenue streams for investors.
Corporate Net-Zero & RE100 Procurement Targets
Corporate contracts totaled 23.7 GW in 2024 as more than 400 companies adopted net-zero or RE100 pledges. Technology firms, Amazon, Meta, and Google, signed agreements for over 8 GW, pioneering 24/7 carbon-free supply models. Virtual power purchase agreements now dominate transaction structures, allowing off-take buyers to acquire new capacity anywhere on the grid and amplifying diversity in the US renewable energy market’s customer mix.
Inflation Reduction Act-linked Manufacturing Upswing
Since 2022, announced clean-energy factory investments have exceeded USD 110 billion, doubling domestic solar panel capability to 15 GW and adding five nacelle assembly plants for wind technology.(3)Solar Energy Industries Association, “Solar Industry Research Data,” seia.org Battery gigafactory announcements covering 1,000 GWh per year reinforce local content requirements and shorten supply chains. These capital-intensive projects expand the skilled labor pool and reduce import dependencies, thereby reinforcing price stability across the US renewable energy market.
Restraints Impact Analysis*
| Restraint | (~) % Impact on CAGR Forecast | Geographic Relevance | Impact Timeline |
|---|---|---|---|
| Transmission Bottlenecks & Interconnection Queues | -0.60% | National, concentrated in high-renewable resource regions | Short term (≤ 2 years) |
| Volatility in Commodity Prices for Turbines & Panels | -0.50% | National, with supply chain concentration risks | Medium term (2-4 years) |
| Community Opposition to Utility-Scale Projects | -0.30% | Regional, focused on rural development areas | Medium term (2-4 years) |
| Source: Mordor Intelligence | |||
Transmission Bottlenecks & Interconnection Queues
The interconnection backlog hit 2.6 TW by 2024, quadrupling 2020 levels and delaying projects by 4-5 years. Although FERC Order 2023 imposes cluster-study rules and commercial readiness screens, most pending applications still face network upgrades valued at more than USD 1 million per MW. The Great Plains, rich in wind, sees development stymied without conduits to load centers, resulting in trimmed near-term additions in the US renewable energy market.
Volatility in Commodity Prices for Turbines & Panels
Polysilicon price swings of up to 300% between 2020 and 2024, along with steel cost fluctuations of 15-25%, add to financing uncertainty. Supply-chain concentration poses geopolitical risks, while spikes in copper and rare-earth metals weigh on offshore wind foundations and permanent-magnet generators. Domestic content rules mitigate exposure, but the US renewable energy market anticipates another three years before a fully localized supply meets volume demand.
*Our forecasts treat driver/restraint impacts as directional, not additive. The impact forecasts reflect baseline growth, mix effects, and variable interactions.
Segment Analysis
By Technology: Solar Dominance Accelerates Grid Integration
Solar technology accounted for 40.80% of the US renewable energy market share in 2025 and is projected to grow at the fastest rate, with a 12.05% CAGR, to 2031. Pairing with batteries means that 85% of new utility solar installations include storage, turning midday generation into peaking capacity and raising revenue certainty. Agrivoltaics blends crop production and photovoltaics, easing land constraints while improving farmer economics. Wind still anchors many portfolios and benefits from taller towers and larger rotors that expand viable terrain. Offshore wind gains momentum through federal lease auctions and state solicitations totaling 15 GW. Hydropower and geothermal energy offer dependable capacity, yet resource limitations and higher upfront costs slow their relative advancement. Technology mix decisions now reflect grid-service value in addition to kilowatt-hour prices, reshaping investment logic inside the US renewable energy market.
The US renewable energy market size for solar alone is expected to reach 326.4 GW by 2031, while onshore wind is projected to expand to 253.1 GW amid regional transmission upgrades. Emerging resources, such as enhanced geothermal systems and marine energy, exhibit modest baselines, but pilot projects reveal scalability once costs are optimized. In aggregate, technology diversification cushions weather-related output swings and strengthens reliability as penetration rises beyond 50% in leading states.


By End-User: Residential Segment Disrupts Traditional Utility Model
Utilities still account for 58.90% of installed capacity in 2025, yet the residential slice is projected to grow at a 13.95% CAGR through 2031, marking the quickest ascent within the US renewable energy market. Residential rooftops are increasingly bundling batteries; 40% of 2024 installations did so, enabling homeowners to shift consumption and provide grid services. Community solar expands access for renters and properties unsuitable for traditional solar panels, adding 4 GW of subscriptions in 2024 alone. These trends shift the load away from utilities, prompting tariff redesigns and demand flexibility programs.
Commercial and industrial buyers secure long-dated contracts that lock in energy costs and hedge carbon exposure, collectively adding stability to the US renewable energy market size. Behind-the-meter systems cut peak-demand charges, while microgrid deployments enhance energy resilience. Utilities retain an advantage in large-scale procurement economics but must adapt to distributed asset orchestration and performance-based regulatory models that reward system-wide efficiency.
Geography Analysis
Regional performance highlights the diversity of resources across the US renewable energy market. Texas leads with more than 40 GW of combined wind and solar capacity, supported by competitive ERCOT market pricing and abundant land.Generation surpluses attract hydrogen pilot projects aiming to turn curtailed power into stored fuel. California generates 33% of its electricity from renewable sources and has installed 5 GW of utility-scale storage, demonstrating the high-penetration feasibility of this approach. Its experience shapes grid-planning norms nationwide as other states race toward similar targets.
The Southeast registers rapid gains as corporate procurement and solar economics converge. Florida utilities ordered 6 GW of new solar in 2024, and North Carolina’s favorable interconnection rules fostered 1.2 GW of customer-sited projects. In the Great Plains, resource-rich states like Kansas and Oklahoma wait on transmission corridors to export power eastward, while grid-enhancing technologies deliver interim relief. Federal infrastructure grants seed multi-state line proposals aimed at unlocking 30 GW of latent wind energy by 2030.
Offshore wind is concentrated in the Northeast and Mid-Atlantic, where lease areas and load centers coincide. The Bureau of Ocean Energy Management authorized the first commercial project, the 132 MW South Fork Wind, in 2024, establishing operational proof-points. State-mandated solicitations exceed 25 GW through 2035, but supply-chain maturity and community outreach will determine pacing. Elsewhere, the Pacific Coast studies floating-turbine arrays that exploit deep-water wind, adding another growth frontier for the US renewable energy market.
Competitive Landscape
The US renewable energy market shows moderate concentration as utilities, developers, and manufacturers blend roles to capture margin layers. NextEra Energy leads capacity ownership and leverages its regulated subsidiaries for stable cash flows, while deploying merchant assets to capture upside. Invenergy, Pattern Energy, and Clearway Energy specialize in project origination and long-duration contracts with corporate off-takers, demonstrating portfolio agility. Equipment makers such as First Solar expand into project development to secure panel demand, and Enphase Energy’s inverter data platforms enter the distributed asset aggregation market.
Partnership density grows, especially offshore. Ørsted collaborates with turbine maker GE Vernova and installation firm DEME to manage construction risk. Joint ventures streamline financing for multibillion-dollar arrays and resolve supply bottlenecks. Storage integrators now vie for hybrid bids, and software providers offer dispatch optimization as a competitive differentiator in the US renewable energy market.
M&A remains active. Brookfield Renewable bought 500 MW of operating solar assets from Trina Solar, and General Electric acquired LM Wind Power blades, shoring up domestic supply. Credit-rating upgrades for pure-play renewables, such as Pattern Energy’s 2024 jump to investment grade, lower borrowing costs, and widen institutional capital pools. Players capable of delivering grid services, navigating FERC reforms, and aligning with state clean energy standards gain a durable advantage.
United States Renewable Energy Industry Leaders
Vestas Wind Systems A/S
Siemens Gamesa Renewable Energy S.A.
First Solar Inc.
Sunrun Inc.
General Electric Company
- *Disclaimer: Major Players sorted in no particular order


Recent Industry Developments
- January 2025: NextEra Energy announced a USD 3.2 billion investment in 2.8 GW of solar and battery storage projects across Florida and Texas, representing the company's largest single-year capacity addition and demonstrating integrated utility-scale development capabilities.
- December 2024: Ørsted completed the 132 MW South Fork Wind project off Long Island, marking the first commercial-scale offshore wind installation in US federal waters and establishing operational precedent for subsequent East Coast developments.
- November 2024: First Solar secured USD 2.8 billion in manufacturing tax credits for its Ohio facility expansion, which will increase domestic thin-film solar panel production capacity by 3.3 GW annually and reduce import dependence.
- October 2024: Invenergy and Microsoft signed a 15-year power purchase agreement for 815 MW of renewable energy across multiple projects, representing the largest single corporate renewable procurement contract and establishing a precedent for 24/7 carbon-free energy matching.
- August 2024: Dominion Energy has received regulatory approval for the 2.6 GW Coastal Virginia Offshore Wind project, the largest offshore wind development in US waters, with a USD 9.8 billion investment commitment and a target for commercial operation in 2026.


United States Renewable Energy Market Report Scope
Renewable energy refers to energy derived from naturally replenishing sources that are virtually inexhaustible and have minimal environmental impact. Unlike finite fossil fuels, which contribute to climate change and pollution, renewable energy sources can be sustainably harnessed to meet the world's energy needs.
The US renewable energy market is segmented into source. By source, the market is segmented into wind, solar, hydropower, bioenergy, and other sources.
For each segment, the market sizing and forecasts have been done based on installed capacity (GW).
By Technology
| Solar Energy (PV and CSP) |
| Wind Energy (Onshore and Offshore) |
| Hydropower (Small, Large, PSH) |
| Bioenergy |
| Geothermal |
| Ocean Energy (Tidal and Wave) |
By End-User
| Utilities |
| Commercial and Industrial |
| Residential |
| By Technology | Solar Energy (PV and CSP) |
| Wind Energy (Onshore and Offshore) | |
| Hydropower (Small, Large, PSH) | |
| Bioenergy | |
| Geothermal | |
| Ocean Energy (Tidal and Wave) | |
| By End-User | Utilities |
| Commercial and Industrial | |
| Residential |


Key Questions Answered in the Report
How large is the US renewable energy market in 2026?
Installed capacity is 545.16 GW in 2026 and tracking toward 778.78 GW by 2031, implying continued growth in 2026.
Which technology leads new capacity additions?
Solar accounts for 40.80% share and is expanding fastest at 12.05% CAGR through 2031.
What slows project completion timelines?
Transmission bottlenecks and a 2.6 TW interconnection queue add 4-5 years to schedules.
How do federal tax credits influence project economics?
Through 2032, 30% investment tax credits and USD 26 per MWh production credits cut upfront costs and raise returns.
Why are corporations signing renewable PPAs?
Long-term price certainty and net-zero commitments drove 23.7 GW of corporate contracts in 2024.
Is domestic manufacturing keeping pace with demand?
USD 110 billion of announced factories have doubled solar panel capacity to 15 GW and added new wind component plants.
Page last updated on:


