Energy Retrofit Market Size and Share
Market Overview
| Study Period | 2021 - 2031 |
|---|---|
| Market Size (2026) | USD 216.69 Billion |
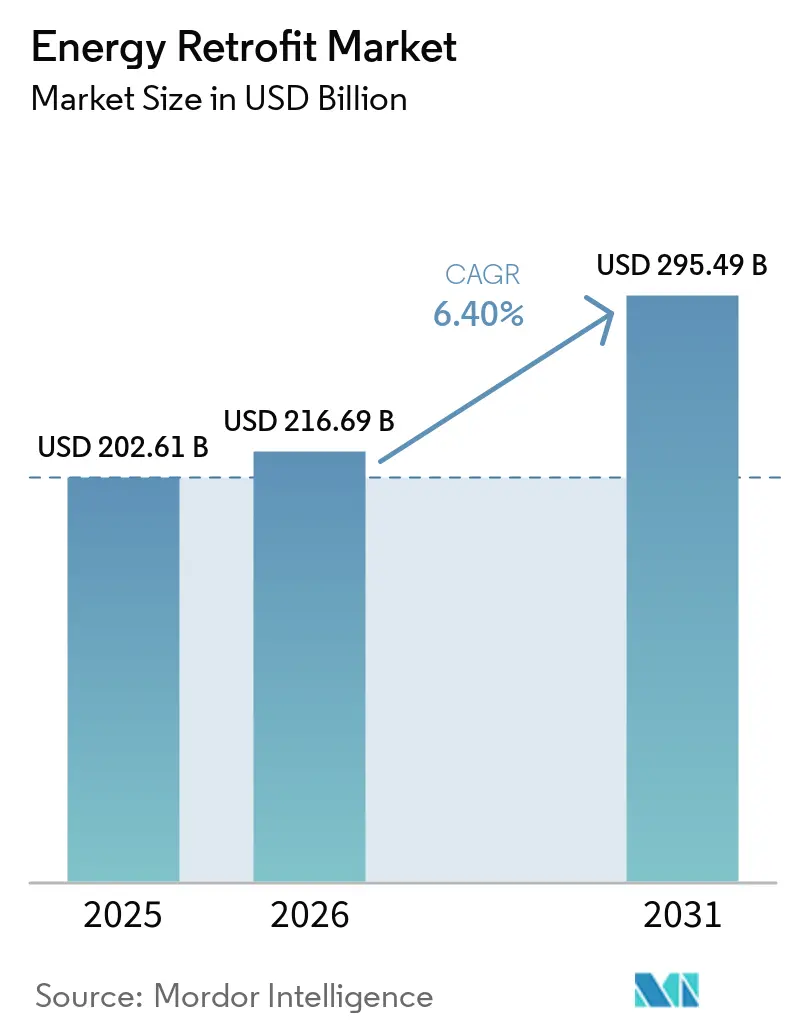
| Market Size (2031) | USD 295.49 Billion |
| Growth Rate (2026 - 2031) | 6.40% CAGR |
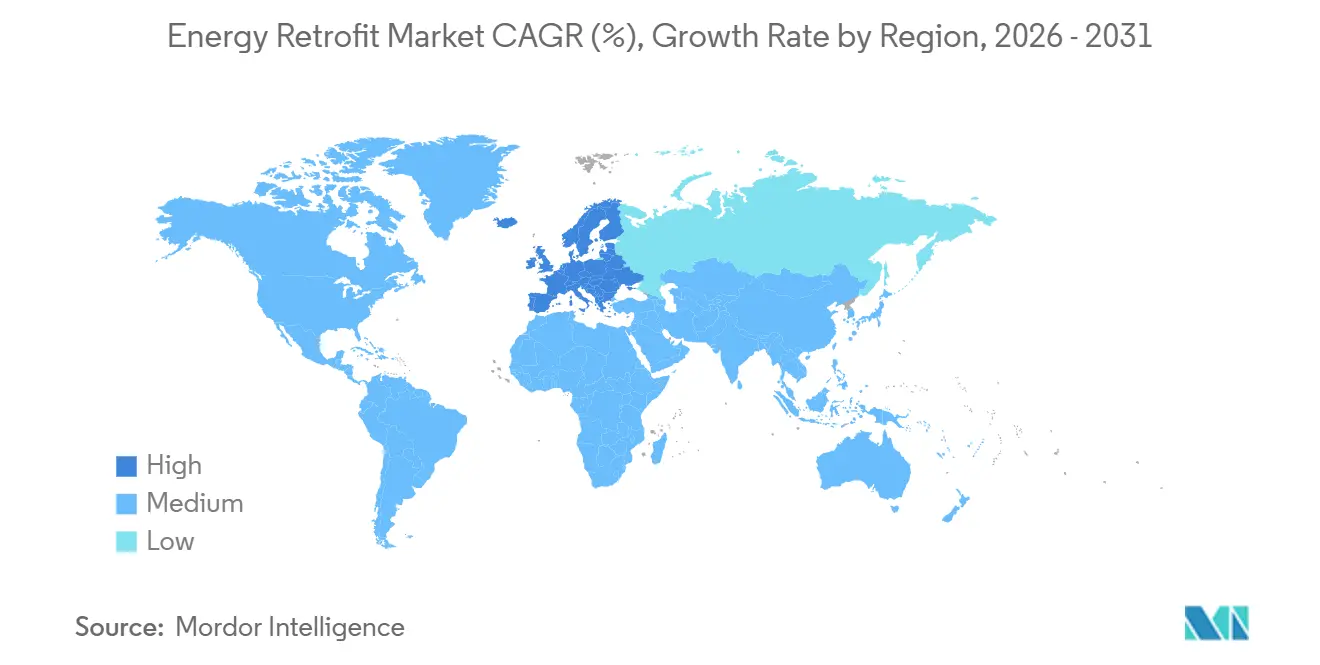
| Fastest Growing Market | Europe |
| Largest Market | North America |
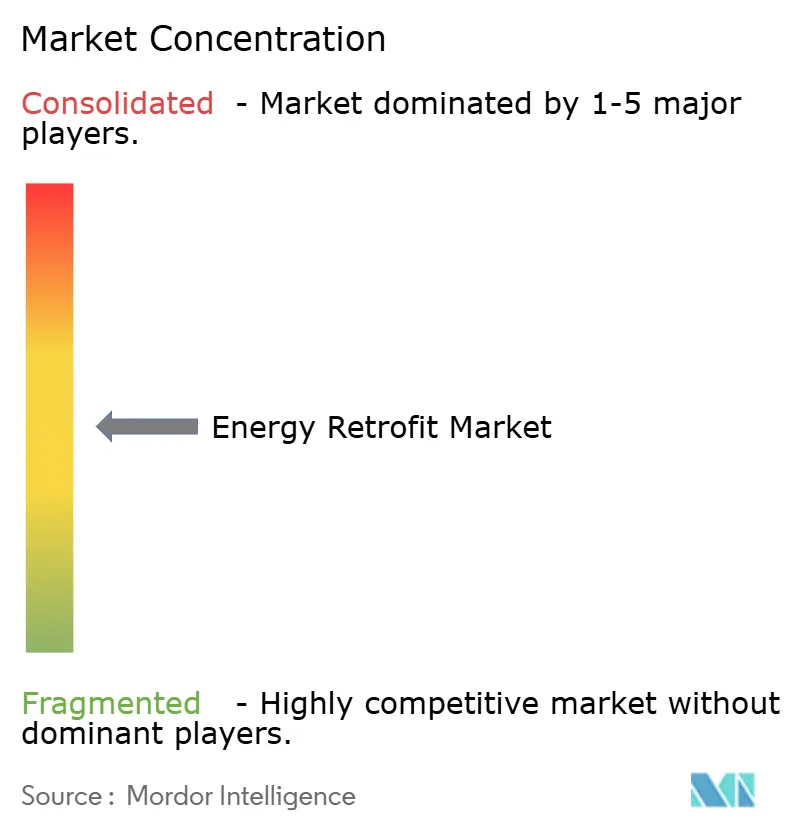
| Market Concentration | Medium |
Major Players *Disclaimer: Major Players sorted in no particular order Image © Mordor Intelligence. Reuse requires attribution under CC BY 4.0. | |
Energy Retrofit Market Analysis by Mordor Intelligence
The Energy Retrofit Market size is expected to increase from USD 202.61 billion in 2025 to USD 216.69 billion in 2026 and reach USD 295.49 billion by 2031, growing at a CAGR of 6.40% over 2026-2031. Corporate decarbonization pledges, hardening government mandates, and heightened energy-price volatility are pushing owners to accelerate capital deployment even as borrowing costs rise. Outcome-based contracts that tie service-provider revenue to verified savings are transferring performance risk away from clients, making deeper interventions financially palatable to institutional investors. Rapid innovation in AI-enabled building-twin analytics is uncovering granular savings opportunities that were previously uneconomical to detect, and attractive subsidy pools, such as the United States’ USD 7 billion Solar for All program, are narrowing payback periods for solar-integrated retrofits.[1]U.S. Department of Energy, “Solar for All Funding Announcement,” energy.gov These dynamics are giving rise to a two-speed market: a high-volume shallow-retrofit segment that captures quick wins and a fast-growing deep-retrofit segment that delivers comprehensive, long-term decarbonization.
Key Report Takeaways
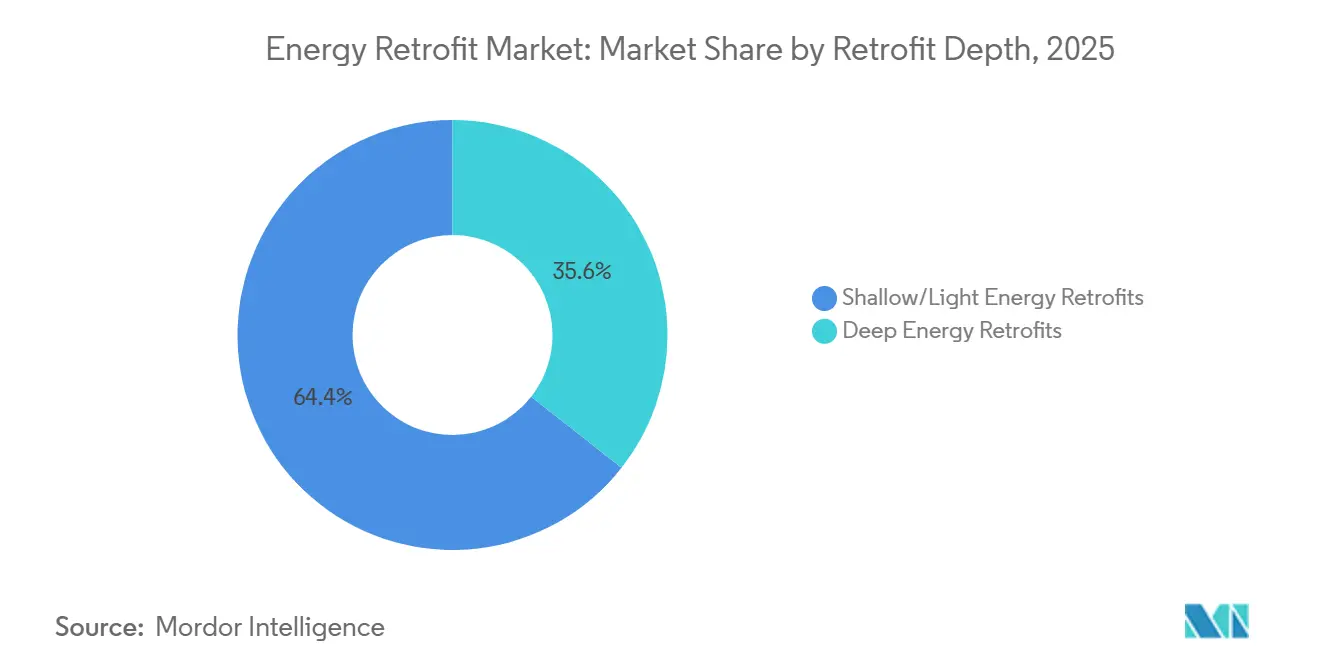
- By retrofit depth, shallow retrofits captured 64.4% of 2025 revenue, while deep retrofits are advancing at an 8.6% CAGR through 2031.
- By technology, HVAC systems held 43.1% of 2025 Energy Retrofit Market share, whereas renewable-integration solutions are projected to grow at a 10.3% CAGR.
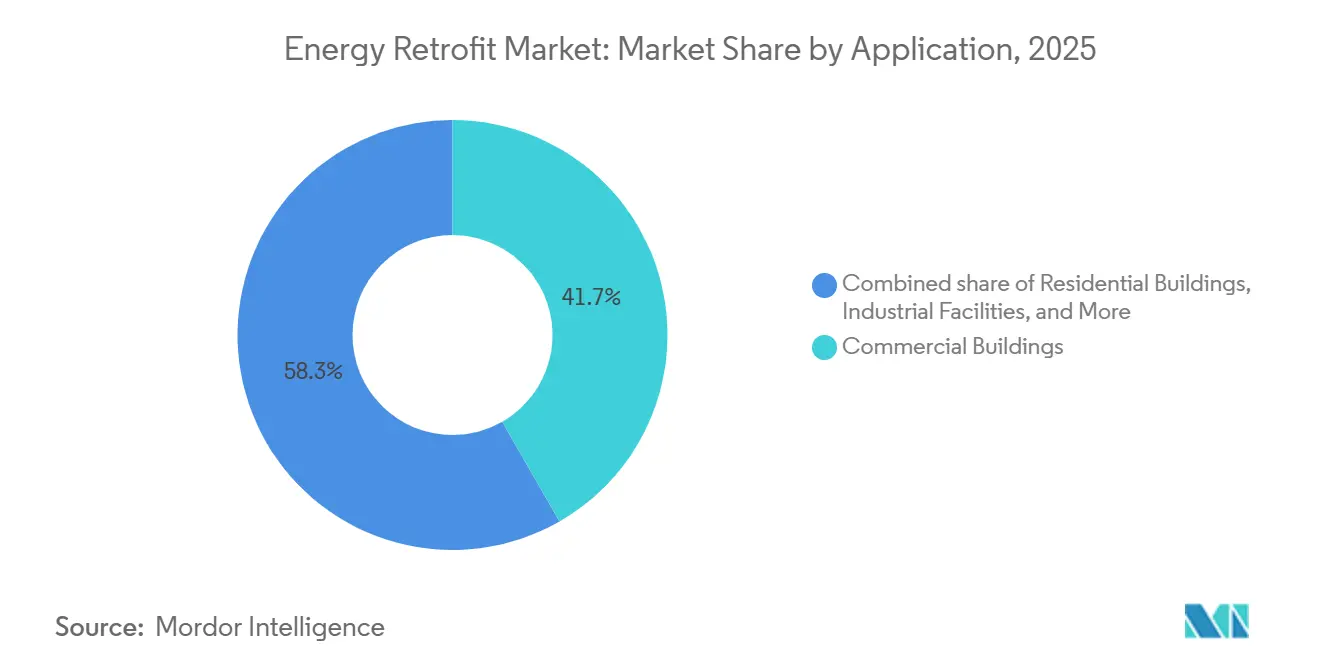
- By application, commercial buildings commanded 41.7% of 2025 spending in the Energy Retrofit Market; public and institutional facilities are forecast to expand at a 9.7% CAGR.
- By geography, North America accounted for 38.9% of global 2025 revenue, yet Europe is expected to log the fastest regional growth at a 9.0% CAGR to 2031.
Note: Market size and forecast figures in this report are generated using Mordor Intelligence’s proprietary estimation framework, updated with the latest available data and insights as of January 2026.
Global Energy Retrofit Market Trends and Insights
Drivers Impact Analysis*
| Driver | (~) % Impact on CAGR Forecast | Geographic Relevance | Impact Timeline |
|---|---|---|---|
| Government energy-efficiency mandates & incentives | +1.8% | Global, strongest in EU & North America | Medium term (2-4 years) |
| Corporate net-zero/ESG commitments accelerating retrofit demand | +1.5% | Global, led by North America & Europe | Medium term (2-4 years) |
| Ageing building stock in OECD economies requiring upgrades | +1.2% | North America, Europe, Japan | Long term (≥ 4 years) |
| Volatile electricity & gas prices prompting payback-driven retrofits | +0.9% | Europe, APAC core, spill-over to MEA | Short term (≤ 2 years) |
| AI-enabled building-twin analytics uncovering hidden savings | +0.7% | North America, Europe, APAC urban centers | Medium term (2-4 years) |
| Growing adoption of outcome-based financing & ESG-linked loans | +0.6% | Global, early traction in North America & EU | Medium term (2-4 years) |
| Source: Mordor Intelligence | |||
Government Energy-Efficiency Mandates & Incentives
The European Union’s recast Energy Performance of Buildings Directive, transposed by member states in 2024, sets statutory renovation requirements that convert optional upgrades into legal obligations. Germany disbursed EUR 13.5 billion for efficiency upgrades under its BEG program during 2024, and France’s MaPrimeRénov’ added EUR 2.6 billion to subsidize heat-pump installations. In the United States, Section 179D of the Inflation Reduction Act now offers a USD 5 per-square-foot deduction for projects achieving 50% energy cuts, while the Bipartisan Infrastructure Law funneled USD 3.5 billion through Energy Efficiency and Conservation Block Grants. Japan’s revised Building Energy Conservation Law, effective April 2025, imposed mandatory savings standards on all new non-residential properties, prompting a wave of pre-emptive retrofits. South Korea’s Zero Energy Building mandate was extended to all public buildings above 500 square meters in June 2025, complemented by a Seoul subsidy that covers up to 50% of retrofit costs.
Corporate Net-Zero/ESG Commitments Accelerating Retrofit Demand
Large enterprises are writing retrofit spending directly into science-based emission-reduction roadmaps. IKEA aims to upgrade every owned store to net-zero energy by 2030, installing 1.7 GW of rooftop solar across 400 sites by end-2024. Levi Strauss has committed to retrofit 90% of its facilities by 2027 to slash energy intensity 40%. The Federal Reserve Bank of San Francisco’s 2024 study showed that firms with public science-based targets devote 23% more capital to efficiency projects compared with peers.[2]Federal Reserve Bank of San Francisco, “Corporate ESG and Capital Allocation,” frbsf.org Financing tools are evolving in tandem: HSBC arranged a USD 500 million sustainability-linked loan for a European REIT in 2024, reducing borrowing costs as verified portfolio energy intensity falls.
Ageing Building Stock in OECD Economies Requiring Upgrades
Roughly 75% of Europe’s existing buildings remain energy-inefficient, and 85%–95% of structures standing in 2026 will still be occupied in 2050, according to the European Commission. Comparable aging curves prevail in North America, where the median commercial building was erected before 1990, predating modern energy codes. Deferred maintenance has left envelopes leaky and mechanical equipment obsolete, creating a sizable backlog of cost-effective interventions. Japan’s Ministry of Land, Infrastructure, Transport and Tourism estimates that 41% of office floor area predates 1981 seismic and insulation standards, providing fertile ground for comprehensive upgrades. These demographics guarantee a long tail of retrofit demand, extending well past the current forecast window.
Volatile Electricity & Gas Prices Prompting Payback-Driven Retrofits
European industrial electricity averaged EUR 0.18 per kWh in 2024, 60% higher than pre-crisis levels, anchoring robust savings economics even as spot prices ease from 2022 highs. U.S. commercial electricity rates rose 4.2% year-over-year in 2024, and natural-gas prices climbed 7.8%, shortening LED-lighting paybacks to 2.1 years in California office buildings. South Korean commercial tariffs jumped 13.1% in 2024, and Dubai lifted rates 8% in January 2025, sparking facility-manager interest in solar-plus-storage systems. Energy-price volatility is therefore reinforcing the financial logic of capital-intensive retrofits.
Restraints Impact Analysis*
| Restraint | (~) % Impact on CAGR Forecast | Geographic Relevance | Impact Timeline |
|---|---|---|---|
| High upfront CAPEX despite falling tech costs | -1.1% | Global, acute in emerging APAC & South America | Short term (≤ 2 years) |
| Landlord-tenant split-incentive dilemma | -0.8% | North America, Europe, urban APAC | Medium term (2-4 years) |
| Shortage of deep-retrofit skilled labor & project managers | -0.6% | Global, most severe in North America & EU | Medium term (2-4 years) |
| Performance-risk perception & measurement uncertainty | -0.4% | Global, particularly in emerging markets | Short term (≤ 2 years) |
| Source: Mordor Intelligence | |||
High Upfront CAPEX Despite Falling Tech Costs
Comprehensive retrofits often group envelope upgrades, HVAC replacements, and controls integration into one project, pushing typical spends into six- or seven-figure territory. A 2024 British Columbia meta-analysis found median deep-retrofit costs of CAD 150-250 per square foot (USD 110-185), with simple payback exceeding 15 years even after subsidies, far longer than many investors’ hold periods.[4]University of British Columbia, “Deep Retrofit Cost Study,” ubc.ca The European Commission pegs the annual funding gap for its 2030 renovation target at EUR 95 billion. Similar gaps loom in India, where 68% of surveyed owners cited upfront cost as the primary deterrent to action. Emerging tools such as green banks and on-bill financing are promising but remain limited to select U.S. states and a handful of EU nations.
Landlord-Tenant Split-Incentive Dilemma
In multi-tenant buildings, landlords face the capital bill while tenants reap the utility savings, suppressing investment even when returns are attractive. A 2024 Institute for Market Transformation study recorded a 41% lower probability of upgrades in leased U.S. commercial properties versus owner-occupied sites.[3] Institute for Market Transformation, “Split-Incentive Impact on Energy Upgrades,” imt.org The U.K.’s Minimum Energy Efficiency Standards, which bar leases on assets rated below EPC “E,” spurred a 19% rise in landlord-funded retrofits from 2023 to 2025. Still, fewer than 8% of North American commercial leases embed green-lease clauses that share costs and benefits equitably. Policy nudges such as Singapore’s 50% tax abatement for landlords securing three-year tenant commitments may offer templates for wider adoption.
*Our forecasts treat driver/restraint impacts as directional, not additive. The impact forecasts reflect baseline growth, mix effects, and variable interactions.
Segment Analysis
By Retrofit Depth: Shallow Retrofits Dominate, Deep Interventions Gain Momentum
Shallow retrofits captured 64.4% of the 2025 Energy Retrofit Market size, reflecting owners’ preference for quick-payback measures such as LED relamping, smart thermostats, and low-cost insulation top-ups that deliver 15%-25% savings with minimal disruption. Deep retrofits, though capital-intensive, are expanding at an 8.6% CAGR as net-zero mandates push portfolios toward more than 50% cuts in energy intensity. Median savings of 38% in U.S. Better Buildings Initiative projects underscore the upside, justifying long amortization schedules under efficiency-linked financing.
Industry value chains are bifurcating. Electrical contractors dominate high-volume shallow works, while deep projects attract specialist engineering firms that can integrate envelope redesign, mechanical upgrades, and renewable installations under outcome-based contracts. Passive House certification is emerging as a credibility marker, with 1,840 certified retrofit projects worldwide in 2024, up 64% from 2022. The European Investment Bank’s EUR 200 million facility for multifamily deep retrofits in Poland and Romania demonstrates growing investor appetite for savings-backed debt structures.


By Technology: HVAC Leadership Faces Renewable-Integration Surge
HVAC replacements commanded 43.1% of 2025 spending, underpinned by the retirement of aging boilers and chillers in favor of variable-refrigerant-flow systems and heat pumps that achieve 30%-40% savings while improving indoor air quality. Renewable-integration solutions, rooftop solar PV, solar thermal, and battery storage, are forecast to post a 10.3% CAGR through 2031, propelled by the USD 7 billion U.S. Solar for All grants announced in 2024.
LED lighting systems, already exceeding 70% penetration in mature markets, now focus on smart controls that pair occupancy sensing with daylight harvesting. Envelope materials, including high-performance insulation and glazing, accounted for 14% of the 2025 Energy Retrofit Market share, riding EPBD-driven demand in Europe. Smart-building platforms such as Schneider Electric’s EcoStruxure, active at 480,000 sites by end-2024, are knitting these disparate technologies together, allowing facilities teams to orchestrate savings across HVAC, lighting, and plug loads from a common interface.
By Application: Commercial Buildings Lead, Public Sector Accelerates
Commercial properties held 41.7% of the 2025 Energy Retrofit Market revenue, leveraging efficiency gains to raise net operating income in office, retail, and hospitality assets. Public-sector buildings are the fastest-growing end use at 9.7% CAGR as governments pursue statutory targets such as the U.S. General Services Administration’s Net Zero by 2045 pledge covering 370 million ft² of federal real estate. Residential retrofits, aided by Germany’s BEG and France’s MaPrimeRénov subsidies, accounted for 28% of spending, while industrial sites made up 12% and focused on process-heat recovery and high-bay LED lighting to exploit 2-3-year paybacks.
Energy-savings performance contracts are the public sector’s preferred procurement route: the United States saw USD 2.1 billion in federal and state ESPC volume during 2024, and the U.K.’s Public Sector Decarbonisation Scheme allocated GBP 1.45 billion to school and hospital upgrades. These contracts derisk cash flows for facility owners and promote standardized measurement and verification protocols that bolster investor confidence.
Geography Analysis
North America captured 38.9% of the 2025 Energy Retrofit Market revenue, buoyed by generous U.S. federal tax incentives and state-level green-bank financing programs. The region’s regulatory push will intensify as California’s 2026 solar-plus-storage mandate for new commercial buildings spills over into retrofit scopes.
Europe, forecast to grow at 9.0% CAGR, benefits from the EPBD’s hard compliance deadlines and multi-billion-euro subsidy pools such as Germany’s BEG and the U.K.’s Public Sector Decarbonisation grants. Yet the European Commission warns of a EUR 95 billion annual financing gap, spurring creative instruments like renovation mortgage portfolios and EU-backed guarantee schemes.
Asia-Pacific trends are heterogeneous. China’s 14th Five-Year Plan targets 350 million m² of retrofits by 2025, but enforcement differs widely by province. Japan’s April 2025 building-energy code stiffening is triggering a wave of upgrades in the commercial core, while South Korea’s aggressive zero-energy mandate is catalyzing half-subsidized retrofits in public stock. Latin America and the Middle East-Africa, though flagship programs, Brazil’s PROCEL and the UAE’s Estidama, are laying regulatory foundations for future scale.

Competitive Landscape
The global Energy Retrofit Market is a moderately fragmented industry where scale and software differentiation play a significant role in revenue generation. Honeywell’s USD 4.95 billion purchase of Carrier’s Access Solutions in June 2024 integrated security with building-automation assets, positioning the firm to bundle energy and safety upgrades across 1.2 million sites. Johnson Controls exited residential HVAC in August 2025, selling the unit to Bosch for USD 8.1 billion to sharpen its focus on commercial controls and services, a pivot expected to lift operating margins 300 basis points.
ENGIE’s Equans subsidiary is using its EUR 3.1 billion war chest to acquire engineering talent and expand outcome-based contracting into the Middle East, as evidenced by the October 2024 purchase of Balfour Beatty Engineering Services and the January 2025 Skyline Consultancy deal. Smaller disruptors such as BlocPower and Dandelion Energy specialize in standardized heat-pump retrofits with on-bill financing, chipping away at underserved residential segments. Patent activity is rising: the U.S. Patent and Trademark Office granted 347 building-automation patents in 2024, up 19% year-over-year, underscoring the strategic value of software IP in an industry historically dominated by hardware.
Energy Retrofit Industry Leaders
Johnson Controls
Siemens AG
Schneider Electric
ENGIE
Ameresco
- *Disclaimer: Major Players sorted in no particular order

Recent Industry Developments
- March 2026: Singapore's National Environment Agency (NEA) has awarded Mitsubishi Heavy Industries Asia Pacific Pte. Ltd. a contract for boiler retrofit work at the Tuas South Incineration Plant (TSIP) in western Singapore's Tuas district. This retrofit is designed to stabilize the waste handling capacity of the stoker-type incinerator(Note) and prolong the operational lifespan of the facility.
- February 2025: ABB and Samsung Electronics integrated ABB’s InSite platform with SmartThings to enhance home and light-commercial energy management.
- January 2025: ABB invested in Edgecom, a Toronto-based generative AI energy-management startup. Leveraging artificial intelligence, the company's innovative energy management platform empowers industrial and commercial users to effectively manage and curtail peaks in their power demand.
- February 2024: Hawaiian Electric selected Ameresco to develop the Ūkiu Energy 40 MW renewable site to support grid decarbonization.


Global Energy Retrofit Market Report Scope
Energy retrofitting modifies existing buildings with advanced, energy-efficient technologies to cut energy use, trim utility bills, and boost sustainability. This process may involve upgrading older systems, like HVAC and lighting, or adding insulation to enhance overall building performance. The primary objectives are to lower carbon emissions, elevate energy efficiency, and enhance occupant comfort.
The energy retrofit market is segmented by retrofit depth, technology, application, and geography. By retrofit depth, the market is segmented into deep energy retrofits and shallow/light energy retrofits. By technology, the market is segmented into HVAC systems, lighting systems, building envelope, renewable integration, water heating and plumbing, and more. By application, the market is segmented into residential buildings, commercial buildings, industrial facilities, and public and institutional buildings. The market forecasts are provided in terms of value (USD).
| Deep Energy Retrofits |
| Shallow/Light Energy Retrofits |
| HVAC Systems |
| Lighting Systems |
| Building Envelope (Insulation and Glazing) |
| Renewable Integration (Solar PV, Solar Thermal) |
| Smart Building Controls and IoT |
| Water Heating and Plumbing |
| Residential Buildings |
| Commercial Buildings |
| Industrial Facilities |
| Public and Institutional Buildings |
| North America | United States |
| Canada | |
| Mexico | |
| Europe | United Kingdom |
| Germany | |
| France | |
| Spain | |
| Nordic Countries | |
| Russia | |
| Rest of Europe | |
| Asia-Pacific | China |
| India | |
| Japan | |
| South Korea | |
| ASEAN Countries | |
| Australia and New Zealand | |
| Rest of Asia-Pacific | |
| South America | Brazil |
| Argentina | |
| Colombia | |
| Rest of South America | |
| Middle East and Africa | United Arab Emirates |
| Saudi Arabia | |
| South Africa | |
| Egypt | |
| Rest of Middle East and Africa |
| By Retrofit Depth | Deep Energy Retrofits | |
| Shallow/Light Energy Retrofits | ||
| By Technology | HVAC Systems | |
| Lighting Systems | ||
| Building Envelope (Insulation and Glazing) | ||
| Renewable Integration (Solar PV, Solar Thermal) | ||
| Smart Building Controls and IoT | ||
| Water Heating and Plumbing | ||
| By Application | Residential Buildings | |
| Commercial Buildings | ||
| Industrial Facilities | ||
| Public and Institutional Buildings | ||
| By Geography | North America | United States |
| Canada | ||
| Mexico | ||
| Europe | United Kingdom | |
| Germany | ||
| France | ||
| Spain | ||
| Nordic Countries | ||
| Russia | ||
| Rest of Europe | ||
| Asia-Pacific | China | |
| India | ||
| Japan | ||
| South Korea | ||
| ASEAN Countries | ||
| Australia and New Zealand | ||
| Rest of Asia-Pacific | ||
| South America | Brazil | |
| Argentina | ||
| Colombia | ||
| Rest of South America | ||
| Middle East and Africa | United Arab Emirates | |
| Saudi Arabia | ||
| South Africa | ||
| Egypt | ||
| Rest of Middle East and Africa | ||


Key Questions Answered in the Report
How large is the Energy Retrofit Market in 2026?
The Energy Retrofit Market size stands at USD 216.69 billion in 2026, tracking a 6.4% CAGR toward 2031.
Which segment holds the largest 2025 Energy Retrofit Market share?
Shallow retrofits led with 64.4% of global revenue in 2025.
What is the fastest-growing technology category through 2031?
Renewable-integration solutions are projected to grow at a 10.3% CAGR, outpacing HVAC, lighting, and envelope upgrades.
Why is Europe the fastest-growing regional market?
Strict EPBD mandates and multi-billion-euro subsidy pools are driving a 9.0% CAGR in European retrofit spending.
How are outcome-based contracts changing project financing?
They shift performance risk to service providers, enabling building owners to fund deep retrofits with savings-backed payment structures over 10-15 years.
Page last updated on:


