
Water And Wastewater Treatment Technologies Market Analysis by Mordor Intelligence
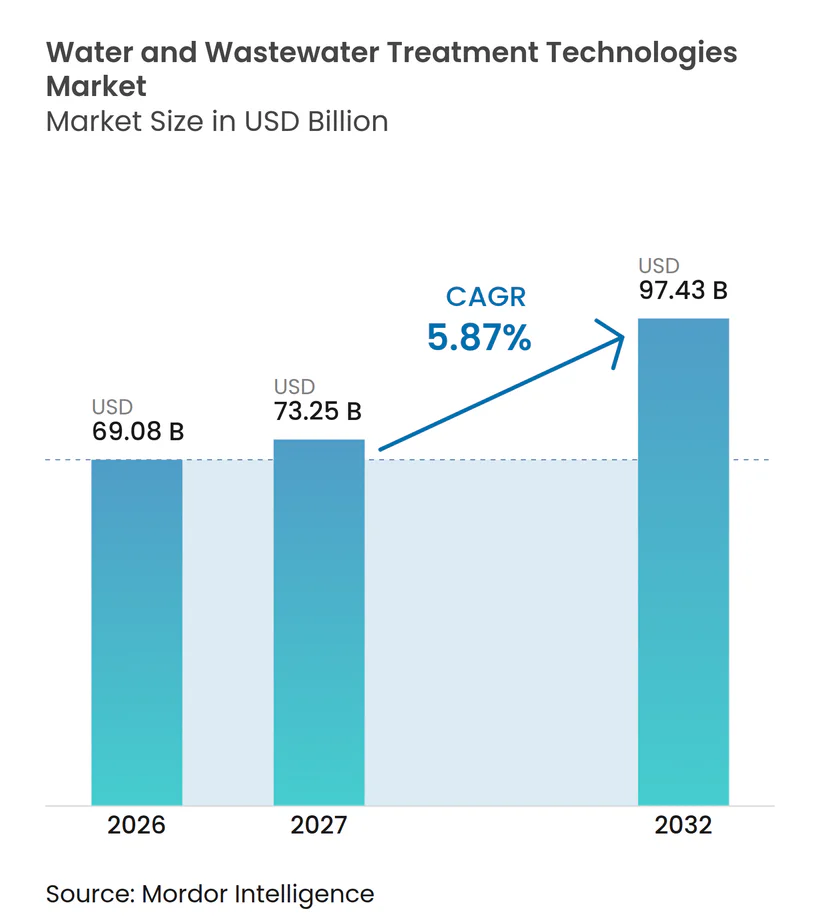
The water and wastewater treatment technologies market size was valued at USD 69.08 billion in 2026 and estimated to grow from USD 73.25 billion in 2027 to reach USD 97.43 billion by 2032, at a CAGR of 5.87% during the forecast period (2027-2032).
Industrial reuse policy in China, modular drinking-water demand and shale-related recycling investment connect treatment spending with specific local water requirements. These forces support expansion, but membrane bioreactor operating costs and operator-skill shortages limit how readily new capacity becomes reliable water service. Suppliers combining process equipment with project delivery and operation can serve plant owners across more of an installation’s life. For utilities short of qualified operators, buying delivered and operated treatment can address the staffing constraint as well as the capacity requirement.
Key Report Takeaways
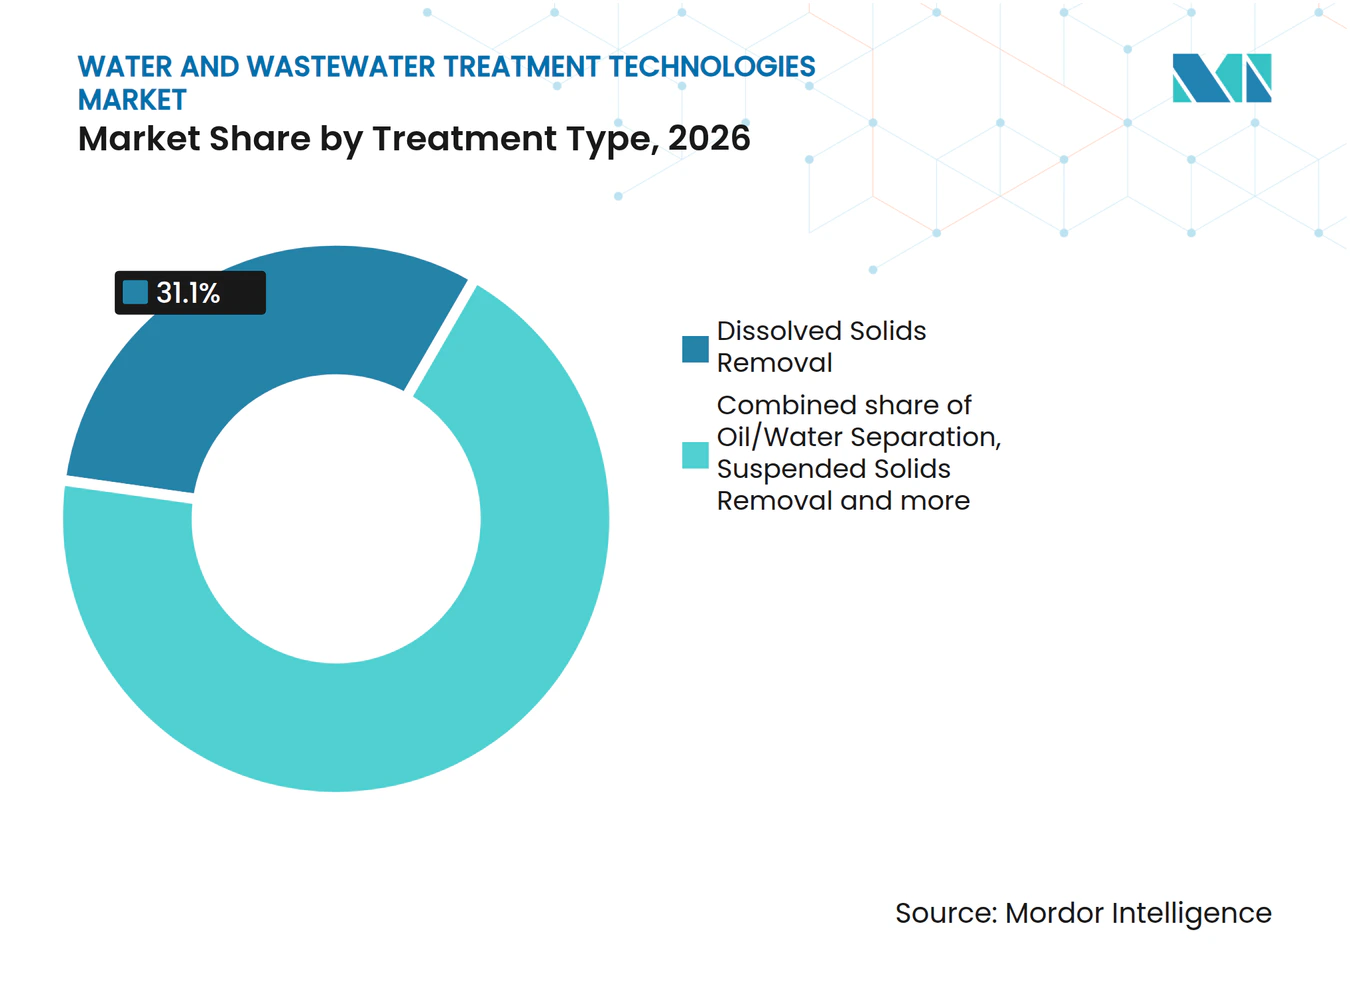
- By treatment type, dissolved solids removal held a 31.1% water and wastewater treatment technologies market share in 2026, while biological treatment/nutrient and metals recovery is forecast to grow fastest at a CAGR of 6.9% during 2027-2032.
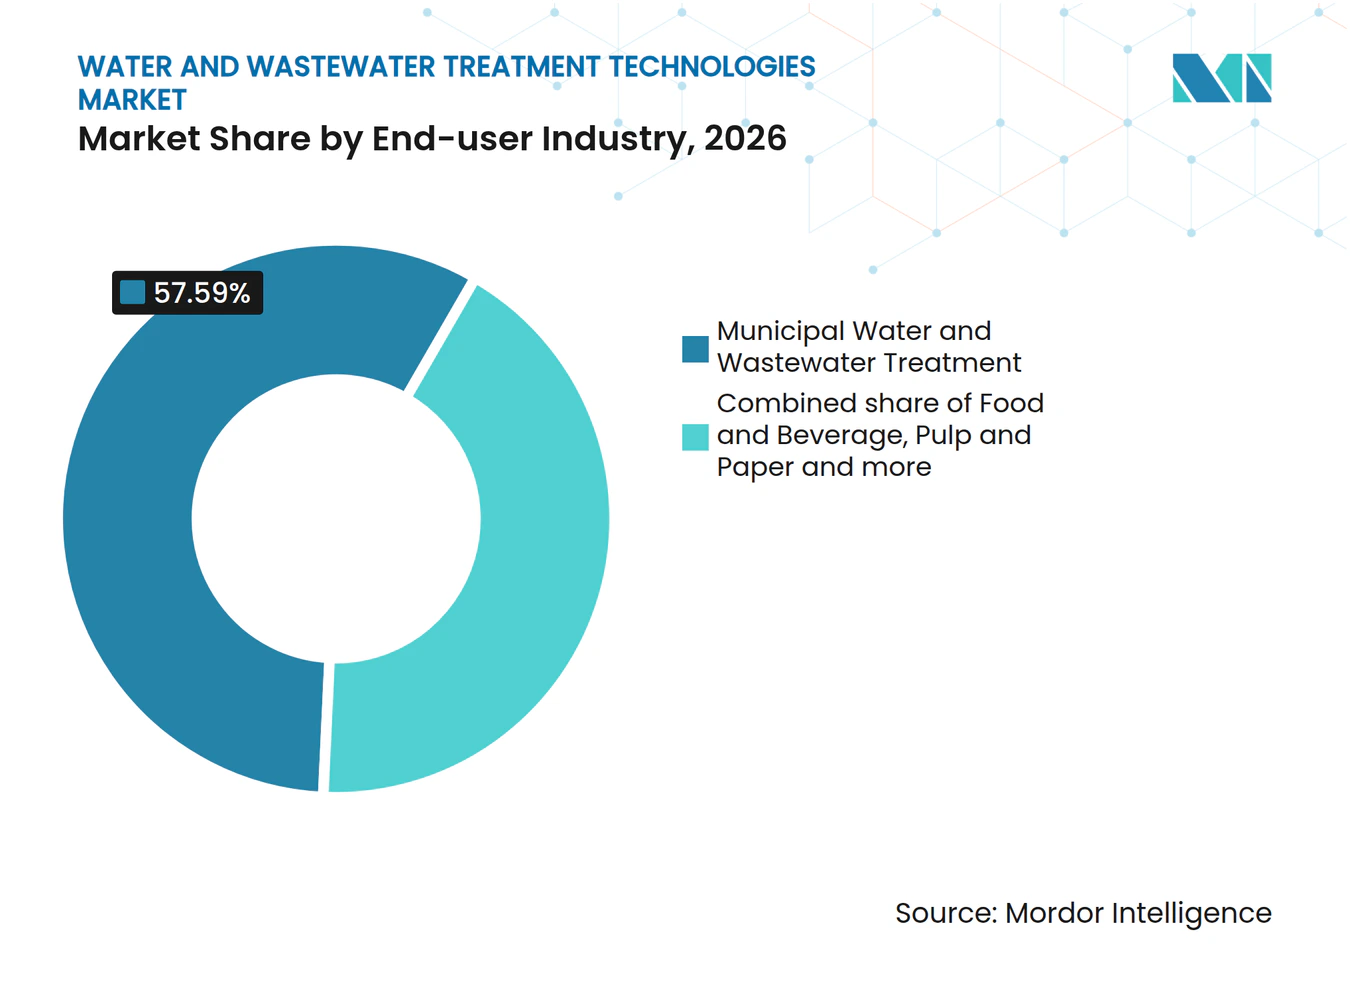
- Across end-user industries, municipal water and wastewater treatment held a 57.59% share of the water and wastewater treatment technologies market size in 2026, and food and beverage is forecast to grow fastest at a CAGR of 7.4% during 2027-2032.
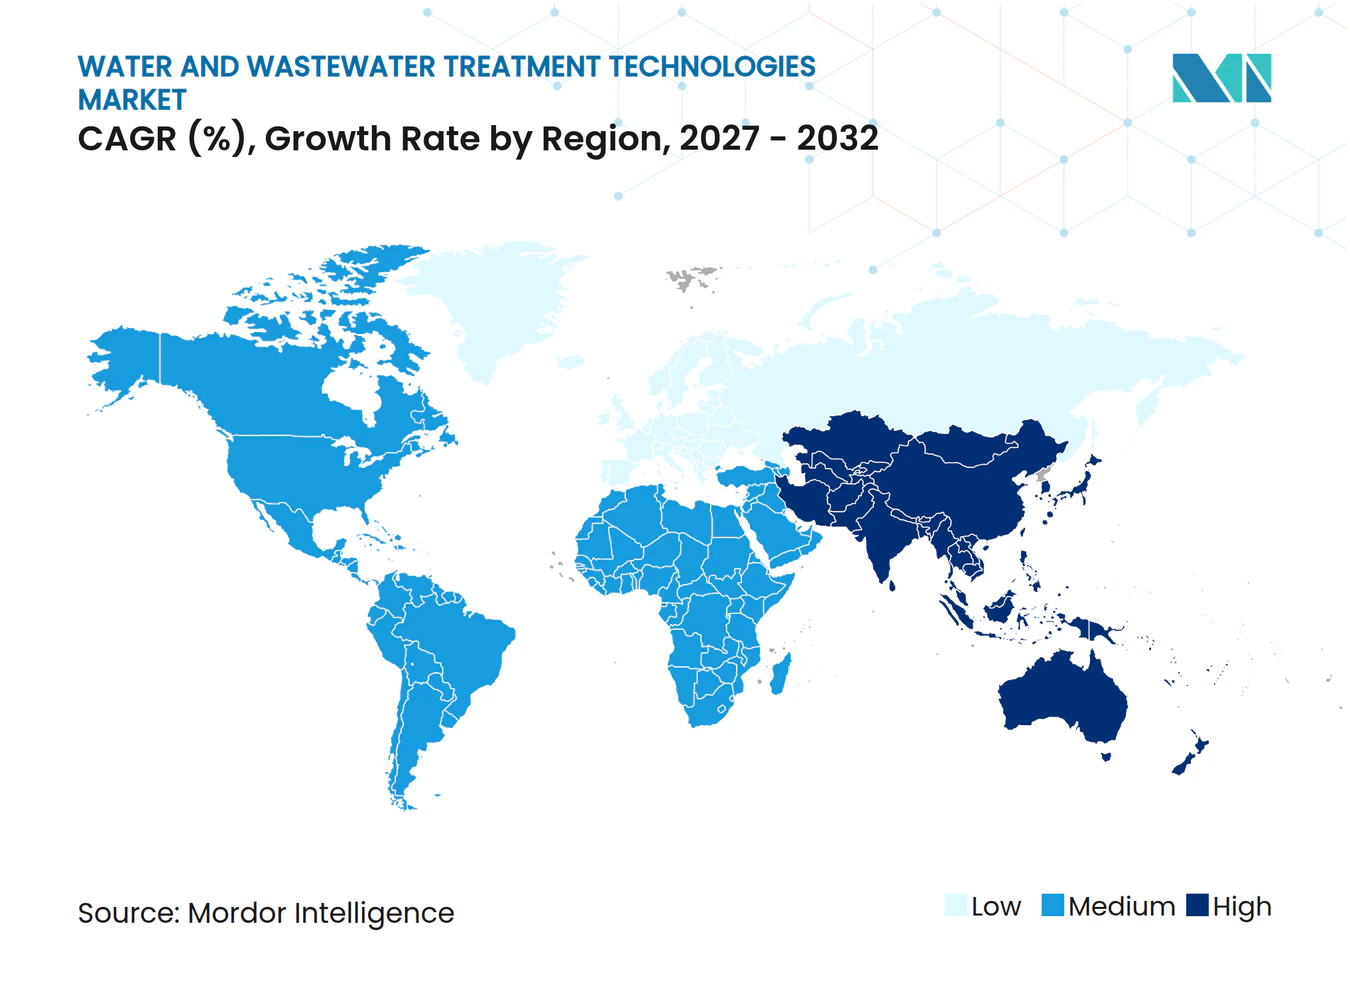
- Geographically, Asia-Pacific led with a 35.34% share of the global market in 2026 and is also forecast to be the fastest-growing region at a CAGR of 8.25% during 2027-2032.
Note: Market numbers in this report are based on Mordor Intelligence's proprietary estimation framework, which combines nine months of actuals with Q4 projections for base year 2026.
Market Trends and Insights
Drivers Impact Analysis of Water And Wastewater Treatment Technologies Market*
| Driver | (~) % Impact on CAGR Forecast | Geographic Relevance | Impact Timeline |
|---|---|---|---|
| Stricter zero-liquid-discharge (ZLD) mandates | +1.6% | India’s Ganga basin | Medium term (2-4 years) |
| Growth in decentralized modular treatment plants | +1.9% | El Nido in the Philippines | Short term (≤ 2 years) |
| Rising industrial reuse quotas in water-stressed regions | +2.3% | China’s Zhengzhou central urban area | Medium term (2-4 years) |
| Surge in capex for shale-based produced-water reuse | +1.4% | Contiguous United States | Short term (≤ 2 years) |
| AI-enabled smart metering and predictive maintenance | +0.7% | Dubai in the United Arab Emirates | Medium term (2-4 years) |
| Source: Mordor Intelligence | |||
Stricter zero-liquid-discharge (ZLD) mandates
The 2015 zero-liquid-discharge direction provides a standing compliance base for affected distilleries. India’s Central Pollution Control Board issued its December 7, 2015, direction to State Pollution Control Boards to ensure zero-liquid discharge at Ganga basin molasses-based distilleries. It included yeast manufacturing units and specified implementation through either of 2 treatment routes. The route choice leaves room for competing configurations while preserving the same compliance objective. Distillery compliance depends on the complete treatment route, making the fit between each component and the chosen treatment configuration commercially decisive.
Growth in decentralized modular treatment plants
For island municipalities, modular treatment offers a way to add local drinking-water capacity. The Municipal Government of El Nido inaugurated Palawan’s first modular water treatment plant on November 28, 2025. The Singapore Water Association reported in December 2025 that the 3-million-liter-per-day facility supplied potable water to more than 50,000 residents and tourists. Its report described pressure from climate variability, water scarcity and rising demand in the island municipality. Delivering potable capacity in that setting makes decentralized units relevant to a supply shortage, giving the municipal buyer a concrete reason to invest in treatment.
Rising industrial reuse quotas in water-stressed regions
Industrial reuse targets create treatment demand where users can obtain recycled water for suitable production uses. Zhengzhou’s July 7, 2025, plan set year-end industrial recycled-water-use targets of at least 15% in 2025, 20% in 2026 and 30% in 2027. These targets covered eligible uses within distribution-network coverage in the central urban area, excluding Zhengzhou Airport Economy Zone. That conditional scope makes connection availability central to the commercial opportunity for treatment suppliers. A higher target can strengthen demand for usable recycled water without creating the same opportunity at every industrial site. Network-connected industrial sites offer suppliers a defined route to reuse sales, with eligible production uses setting the treatment requirement.
Surge in capex for shale-based produced-water reuse
Rising reuse volumes can translate into investment beyond the treatment unit, including the infrastructure that moves and stores produced water. Select Water Solutions recycled 332 million barrels of produced water across its fixed facilities and mobile solutions in 2025, up 18% from 2024. In August 2026, Select Water Solutions agreed to add 60,000 barrels per day of produced-water recycling capacity in Eddy County, New Mexico, through a contract-backed Northern Delaware Basin expansion.[1] The broader project included pipelines and storage, with an expected cost of approximately USD 100 million to USD 120 million and operation by the end of 2027. The commitment places investment ahead of additional throughput, while the combined scope gives infrastructure providers work beyond treatment units.
Restraints Impact Analysis of Water And Wastewater Treatment Technologies Market*
| Restraint | (~) % Impact on CAGR Forecast | Geographic Relevance | Impact Timeline |
|---|---|---|---|
| High total cost of ownership for advanced membranes | -1% | Asia-Pacific, North America and Europe | Medium term (2-4 years) |
| Limited Operation and Maintenance skill base in emerging economies | -0.7% | Municipal areas in South Africa | Long term (≥ 4 years) |
| PFAS regulation uncertainty delaying tech adoption | -0.3% | The United States | Short term (≤ 2 years) |
| Source: Mordor Intelligence | |||
High total cost of ownership for advanced membranes
Membrane bioreactor economics depend on the process conditions needed to maintain treatment, as well as the equipment purchase. A 2026 review reported higher operating costs and energy use for membrane bioreactors than conventional activated sludge, primarily because of aeration requirements and membrane fouling.[2] It reported operating-cost ranges of USD 0.09 to USD 0.45 per cubic meter for membrane bioreactors, against USD 0.02 to USD 0.4 for conventional activated sludge. Energy consumption ranged from 0.4 to 1.15 kilowatt-hours per cubic meter for membrane bioreactors, against 0.3 to 0.64 for conventional activated sludge. The commercial hurdle is to justify that continuing burden against the site’s treatment requirement, leaving suppliers with a cost-based constraint that an attractive initial equipment price alone cannot resolve.
Limited Operation and Maintenance skill base in emerging economies
Plant modernization depends on having enough qualified personnel to operate the added treatment capability. At its June 9, 2026, briefing, South Africa’s Portfolio Committee on Water and Sanitation reported that 1,151 of 2,431 required wastewater process controllers were employed nationally. It also reported a shortage of 84 supervisors and said skilled-personnel shortages directly affected system functionality and operating efficiency. That combination creates an operating constraint at both process-control and supervisory levels, making equipment additions an incomplete response to deficient treatment capability. Utilities must spend time and money building operating coverage before added treatment complexity can be run reliably.
*Our forecasts treat driver/restraint impacts as directional, not additive. The impact forecasts reflect baseline growth, mix effects, and variable interactions.
Water And Wastewater Treatment Technologies Market Segment Analysis
By Treatment Type:
Desalination Scale and Recovery IntegrationDissolved solids removal accounted for a 31.1% share of the water and wastewater treatment technologies market size in 2026. The largest segment includes desalination, where Veolia builds and operates plants. In July 2026, Veolia reported that it accounted for 18% of global installed desalination capacity. It also reported that it produced 13 million cubic meters of desalinated water per day worldwide and accounted for 19% of desalination capacity in the Middle East. This combination of plant construction and daily water production gives desalination suppliers a service role extending beyond the initial equipment sale.
Biological treatment/nutrient and metals recovery is forecast to be the fastest-growing segment, with a CAGR of 6.9% during 2027-2032. Charlotte City Council approved a USD 30.34 million guaranteed maximum price for MEB General Contractors to construct McAlpine Creek’s nutrient-harvesting facility on April 28, 2025. By August 20, 2026, the project team had set its approximately 50,000-pound reactor on support columns, with further facility construction proceeding. The project was intended to recover nutrients and produce a marketable fertilizer, adding a resource-recovery function to wastewater treatment. Its commercial scope includes building a product-producing facility, which makes plant integration as relevant to the buyer as the recovery vessel itself.



By End-user Industry:
Municipal Programs and Brewery Resource RecoveryMunicipal water and wastewater treatment represented a 57.59% water and wastewater treatment technologies market share in 2026. Fort Worth’s Eagle Mountain drinking-water plant had 105 million gallons per day of capacity in July 2025, against projected demand of 140 million gallons per day by 2028. The city’s 35-million-gallon-per-day expansion, under construction in 2026, includes ozone treatment, biological filtration, membrane filtration and disinfection. Municipal buyers can bring several process technologies into one capacity project, creating work across more than one equipment category. Added capacity of 35 million gallons per day equals the difference between the plant’s existing capacity and its projected 2028 demand.
Food and beverage is forecast to be the fastest-growing segment, with a CAGR of 7.4% during 2027-2032. In February 2025, Veolia Water Technologies was selected for Omer Vander Ghinste Brewery’s expansion near Kortrijk, Belgium, designed around membrane bioreactor, anaerobic and high-recovery reverse-osmosis systems. The design specified biogas for heating water and buildings, and recycled brewing water for cooling, bottle washing and vessel cleaning. A brewery weighing this configuration has to value the recovered water and biogas alongside the effluent-treatment capacity.

Geography Analysis
Asia-Pacific Water And Wastewater Treatment Technologies Market
Asia-Pacific held a 35.34% water and wastewater treatment technologies market share in 2026 and is forecast to be the fastest-growing geography, with a CAGR of 8.25% during 2027-2032. In July 2026, the Bangalore Water Supply and Sewerage Board awarded WABAG work to design, build and operate 100-million-liter-per-day sewage and 25-million-liter-per-day tertiary plants at Byramangala, India. The awards also covered a 60-million-liter-per-day sewage plant at Bellandur. The Asian Development Bank estimated in May 2025 that around 80% of wastewater in Asia and the Pacific was untreated, leaving a large unmet treatment requirement behind municipal awards of this kind. WABAG’s design-build-operate role links the municipal capacity award to service responsibility after construction, extending the contractor’s scope beyond commissioning.
North America shows a municipal upgrade requirement in Toronto, where the city awarded GHD Limited engineering and construction services for Humber Treatment Plant’s North Plant secondary-treatment upgrades on August 20, 2025. The award specified a contract term through December 31, 2034. Europe also has a substantial wastewater investment channel, with wastewater-treatment projects accounting for 37.7% of total EU environmental protection investment in 2025.[3] Toronto illustrates a long delivery horizon for a defined secondary-treatment upgrade, while the EU investment mix makes wastewater a priority for contractors seeking environmental infrastructure work.
South America has a project-procurement route illustrated by Cesan’s June 2025 auction in Espírito Santo, Brazil. It selected the GS Inima and Forte Ambiental consortium for one lot and Acciona for the other, covering sewage collection and treatment across 43 municipalities. In Middle-East and Africa, South African officials commissioned Mpophomeni’s wastewater works on July 18, 2025, designed for Department of Water and Sanitation effluent standards and incorporating a treated-effluent pipeline and wetland rehabilitation. By October 2025, Egypt’s Ministry of International Cooperation described the Bahr El-Baqar system as implemented to treat and transfer wastewater for land reclamation in the Sinai Peninsula. Treatment here is tied either to specified collection services or to a downstream water use, so the delivery interface becomes part of the supplier’s commercial scope.
Regional Editions
Regulatory Framework and Outlook
The comparison covers selected jurisdictions from the perspective of plant operators choosing water and wastewater treatment technologies. The United States column covers industrial-stormwater permittees in EPA-administered areas, while China’s column covers municipal discharge controls. Germany’s contaminant-dependent discharge charges and South Africa’s capacity-based connection conditions place additional operating decisions around the treatment technology. Selected treatment functions have to align with the discharge authorization or service-capacity requirement that governs how the plant can serve its users.
Regulatory Table of Water And Wastewater Treatment Technologies Market
| Decision factor | China | United States | Germany | South Africa |
|---|---|---|---|---|
| Primary authority | County-level and higher environmental authorities | Environmental Protection Agency in its permitting areas | Länder water authorities | Department of Water and Sanitation; municipalities for local connection decisions |
| Key instruments or direction | Municipal wastewater standard GB 18918-2002 with 2025 amendment | Continued 2021 industrial-stormwater permit and proposed 2026 renewal | Federal and Länder water law, Waste Water Charges Act, EU wastewater directive transposition | National Water Act general authorizations and 2025 water and sanitation services standards |
| Commercial effect | Daily-average and instantaneous controls shape municipal treatment performance | Prior covered permittees retain applicable permit requirements after expiry | Contaminant-dependent charges and expanded urban wastewater duties | Conditional discharge route and capacity checks for additional bulk-user connections |
| Current policy attractiveness | Medium | High | Medium | Medium |
| Future direction of policy attractiveness | Hardening | No change | Hardening | Hardening |
| Source: Mordor Intelligence | ||||
The US ratings reflect permit continuity for prior covered operators in August 2026, following EPA’s earlier proposed renewal, preserving an established compliance basis. China’s ratings reflect defined municipal requirements with additional controls under its amendment, effective March 1, 2026. Germany’s ratings balance the contaminant-charge framework with expanded EU duties and national transposition due July 31, 2027. South Africa’s conditional route is balanced by capacity controls and a proposed October 2025 bill on registration and licensing, making operator eligibility an additional commercial consideration.
Value Chain Stages
The value chain compares how engineering, treatment equipment and plant services turn a process requirement into operating capability. DuPont Water Solutions makes FilmTec reverse-osmosis elements containing spiral-wound thin-film composite polyamide membranes, while AECOM provides studies, design and project-delivery services for water-treatment facilities. These distinct roles place supplier earnings both in the physical treatment components and in the work required to incorporate them into a functioning plant.
Value Chain Analysis Table of Water And Wastewater Treatment Technologies Market
| Primary activity | Key participants | Value capture | Bottleneck | Resilience response |
|---|---|---|---|---|
| Engineering and process design | Engineering consultants such as AECOM and Black & Veatch Corporation | Study, design and project-management fees | Unresolved treatment duty at design stage | Agree required treatment performance before detailed design |
| Treatment-equipment production | Membrane makers such as DuPont Water Solutions; treatment-system suppliers such as Xylem | Membrane, equipment and system sales | Unresolved separation requirements during component selection | Define separation duty before selecting treatment elements |
| Plant integration and construction | Design-build providers such as Veolia Water Technologies and AECOM | Design-build and integration revenue | Unassigned equipment-to-plant interface responsibility | Allocate process and installation interfaces within delivery scope |
| Operation and maintenance | Plant operators such as WABAG and Veolia Water Technologies | Operation, maintenance and plant-service agreements | Incomplete transfer of operating knowledge at handover | Connect operating documentation and service duties to commissioning |
| Source: Mordor Intelligence | ||||
WABAG manages existing water and wastewater plants through service agreements, creating an earnings route that extends beyond equipment delivery. That model makes operating responsibility commercially distinct from owning or manufacturing a treatment component. Veolia Water Technologies combines design, build, operation and upgrade services, providing an organizational route for connecting those responsibilities. Contracts that keep project delivery and plant operation with one supplier give that supplier a route to retain value, provided the interfaces between the two stages are managed.
Competitive Landscape
Market Concentration
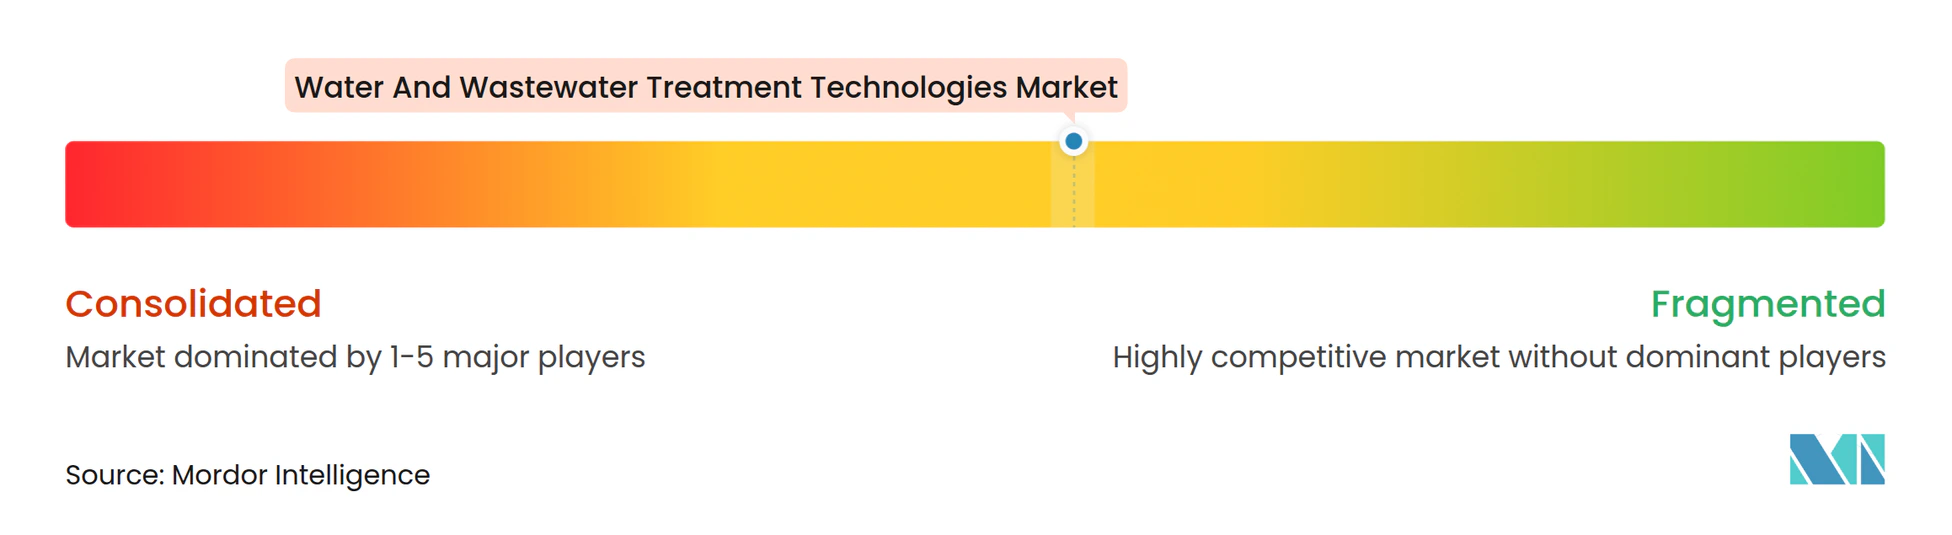
Competition combines integrated plant operators and specialized technology suppliers, with Veolia, DuPont, Ecolab, Kurita Water Industries Ltd. and Xylem forming the leading participant group. Veolia managed 3,202 wastewater treatment plants globally in 2025, establishing a substantial operating footprint alongside its technology activities. DuPont produces membrane elements, while Xylem supplies technology and equipment across transport and treatment applications, giving these participants distinct scopes within water infrastructure. This structure allows process specialists to compete for component-level requirements within projects that also need plant delivery and operation, so a broad corporate offering is only one route to the buyer.
Veolia bought CDPQ’s 30% stake in part of its Water Technologies business in 2025, combining its water technology businesses into one entity. DuPont’s process-supply strategy has a municipal application, with Watercare selecting its MemPulse membrane bioreactor and OxyMem membrane aerated bioreactor technologies for a new 6-million-liter-per-day Raglan plant in 2025. Watercare, a public water utility, collaborated with Waikato District Council to serve Raglan’s community in New Zealand. The paired selection gives a process supplier a defined role within a public utility project, making the treatment configuration itself commercially valuable alongside broader corporate integration.
Industrial reuse makes the customer’s water quality standard a practical qualification for competing technologies. Veolia commissioned a wastewater reuse project for Mexican recycler PetStar in 2025, enabling treatment and reuse of up to 550 cubic meters per day while meeting local water quality standards. Veolia also reported that the project reduced underground water use. DuPont launched its FilmTec SW30XLE-400/34 seawater reverse osmosis element in 2025, reporting up to 25% lower initial pressure drop than the previous generation. These approaches place competition at different levels, with Veolia demonstrating an integrated industrial reuse application and DuPont improving a membrane element for desalination, leaving buyers to qualify performance at the level of their treatment requirement.
Water And Wastewater Treatment Technologies Industry Leaders
-
Veolia
-
DuPont
-
Ecolab
-
Kurita Water Industries Ltd.
-
Xylem
- *Disclaimer: Major Players sorted in no particular order
Water And Wastewater Treatment Technologies Market Companies Covered in this Report
- AECOM
- Aquatech
- Black & Veatch Corporation
- Doosan Enerbility
- DuPont
- Ecolab
- HDO
- Hitachi, Ltd.
- Kurita Water Industries Ltd.
- Mott MacDonald
- Pentair
- REMONDIS SE & Co. KG
- Siemens
- SLB
- Thermax Limited
- Veolia
- WABAG
- Xylem
Read Analysis of Water And Wastewater Treatment Technologies Companies
Key Opportunities for Market Participants
The comparison centers on EU wastewater-treatment duties and a New Zealand plant procurement. The revised EU wastewater directive, in force since January 2025, requires countries to collect and treat wastewater in urban areas with more than 1,000 inhabitants. Its extended producer responsibility scheme requires pharmaceuticals and cosmetics industries to pay at least 80% of micropollutant removal costs. Implementation deadlines vary by duty, making the relevant plant’s scope and timing central to the commercial opening.
Market Opportunities Table of Water And Wastewater Treatment Technologies Market
| Opportunity | Why now | Buyer / lead segment | Recommended play | Main barrier | Likely beneficiaries |
|---|---|---|---|---|---|
| Extend urban wastewater treatment coverage | Revised collection and treatment coverage requirements | Municipal authorities serving covered EU urban areas | Develop treatment packages alongside the local collection scope | Converting an area-wide duty into a workable plant-level design | Compact wastewater-plant suppliers such as SUEZ |
| Add micropollutant treatment capability | Advanced-treatment duty with industry cost responsibility | EU wastewater operators and responsible producer sectors | Align treatment selection with the applicable financing arrangement | Coordinating treatment delivery with the cost-allocation mechanism | Micropollutant-treatment designers such as SUEZ |
| Deliver a belt-press polymer plant | Christchurch RFP with proposals due October 28, 2026 | Christchurch City Council | Offer an integrated design-and-construction proposal | Combined design and construction delivery capability | Wastewater design-build suppliers such as Vertex Engineers |
| Source: Mordor Intelligence | |||||
Christchurch City Council’s polymer-plant procurement combines design and construction within one buyer requirement. The EU duties create a broader opening for plant-level treatment packages, with each package scoped to the applicable coverage or micropollutant requirement. Producer sectors carry at least 80% of micropollutant removal costs under the EU scheme, making treatment selection and cost allocation a joint commercial decision. Suppliers able to scope packages for both plant operators and responsible producer sectors can address the treatment requirement alongside its funding arrangement.
Recent Industry Developments in Water And Wastewater Treatment Technologies Market
- Aug 2026: Select Water Solutions agreed to add 60,000 barrels per day of produced-water recycling capacity in Eddy County, New Mexico, as part of a pipeline, storage and recycling expansion.
- Jul 2026: The Bangalore Water Supply and Sewerage Board awarded WABAG design-build-operate work for 2 sewage treatment plants and a tertiary treatment plant in India.
- Mar 2026: DuPont announced the launch of upgraded FilmTec NF270-400/34 nanofiltration elements designed for municipalities and drinking-water utilities.
Water And Wastewater Treatment Technologies Market Report Scope and Research Methodology
Market Definition and Coverage
The water and wastewater treatment technologies market measures annual spending on technologies that treat raw water and wastewater for contaminant removal and discharge or reuse compliance globally. It covers municipal and industrial applications across all regions.
Scope exclusions: General civil construction spending, unrelated utility services, and treatment chemicals sold separately are excluded.
Segments Covered in This Report
- By Treatment Type
- Oil/Water Separation
- Suspended Solids Removal
- Dissolved Solids Removal
- Biological Treatment/Nutrient and Metals Recovery
- Disinfection/Oxidation
- Other Types
- By End-user Industry
- Municipal Water and Wastewater Treatment
- Food and Beverage
- Pulp and Paper
- Oil and Gas
- Healthcare
- Poultry and Aquaculture
- Chemical and Petrochemical
- Other End-user Industries
- By Geography
- Asia-Pacific
- China
- India
- Japan
- South Korea
- ASEAN
- Rest of Asia-Pacific
- North America
- United States
- Canada
- Mexico
- Europe
- Germany
- United Kingdom
- France
- Italy
- Spain
- Russia
- Rest of Europe
- South America
- Brazil
- Argentina
- Rest of South America
- Middle-East and Africa
- Saudi Arabia
- South Africa
- Rest of Middle-East and Africa
- Asia-Pacific
Data Sources, Market Sizing, and Validation
Desk Research
Illustrative sources such as the WHO and UNICEF Joint Monitoring Programme, FAO AQUASTAT, the European Environment Agency, and UNESCO water reports provide measures of drinking-water access, water withdrawals, wastewater-treatment duties, and untreated discharges that help frame demand by region and application. Official utility statistics, environmental regulations, and technical literature can then check treatment obligations, investment drivers, and the units relevant to annual technology spending.
World Bank water-sector material, company annual reports and regulatory filings, investor presentations, and reputable business and trade press can add evidence on utility investment, supplier offerings, contracts, and project timing. These named sources are not exhaustive, and further sources inform collection, validation and clarification.
Primary Interviews and Surveys
Interviews and structured surveys would target technology suppliers, municipal and industrial buyers, engineering and project-delivery firms, and plant operators across APAC, EMEA, and the Americas, with questions tailored to equipment, deployment contracts, treatment applications, and procurement cycles. Respondent evidence would test secondary-source assumptions on included spending, segment shares, regional timing, and forecast drivers, while gaps would be followed up with additional source checks and triangulation across supplier, buyer, and project evidence. When respondent evidence differs from published procurement or capacity records, analysts recheck the spending boundary with supplier and buyer accounts.
Distribution of primary research fieldwork respondents
| Company type | Respondent position | Region |
|---|---|---|
| Top tier: 35% | CXOs: 15% | APAC: 40% |
| Mid tier: 45% | Functional/Unit leaders: 35% | EMEA: 33% |
| Smaller Players: 20% | Managers: 50% | Americas: 27% |
Market-Sizing & Forecasting
The model estimates global annual technology spending in USD from the top down, then checks selected totals with supplier revenue roll-ups, project and channel checks, and sampled contract or equipment value times deployed capacity. It uses municipal and industrial capital spending, treatment capacity additions and upgrades, wastewater-treatment coverage, water stress and reuse requirements, and technology-specific procurement trends to explain demand by treatment type, end-user industry, and region. Public sources and supplier disclosures support segment shares by showing where treatment duties, projects, and purchases occur. A multivariate regression links these indicators to spending, with scenario analysis for regulatory timing, reuse investment, and membrane cost constraints. Missing observations are checked against related years and neighboring market evidence, while interviews with buyers, suppliers, and operators would challenge variable-level forecasts and flag where local procurement or project timing requires adjustment.
Data Validation & Update Cycle
Analysts triangulate supplier disclosures, public investment and treatment indicators, project records, and survey evidence, then check units, year alignment, coverage, and segment totals for anomalies and unexplained variance. They resolve exceptions through source review and targeted re-contact of relevant respondents before a second analyst reviews the calculations, assumptions, and narrative. Where material regulatory, project, or supplier changes emerge, analysts run interim checks in addition to the annual refresh and a fresh pre-delivery review.
Mordor Intelligence's Water and Wastewater Treatment Technologies Market Size Measured Against Other Published Estimates
The water and wastewater treatment technologies market measures annual spending on technologies that treat raw water and wastewater for contaminant removal and discharge or reuse compliance globally. The sizing model uses municipal and industrial capital spending, treatment capacity additions and upgrades, wastewater-treatment coverage, water stress and reuse requirements, and technology-specific procurement trends to explain demand by treatment type, end-user industry, and region.
Key Gap Drivers are addressed through a consistent transaction boundary, market-specific demand inputs and cross-checks across the study. Analysts triangulate supplier disclosures, public investment and treatment indicators, project records, and survey evidence, then check units, year alignment, coverage, and segment totals for anomalies and unexplained variance.
Benchmark comparison
| Source | Market Size | Gaps in Research Methodology |
|---|---|---|
| Mordor Intelligence | USD 73.25 B (2027) | |
| Global Market Research Firm A | USD 108.75 B (2026) | At its 2026 base, this estimate is 48.5% above this report's 2027 value of USD 73.25 B, 1 year later. The wider application scope includes residential purification, raising the total above the municipal and industrial boundary. |
| Global Market Research Firm B | USD 371.84 B (2025) | At its 2025 base, this estimate is 407.6% above this report's 2027 value of USD 73.25 B, 2 years later. The broader scope counts treatment equipment, chemicals, engineering and construction, operations and maintenance, and monitoring, and includes residential, commercial, and agricultural applications. |
Mordor Intelligence ties the estimate to the study’s defined coverage and demand model. Analysts triangulate supplier disclosures, public investment and treatment indicators, project records, and survey evidence, then check units, year alignment, coverage, and segment totals for anomalies and unexplained variance.
Key Questions Answered in the Report
What is the water and wastewater treatment technologies market size and growth outlook?
The market is estimated at USD 73.25 billion in 2027 and forecast to reach USD 97.43 billion by 2032, at a CAGR of 5.87% during 2027-2032.
What is driving demand for water and wastewater treatment systems?
Industrial reuse targets in China, modular drinking-water treatment in the Philippines and produced-water recycling investment in the United States support demand.
Which treatment category leads the industry?
Dissolved solids removal was the largest treatment segment, with a 31.1% share of the global market in 2026. Biological treatment/nutrient and metals recovery is forecast to grow fastest at a CAGR of 6.9% during 2027-2032.
Which companies are leading treatment technology participants?
Major participants include Veolia, DuPont, Ecolab, Kurita Water Industries Ltd. and Xylem.
What constrains the adoption of advanced wastewater treatment?
Membrane bioreactor operating costs and operator shortages constrain implementation. At a June 2026 briefing, South Africa’s Portfolio Committee on Water and Sanitation reported 1,151 of 2,431 required wastewater process controllers employed nationally.
Which region leads the water and wastewater treatment technology industry?
Asia-Pacific held a 35.34% share of the global market in 2026 and is forecast to grow fastest at a CAGR of 8.25% during 2027-2032.