Market Overview
| Study Period | 2021 - 2031 |
|---|---|
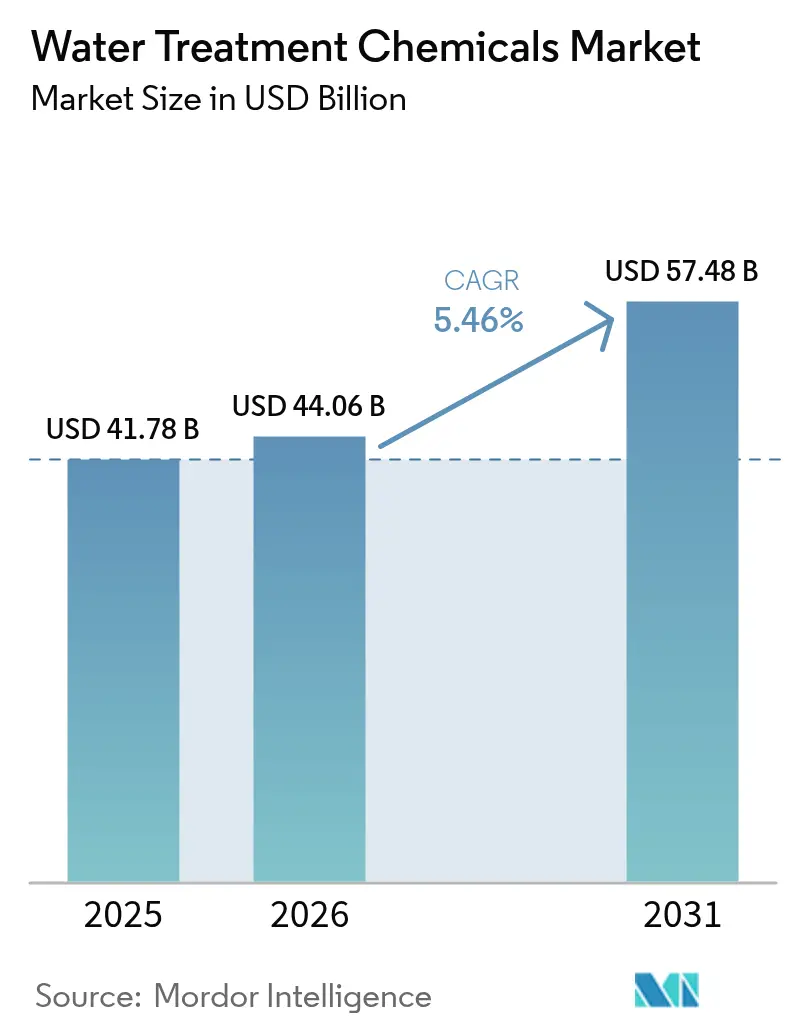
| Market Size (2026) | USD 44.06 Billion |
| Market Size (2031) | USD 57.48 Billion |
| Growth Rate (2026 - 2031) | 5.46% CAGR |
| Fastest Growing Market | Asia Pacific |
| Largest Market | Asia Pacific |
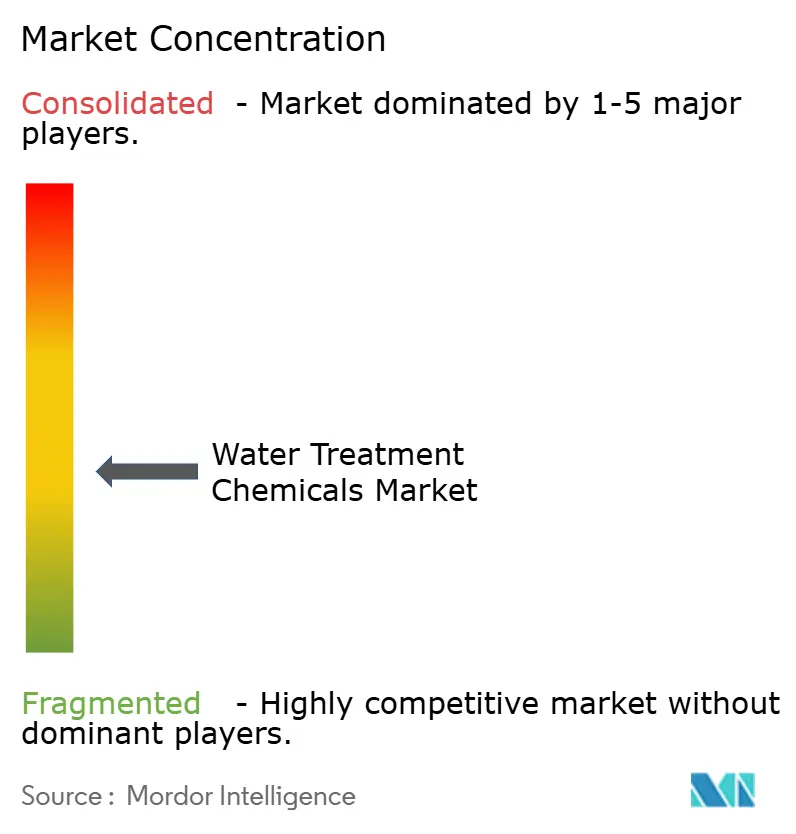
| Market Concentration | Medium |
Major Players *Disclaimer: Major Players sorted in no particular order Image © Mordor Intelligence. Reuse requires attribution under CC BY 4.0. | |
Water Treatment Chemicals Market Analysis by Mordor Intelligence
The Water Treatment Chemicals Market size is expected to increase from USD 41.78 billion in 2025 to USD 44.06 billion in 2026 and reach USD 57.48 billion by 2031, growing at a CAGR of 5.46% over 2026-2031. Heightened enforcement of effluent norms, the expansion of zero-liquid-discharge systems in power and mining, and a surging demand for ultra-pure water from semiconductor fabs and green-hydrogen electrolyzers are driving growth during the forecast period of 2026–2031. Global formulators are integrating chemicals with real-time dosing software, which reduces consumption while safeguarding asset integrity. Mid-tier suppliers that lack backward integration are experiencing challenges due to price fluctuations in acrylamide and quaternary-ammonium compound feedstocks. Although there is a small but notable shift toward electro-oxidation reactors, which reduces coagulant shares in niche industrial settings, the overall demand for chemicals continues to rise.
Key Report Takeaways
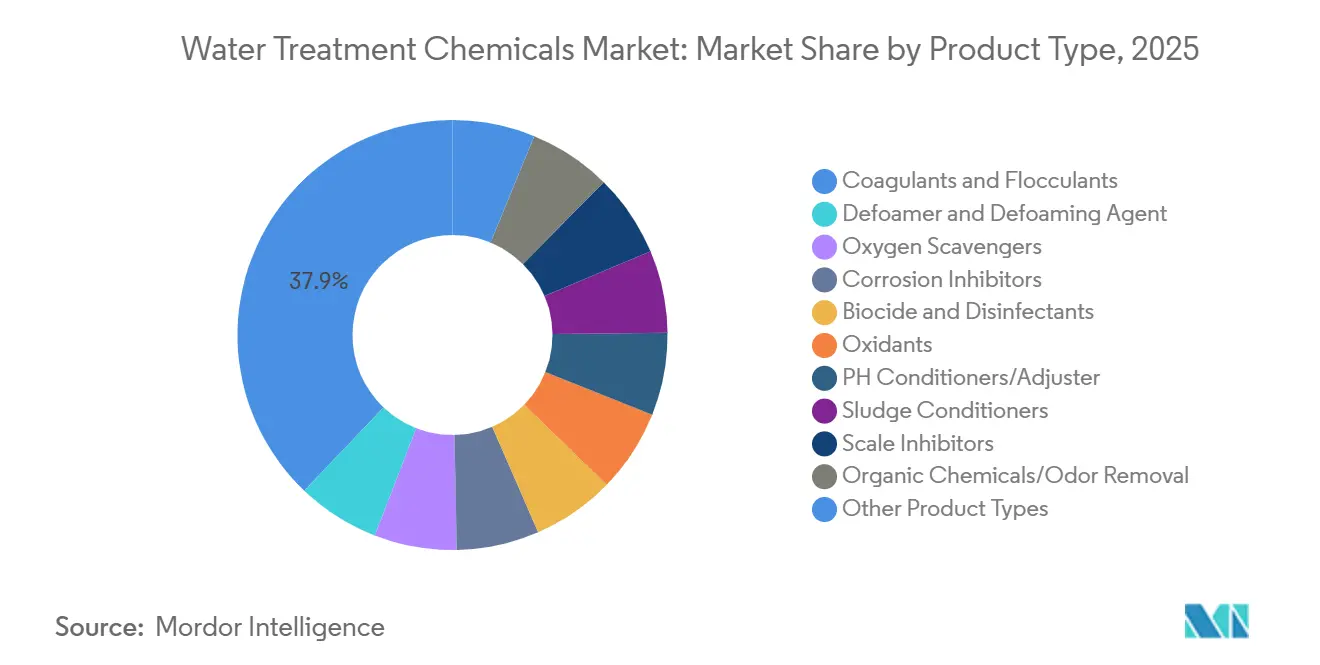
- By product type, coagulants and flocculants commanded 37.89% of the water treatment chemicals market share in 2025, and are projected to expand at a 5.89% CAGR in the forecast period (2026-2031).
- By end-user industry, municipal water and wastewater utilities led with 35.78% share of the water treatment chemicals market in 2025; the semiconductor and electronics segment records the highest projected CAGR at 6.84% in the forecast period (2026-2031).
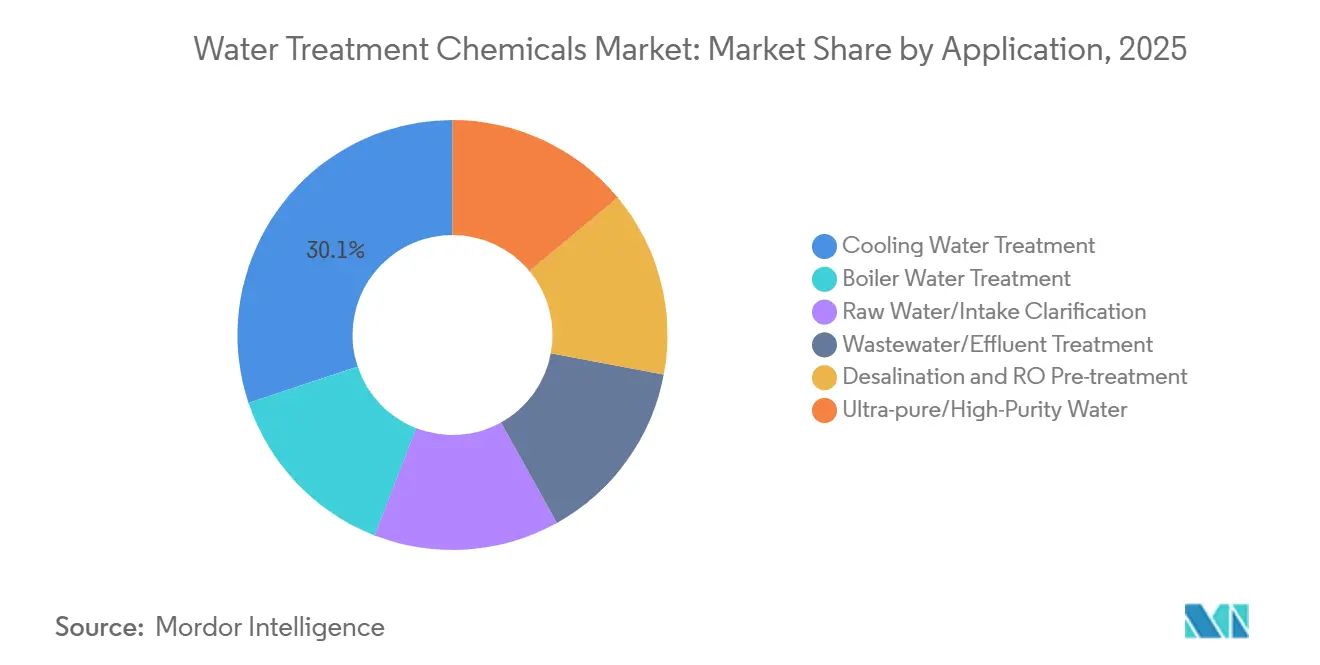
- By application, cooling water treatment held 30.12% of the water treatment chemicals market size in 2025, while ultra-pure/high-purity water treatment is forecast to grow at a 7.33% CAGR in the forecast period (2026-2031).
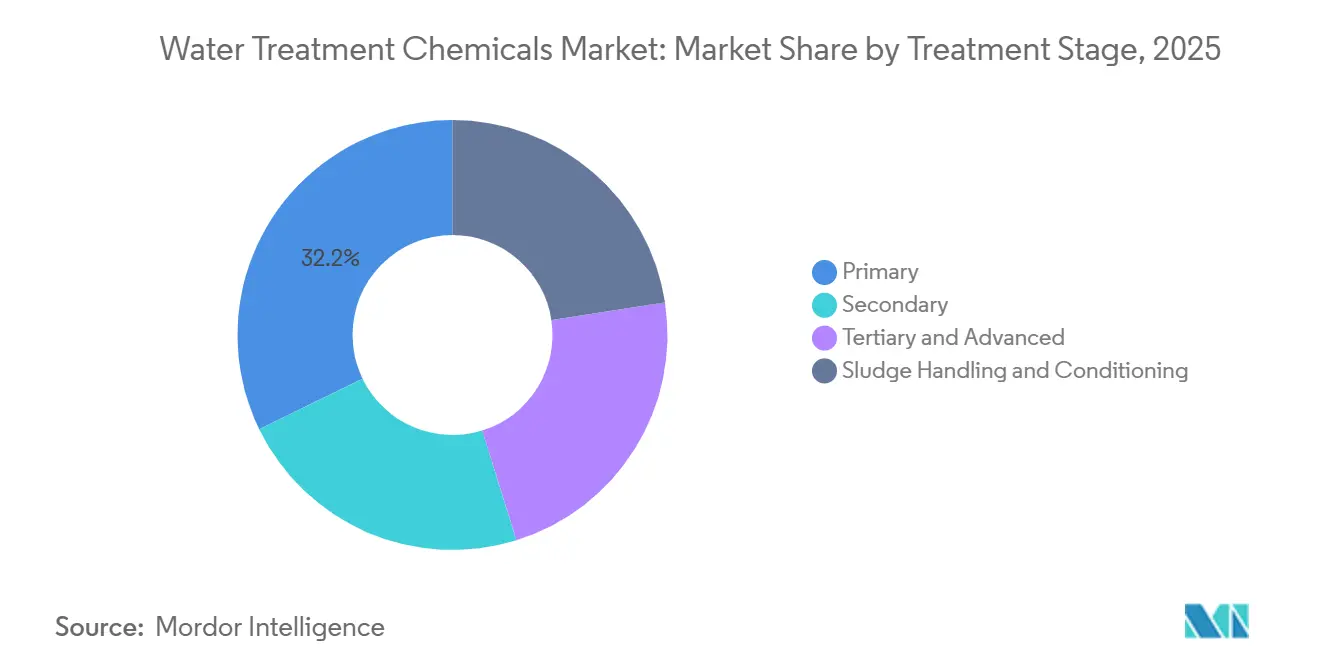
- By treatment stage, primary treatment accounted for a 32.22% share of the water treatment chemicals market size in 2025, whereas sludge handling and conditioning is set to advance at a 6.15% CAGR between 2026-2031.
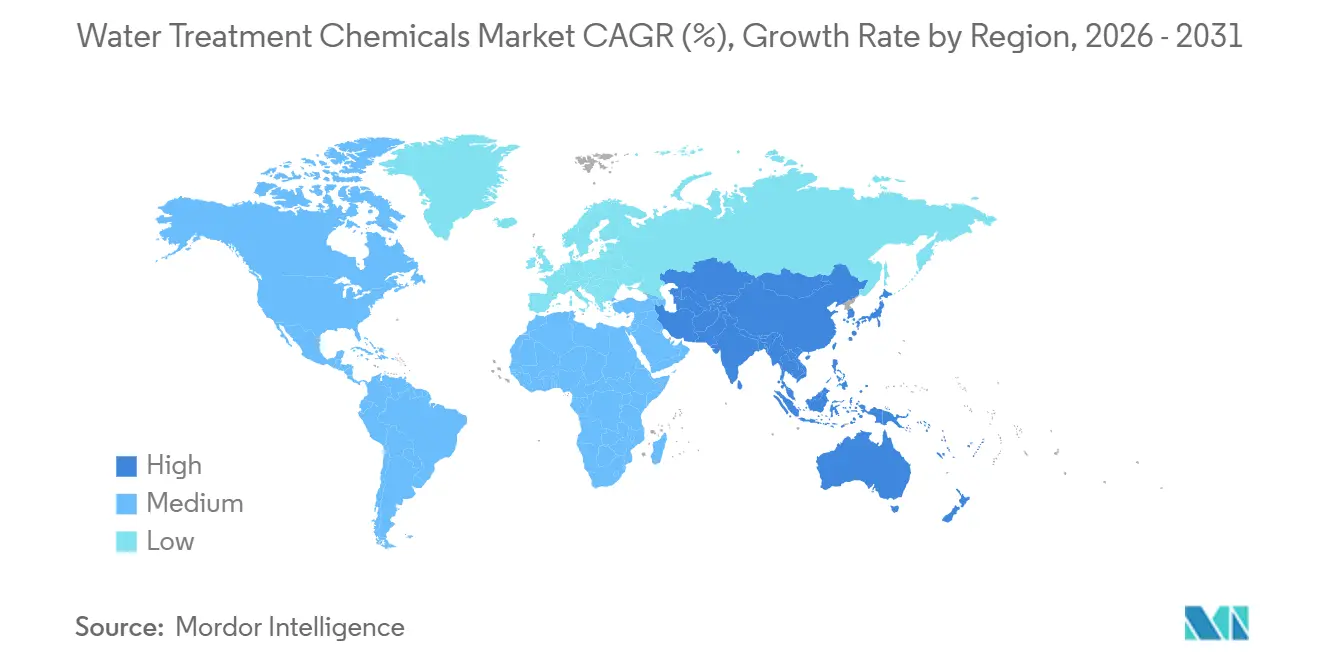
- By geography, Asia Pacific dominated with 47.71% revenue share in 2025 and continues as the fastest-growing region at 6.92% CAGR over the forecast period (2026-2031).
Note: Market size and forecast figures in this report are generated using Mordor Intelligence’s proprietary estimation framework, updated with the latest available data and insights as of 2026.
Global Water Treatment Chemicals Market Trends and Insights
Drivers Impact Analysis*
| Drivers | (~) % Impact on CAGR Forecast | Geographic Relevance | Impact Timeline |
|---|---|---|---|
| Tightening discharge norms for heavy metals and nutrients | +1.2% | Global, with enforcement peaks in North America, EU, and China | Medium term (2-4 years) |
| Industrial zero-liquid-discharge (ZLD) mandates in power and mining | +0.9% | APAC core (China, India), spill-over to Middle East coal-fired plants | Medium term (2-4 years) |
| Municipal infrastructure stimulus in Asia-Pacific and GCC | +0.7% | APAC (India, China, ASEAN) and GCC (Saudi Arabia, UAE, Qatar) | Long term (≥ 4 years) |
| PFAS-specific remediation regulations boosting demand for GAC and IX resins | +0.8% | North America and EU, early adoption in Australia | Short term (≤ 2 years) |
| Ultra-pure water demand from green-hydrogen electrolyzers | +0.6% | Global, with early concentration in EU (Germany, Spain) and Middle East (Saudi Arabia, UAE) | Long term (≥ 4 years) |
| Source: Mordor Intelligence | |||
Tightening Discharge Norms for Heavy Metals and Nutrients
In 2024, the U.S. Environmental Protection Agency (EPA) revised effluent ceilings, and in 2025, China's Ministry of Ecology and Environment followed suit.[1]U.S. Environmental Protection Agency, “Steam Electric Power Generating Effluent Guidelines,” epa.gov These changes forced operators to switch from the conventional ferric chloride to the more specialized polyaluminum chloride. This transition allowed them to meet the stringent residual metal targets set below the required levels. Concurrently, the European Union's 2025 Urban Wastewater Treatment Directive capped total phosphorus in sensitive catchments. As a result, demand surged for ferric sulfate-polymer blends, which effectively minimized the need for alkali additions.
Industrial Zero-Liquid-Discharge Mandates in Power and Mining
In 2026, China's National Development and Reform Commission mandated coal-chemical plants to implement Zero Liquid Discharge (ZLD) rules. This directive curtailed the daily chemical consumption for a standard 600 MW unit, covering antiscalants, biocides, and dispersants. Similarly, in 2024, India's Central Pollution Control Board enforced similar mandates on thermal power stations located across 13 river basins. This resulted in an increased demand for oxygen scavengers and sludge-conditioning polymers during the forecast period of 2026–2031.
PFAS-Specific Remediation Regulations Boosting Demand for GAC and IX Resins
Utilities serving over 10,000 residents must adopt either granular activated carbon or strong-base anion exchange beds to comply with the U.S. EPA's stringent limits on PFOA and PFOS, set at a parts-per-trillion level, during the forecast period of 2026–2031. While coconut-shell-based carbons excel in adsorbing long-chain PFAS, ion-exchange resins effectively capture the elusive short-chain variants that often evade carbon filters.
Ultra-Pure Water Demand from Green-Hydrogen Electrolyzers
Proton-exchange-membrane systems require the feedwater conductivity to remain below 0.1 µS/cm for optimal operation. Each year, a standard electrolyzer consumes significant amounts of this specialized water, utilizing ion-exchange resin for every liter throughout its operational lifespan. Looking ahead, Saudi Arabia's NEOM project is expected to require substantial quantities annually, aligning with its capacity activation during the forecast period of 2026–2031.
Restraints Impact Analysis*
| Restraints | (~) % Impact on CAGR Forecast | Geographic Relevance | Impact Timeline |
|---|---|---|---|
| Volatile raw-material prices for specialty polymers and biocides | -0.7% | Global, with acute exposure in regions reliant on imported acrylamide and quaternary-ammonium compounds | Short term (≤ 2 years) |
| Electro-oxidation micro-reactors lowering coagulant use | -0.4% | North America and EU industrial wastewater segments, limited municipal penetration | Medium term (2-4 years) |
| Decentralized atmospheric water generation bypassing treatment plants | -0.2% | Global, concentrated in arid regions and off-grid applications with minimal municipal impact | Long term (≥ 4 years) |
| Source: Mordor Intelligence | |||
Volatile Raw-Material Prices for Specialty Polymers and Biocides
From early 2024 to mid-2025, production curtailments driven by gas shortages in China's Shandong province caused notable swings in acrylamide monomer prices. These price changes subsequently pushed up the costs of delivered flocculants. In Europe, a fire incident that significantly reduced isothiazolinone capacity led to rising biocide premiums, particularly impacting buyers without long-term contracts.
Electro-Oxidation Micro-Reactors Lowering Coagulant Use
In 2025, a textile wastewater plant in India made a pivotal shift by adopting an electro-oxidation reactor, moving away from traditional ferric chloride and polyacrylamide. This transition not only led to a significant reduction in chemical costs but also substantially decreased annual sludge production. Furthermore, the plant's energy consumption - between 2 kWh/m³ and 4 kWh/m³ - remains competitive, particularly in regions where power costs are below a specific threshold[2]International Water Association, “Electro-Oxidation Energy Benchmarks,” iwa-network.org.
*Our forecasts treat driver/restraint impacts as directional, not additive. The impact forecasts reflect baseline growth, mix effects, and variable interactions.
Segment Analysis
By Product Type: Coagulants Lead as PFAS Remediation and Municipal Expansion Drive Polyaluminum Chloride Adoption
Coagulants and flocculants dominated the water treatment chemicals market, capturing 37.89% of the revenue in 2025, with a projected growth rate of 5.89% during the forecast period of 2026–2031. In the Asia-Pacific region, polyaluminum chloride is replacing alum due to its ability to produce significantly less sludge over a wider pH range, which reduces lime consumption in plants. Biocides, traditionally used in standard facilities with substantial daily capacities, are now being increasingly adopted in data-center cooling loops. Following the European Union's 2025 classification of certain phosphonates as persistent and mobile, scale inhibitors are under heightened scrutiny.


By End-User Industry: Semiconductors Surge While Municipal Utilities Anchor Baseline Demand
In 2025, municipal utilities, bolstered by India's Jal Jeevan Mission, accounted for 35.78% of total spending, utilizing significant quantities of water treatment chemicals that year. The semiconductor sector, fueled by Intel's Ohio fabrication plant and Samsung's facility in Texas, has been experiencing a 6.84% CAGR in the forecast period (2026-2031), as both ramp up their ultra-pure water systems, necessitating ongoing mixed-bed resin regeneration.
By Application: Ultra-Pure Water Treatment Outpaces Cooling as Green Hydrogen and Semiconductors Converge
By 2031, green hydrogen and semiconductor projects are set to drive additional demand, pushing ultra-pure water applications to grow at a rate of 7.33% CAGR. While cooling water accounted for 30.12% of revenues in 2025, retrofitting to dry-cooling not only reduces makeup water by half but also slashes chemical consumption significantly.
By Treatment Stage: Primary Coagulation-Flocculation Dominates While Sludge Conditioning Gains from Dewatering Mandates
In the water treatment chemicals market, primary treatment accounted for 32.22% of the 2025 revenue, with coagulant doses varying depending on turbidity. Sludge conditioning increased by 6.15% CAGR in the forecast period (2026-2031), driven by dewatering regulations in Germany and the Netherlands mandating cake moisture levels below a specific threshold, leading to an emphasis on polymer optimization.
Geography Analysis
In 2025, the Asia-Pacific region accounted for 47.71% of the revenue and is projected to grow at a rate of 6.92% in the forecast period of 2026-2031. This growth is largely driven by China's Zero Liquid Discharge (ZLD) retrofits and India's Amrut 2.0 sewage initiative, which alone requires significant quantities of chemicals. North America, capturing a notable portion of 2025's sales, sees its market buoyed by new PFAS regulations and chip fabrication initiatives, bolstered by the CHIPS Act. Europe, holding a considerable share, is swayed by nutrient removal targets, particularly the push to reduce phosphorus levels to 0.5 mg/L in sensitive areas. The Middle East and Africa, together contributing a significant portion, are driven by Saudi Arabia's ambitious plan to achieve a large-scale desalination capacity by 2030. South America is reaping the benefits of Brazil's sanitation mandate, which aims for nearly universal potable water coverage by 2033.

Competitive Landscape
The water treatment chemicals market is moderately fragmented. Kemira is promoting bio-based coagulants, which boast a lifecycle footprint smaller than that of traditional alum. This makes them particularly appealing to utilities aiming for ISO 14001 certifications. In a strategic move, Solenis strengthened its presence in the mining sector by acquiring BASF's flocculant unit in 2024. Ostara introduced nutrient-recovery systems that transform phosphorus into fertilizer, resulting in a significant reduction in coagulant expenses.
Water Treatment Chemicals Industry Leaders
Ecolab
Kemira
SNF
Solenis
BASF SE
- *Disclaimer: Major Players sorted in no particular order

Recent Industry Developments
- November 2024: Solenis has strengthened its position in the mining industry's water treatment market through the acquisition of BASF's flocculants business, further expanding its portfolio of specialized flocculant formulations. This strategic move is expected to strengthen Solenis' competitive position and drive innovation in the water treatment chemicals market.
- August 2024: USALCO, a leading provider of water treatment solutions for municipal and commercial clients, has announced plans to construct a new coagulant production facility near Los Angeles, California. The company aims to strengthen its position in the water treatment chemicals market by boosting production capacity to meet rising regional demand for coagulants.


Global Water Treatment Chemicals Market Report Scope
Water treatment chemicals are used in the treatment process to extract or decrease pollutants and unwanted components from water, such that the treated water becomes suitable for end users. Coagulants and flocculants, oxygen scavengers, corrosion inhibitors, algaecide, chlorine, chlorine dioxide, and other chemicals are a few examples of water treatment chemicals.
The water treatment chemicals market is segmented by product type, end-user industry, application, treatment stage, and geography. By product type, the market is segmented into coagulants and flocculants, defoamers and antifoams, oxygen scavengers, corrosion inhibitors, biocides and disinfectants, oxidants, pH conditioners/adjusters, sludge conditioners, scale inhibitors, organic chemicals and odor removal (activated carbon), and other product types. By end-user industry, the market is segmented into power generation, oil and gas, chemical manufacturing, mining and mineral processing, municipal water and wastewater utilities, food and beverage, pulp and paper, metals and steel, semiconductors and electronics, and others (including pharmaceuticals and life sciences). By application, the market is segmented into boiler water treatment, cooling water treatment, raw water/intake clarification, wastewater/effluent treatment, desalination and RO pre-treatment, and ultra-pure/high-purity water. By treatment stage, the market is segmented into primary (coagulation-flocculation), secondary (biological adjunct chemicals), tertiary and advanced (AOPs, disinfection), and sludge handling and conditioning. The report also covers the market size and forecasts for the market in 19 countries across major regions. For each segment, the market sizing and forecasts are done based on value (USD).
By Product Type
| Coagulants and Flocculants |
| Defoamer and Defoaming Agent (Antifoams) |
| Oxygen Scavengers |
| Corrosion Inhibitors |
| Biocide and Disinfectants |
| Oxidants |
| PH Conditioners/Adjuster |
| Sludge Conditioners |
| Scale Inhibitors |
| Organic Chemicals/Odor Removal (Activated Carbon) |
| Other Product Types |
By End-user Industry
| Power Generation |
| Oil and Gas |
| Chemical Manufacturing |
| Mining and Mineral Processing |
| Municipal Water and Wastewater Utilities |
| Food and Beverage |
| Pulp and Paper |
| Metals and Steel |
| Semiconductor and Electronics |
| Others (Pharmaceuticals and Life-Sciences) |
By Application
| Boiler Water Treatment |
| Cooling Water Treatment |
| Raw Water/Intake Clarification |
| Wastewater/Effluent Treatment |
| Desalination and RO Pre-treatment |
| Ultra-pure/High-Purity Water |
By Treatment Stage
| Primary (Coagulation-Flocculation) |
| Secondary (Biological Adjunct Chemicals) |
| Tertiary and Advanced (AOPs, Disinfection) |
| Sludge Handling and Conditioning |
By Geography
| Asia-Pacific | China |
| India | |
| Japan | |
| South Korea | |
| ASEAN Countries | |
| Rest of Asia-Pacific | |
| North America | United States |
| Canada | |
| Mexico | |
| Europe | Germany |
| United Kingdom | |
| France | |
| Italy | |
| Russia | |
| Scandinavia | |
| Rest of Europe | |
| South America | Brazil |
| Argentina | |
| Rest of South America | |
| Middle-East and Africa | Saudi Arabia |
| United Arab Emirates | |
| Qatar | |
| Nigeria | |
| South Africa | |
| Rest of Middle-East and Africa |
| By Product Type | Coagulants and Flocculants | |
| Defoamer and Defoaming Agent (Antifoams) | ||
| Oxygen Scavengers | ||
| Corrosion Inhibitors | ||
| Biocide and Disinfectants | ||
| Oxidants | ||
| PH Conditioners/Adjuster | ||
| Sludge Conditioners | ||
| Scale Inhibitors | ||
| Organic Chemicals/Odor Removal (Activated Carbon) | ||
| Other Product Types | ||
| By End-user Industry | Power Generation | |
| Oil and Gas | ||
| Chemical Manufacturing | ||
| Mining and Mineral Processing | ||
| Municipal Water and Wastewater Utilities | ||
| Food and Beverage | ||
| Pulp and Paper | ||
| Metals and Steel | ||
| Semiconductor and Electronics | ||
| Others (Pharmaceuticals and Life-Sciences) | ||
| By Application | Boiler Water Treatment | |
| Cooling Water Treatment | ||
| Raw Water/Intake Clarification | ||
| Wastewater/Effluent Treatment | ||
| Desalination and RO Pre-treatment | ||
| Ultra-pure/High-Purity Water | ||
| By Treatment Stage | Primary (Coagulation-Flocculation) | |
| Secondary (Biological Adjunct Chemicals) | ||
| Tertiary and Advanced (AOPs, Disinfection) | ||
| Sludge Handling and Conditioning | ||
| By Geography | Asia-Pacific | China |
| India | ||
| Japan | ||
| South Korea | ||
| ASEAN Countries | ||
| Rest of Asia-Pacific | ||
| North America | United States | |
| Canada | ||
| Mexico | ||
| Europe | Germany | |
| United Kingdom | ||
| France | ||
| Italy | ||
| Russia | ||
| Scandinavia | ||
| Rest of Europe | ||
| South America | Brazil | |
| Argentina | ||
| Rest of South America | ||
| Middle-East and Africa | Saudi Arabia | |
| United Arab Emirates | ||
| Qatar | ||
| Nigeria | ||
| South Africa | ||
| Rest of Middle-East and Africa | ||


Key Questions Answered in the Report
What is the projected market size for the water treatment chemicals market over 2026-2031?
The Water Treatment Chemicals Market size is expected to reach USD 44.06 billion in 2026 and reach USD 57.48 billion by 2031, growing at a CAGR of 5.46% over 2026-2031.
Which segment will add the fastest growth, ultra-pure water or cooling?
Ultra-pure water is set to expand at 7.33% through 2031, outpacing cooling applications.
Why are coagulant doses shifting toward polyaluminum chloride?
Regulatory phosphorus and metal limits favor polyaluminum chloride because it cuts sludge and operates across a wider pH range.
How big is Asia-Pacific’s share of global revenue?
Asia-Pacific contributed 47.71% of 2025 revenue and is expected to grow at 6.92% through 2031.
Page last updated on:


