Market Overview
| Study Period | 2020 - 2031 |
|---|---|
| Forecast Data Period | 2026 - 2031 |
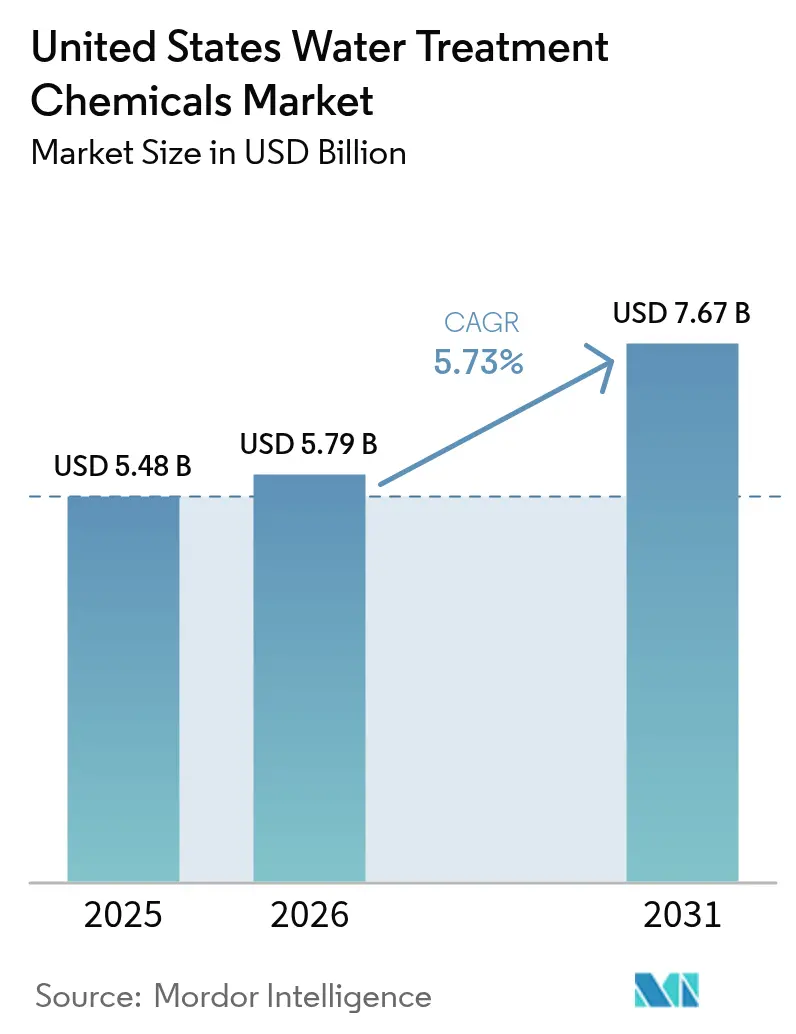
| Base Year Market Size (2025) | USD 5.48 Billion |
| Market Size (2026) | USD 5.79 Billion |
| Market Size (2031) | USD 7.67 Billion |
| Growth Rate (2026 - 2031) | 5.73% CAGR |
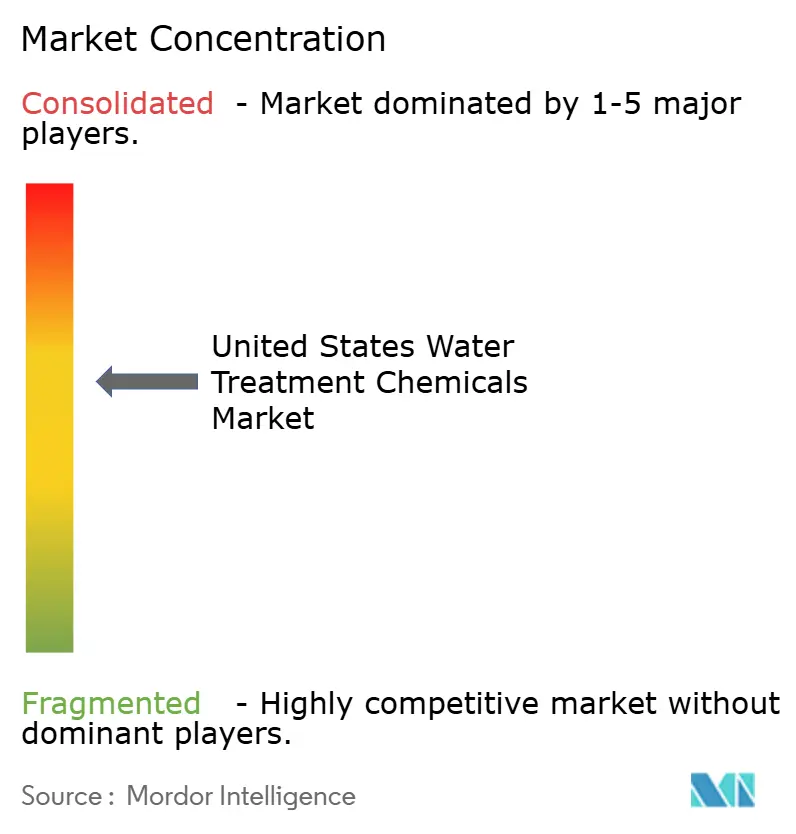
| Market Concentration | Medium |
Major Players *Disclaimer: Major Players sorted in no particular order Image © Mordor Intelligence. Reuse requires attribution under CC BY 4.0. | |
United States Water Treatment Chemicals Market Analysis by Mordor Intelligence
The United States Water Treatment Chemicals Market size was valued at USD 5.48 billion in 2025 and estimated to grow from USD 5.79 billion in 2026 to reach USD 7.67 billion by 2031, at a CAGR of 5.73% during the forecast period (2026-2031). Tightened federal PFAS rules, accelerated industrial water-reuse mandates, and the rapid adoption of digital dosing platforms are combining to boost chemical demand across municipal and industrial systems. In parallel, the U.S. Environmental Protection Agency (EPA) has earmarked USD 15 billion in infrastructure grants for PFAS remediation and lead-pipe replacement, sustaining a multi-year purchasing cycle for specialized coagulants, corrosion inhibitors, and regenerants. Southern states command the largest share because of dense petrochemical corridors and population growth, while the West records the swiftest expansion on the back of California’s reuse mandates and a booming semiconductor supply chain. Municipal utilities remain the single biggest consumer group, yet food and beverage processors post the fastest gains as stricter Food Safety Modernization Act (FSMA) hygiene protocols spur investments in clean-in-place (CIP) chemicals. Cost volatility for hydrochloric acid and caustic soda, together with rising energy prices, continues to pressure manufacturer margins, though premium specialty blends offset part of the squeeze by delivering higher value per pound of active ingredient.
Key Report Takeaways
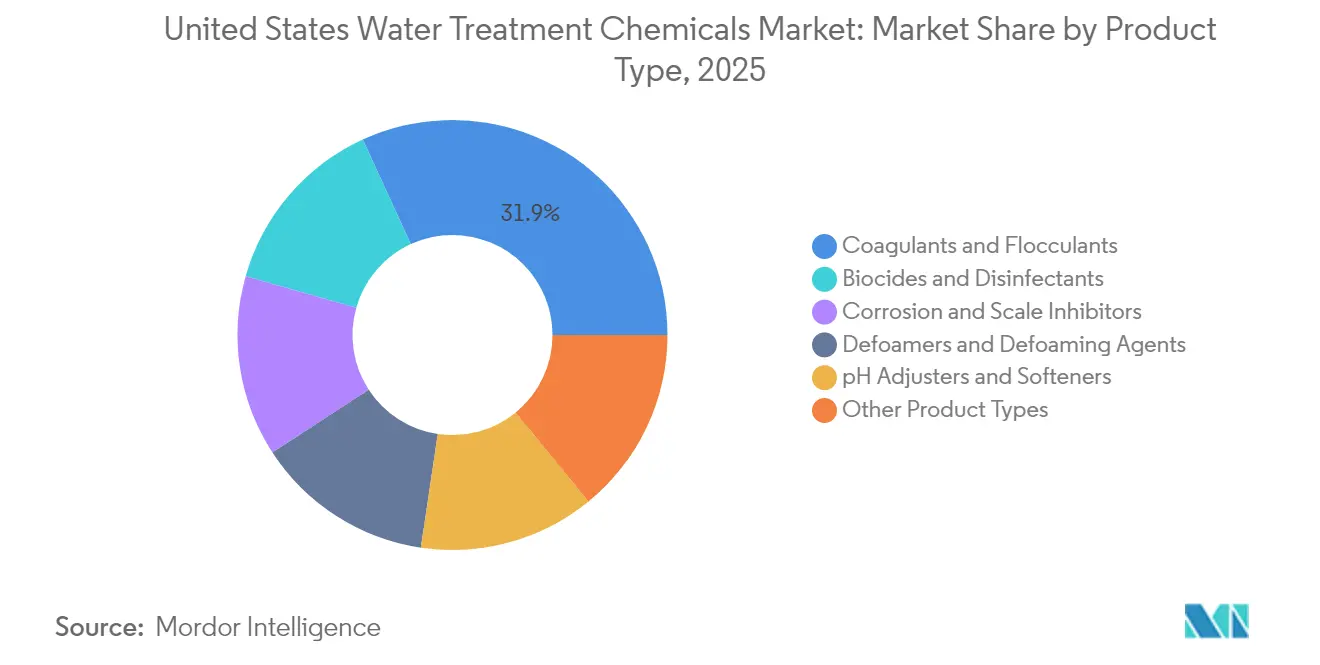
- By product type, coagulants and flocculants held 31.85% of the United States water treatment chemicals market share in 2025, while biocides and disinfectants are projected to grow at a 6.08% CAGR through 2031.
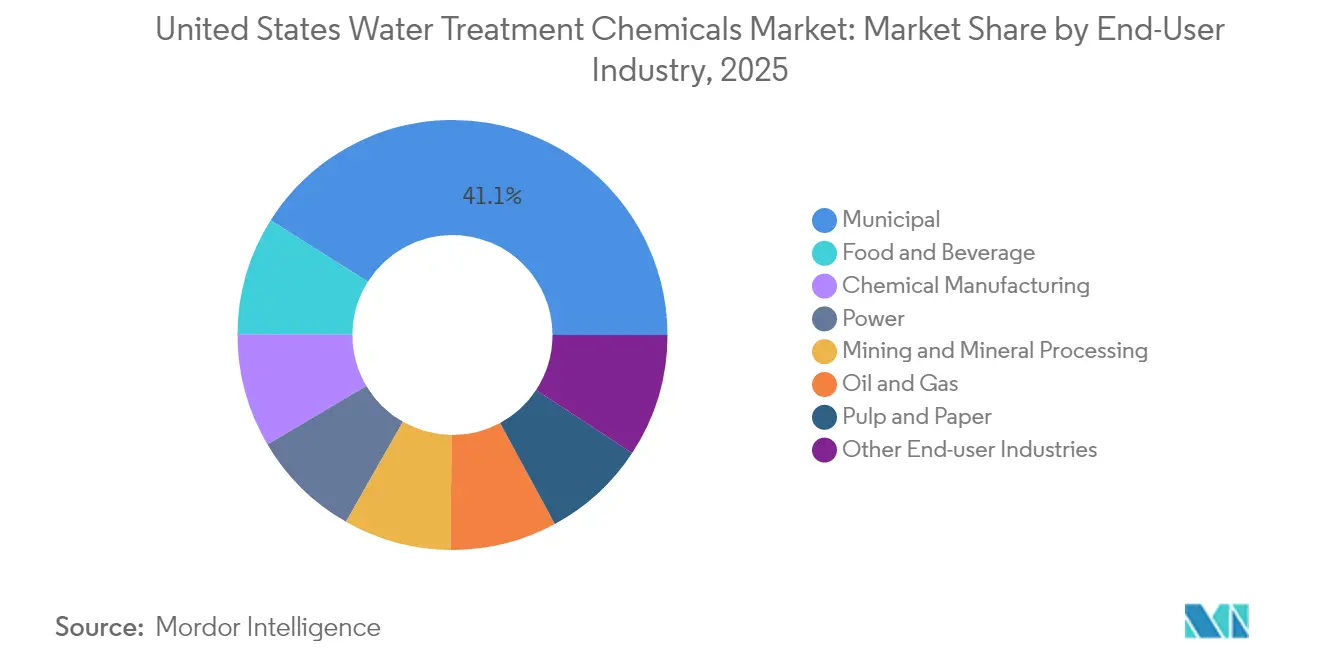
- By end-user industry, municipal utilities accounted for 41.05% of the United States water treatment chemicals market size in 2025; food and beverage processors are advancing at a 6.22% CAGR to 2031.
- By geography, the South led the United States water treatment chemicals market with a 36.10% revenue share in 2025, whereas the West is forecast to expand at a 5.96% CAGR through 2031.
Note: Market size and forecast figures in this report are generated using Mordor Intelligence’s proprietary estimation framework, updated with the latest available data and insights as of 2026.
United States Water Treatment Chemicals Market Trends and Insights
Drivers Impact Analysis*
| Drivers | (~) % Impact on CAGR Forecast | Geographic Relevance | Impact Timeline |
|---|---|---|---|
| Federal PFAS and lead-pipe funding surge | +1.5% | National, strongest in Northeast and Midwest legacy networks | Medium term (2-4 years) |
| Industrial water-reuse expansion | +0.8% | West Coast and Southwest drought-prone zones | Long term (≥ 4 years) |
| Membrane-pretreatment chemicals adoption | +1.2% | Early uptake in California, Texas, Florida | Medium term (2-4 years) |
| EPA PFAS discharge limits | +0.9% | National, immediate industrial effluent impact | Short term (≤ 2 years) |
| Digital dosing and sensor-linked chemistries | +0.6% | Industrial hubs in Texas, Louisiana, California | Long term (≥ 4 years) |
| Source: Mordor Intelligence | |||
Federal PFAS and Lead-pipe Funding Surge
A USD 15 billion federal grant pool targeted at PFAS cleanup and legacy service-line replacement drives a pronounced increase in demand for enhanced-coagulation blends, corrosion inhibitors, and granular activated carbon (GAC) regenerants[1]U.S. Environmental Protection Agency, “Drinking Water Infrastructure Grants,” epa.gov . Smaller utilities lacking capital for advanced membranes deploy high-charge aluminum and ferric formulations because these options offer the lowest lifecycle cost for sub-nanogram PFAS removal. Simultaneously, projects replacing aged lead lines rely on phosphate-based corrosion control agents to curb lead solubility during excavation. The bulk of awards is allocated to Midwestern and Northeastern cities, which were built on 19th-century infrastructure, creating a multiyear backlog of chemical requisitions tightly linked to grant disbursement schedules. Suppliers with in-house toxicology and regulatory support win a larger share because they navigate EPA reporting and product registration steps more efficiently.
Industrial Water-reuse Expansion
California’s statewide rule requires industrial sites that consume over 1 million gallons per month to meet a 30% recycled-water threshold by 2030, thereby increasing demand for antiscalants, biocides, and cleaning formulations compatible with multiple reuse loops[2]California Water Resources Control Board, “Water Recycling Program,” waterboards.ca.gov. Semiconductor fabs in Arizona and the evolving petrochemical complexes along the Gulf rely on ultrapure water (UPW) trains that feature ion-exchange regeneration, high-purity acids, and micro-biocides to protect wafer yields. Produced-water recycling in shale plays gains traction as disposal fees exceed USD 3 per barrel, spurring the uptake of high-temperature scale inhibitors and broad-spectrum oxidants that can withstand 150,000 ppm salinity. Food and beverage plants are adding closed-loop CIP systems to counter rising municipal surcharges, which now surpass USD 15 per thousand gallons in drought-stressed counties.
Membrane-Pretreatment Chemicals Adoption
The growing deployment of reverse-osmosis (RO) and nanofiltration skids in both municipal and industrial plants shifts spending toward antiscalants formulated for low-pH operation, silica control, and iron sequestration. A nationwide pivot to membranes for PFAS abatement accelerates orders for chlorine dioxide and non-oxidizing biocides that suppress biofouling without compromising RO polyamide layers. Pharmaceutical and electronics customers negotiate premium prices for ultrapure pretreatment blends certified to have a trace-metal content of less than 1 ppb. As forward-osmosis pilots and membrane-distillation units move from pilot to early commercial scale, vendors experiment with new dispersants that maintain high flux under elevated osmotic pressures.
EPA PFAS Discharge Limits
New effluent standards capping PFOA and PFOS at 4 ppt are pushing textile finishers, aerospace platers, and landfill leachate processors to retrofit coagulation-adsorption trains or add polishing chemistries, such as functionalized ion-exchange resins. The timeline is immediate for direct-discharge permits, resulting in a front-loaded purchase curve through 2026, followed by steady-state operating volumes. Market uptake favors aluminum-chlorohydrate coagulants paired with powdered activated carbon due to their fast kinetics and lower sludge volumes compared with lime-based options.
Restraints Impact Analysis*
| Restraints | (~) % Impact on CAGR Forecast | Geographic Relevance | Impact Timeline |
|---|---|---|---|
| Escalating raw-material and energy costs | -0.7% | National; acute in Gulf Coast chlor-alkali hubs | Short term (≤ 2 years) |
| Shift to chemical-free technologies | -0.4% | Cost-sensitive municipal utilities | Medium term (2-4 years) |
| By-product toxicity regulations on biocides | -0.3% | California and Northeast first movers | Long term (≥ 4 years) |
| Source: Mordor Intelligence | |||
Escalating Raw-Material and Energy Costs
Hydrochloric acid and caustic soda values rose in 2024, driven by higher natural-gas benchmarks and logistics bottlenecks, which crimped producer gross margins. Chlor-alkali units along the Gulf cut utilization during hurricane-related power disruptions, amplifying spot shortages. Municipal bid cycles, often locked a year in advance, left suppliers exposed to cost spikes they could not pass through. Smaller distributors serving rural plants faced greater pain because diesel surcharges added 8-12% to delivered pricing, yet consumption volumes stayed fixed. Larger players offset some of the impact by switching to rail and barge routes and by flexing their integrated chlorine and vinyl value chains.
Shift to Chemical-Free Technologies
Medium-sized cities are evaluating UV-AOP, ozone, and membrane bioreactor systems to reduce handling risks associated with bulk chlorine and alum sludge. Capital outlays remain the primary hurdle, but federal Build America, Buy America (BABA) funds make non-chemical gear more affordable in selected counties. When adopted, consumption of certain disinfectants falls abruptly, trimming order volumes for sodium hypochlorite and quaternary amines. Nonetheless, hybrids that still rely on specialized cleaners and residual corrosion inhibitors maintain a sizable share of chemical spend, even in “chemical-free” plants.
*Our forecasts treat driver/restraint impacts as directional, not additive. The impact forecasts reflect baseline growth, mix effects, and variable interactions.
Segment Analysis
By Product Type: Biocides Drive Growth Despite Coagulant Dominance
Coagulants and flocculants accounted for 31.85% of the United States' water treatment chemicals market share in 2025, driven by their indispensable role during primary clarification across both municipal and industrial basins. Spending on aluminum-based and polyferric blends remains stable because every gallon of raw water requires baseline particle removal, yet volume growth mirrors population growth rather than surging. Biocides and disinfectants, by contrast, record a 6.08% CAGR, the fastest among all categories. PFAS discharge limits, tighter pathogen count thresholds, and more complex membrane trains each require specialized broad-spectrum oxidants and non-oxidizing formulations. Premium corrosion and scale inhibitors post mid-single-digit growth as lead service line replacements surge. pH adjusters and softeners confront commodity pressure: caustic soda spot volatility erodes margins, yet consistent demand from power and pulp segments sustains baseline volume. Defoamers grow off a smaller base as biological systems proliferate, particularly in industrial digesters where surface tension imbalances drive foaming incidents. Specialty polymers, ion-exchange resins, and niche additives grouped under “other product types” capture semiconductor and pharmaceutical buyers willing to pay three to four times the price per pound in exchange for ppb-level purity. Digital dosing reshapes procurement logic. Buyers evaluate chemical supply through a performance lens — verified residual control, minimal sludge, and extended membrane life — rather than pounds delivered. Vendors that couple real-time telemetry with chemical packages gain share despite charging a 20-30% price premium, reinforcing an industry pivot from volume to value.


By End-User Industry: Municipal Leadership with Food and Beverage Acceleration
Municipal utilities accounted for 41.05% of the United States water treatment chemicals market in 2025, a position they are expected to maintain through 2031, as the Safe Drinking Water Act (SDWA) compliance drives consistent demand, regardless of macroeconomic cycles. Infrastructure-funded lead-line swaps and PFAS pilot rollouts maintain a healthy baseline. The food and beverage segment, however, grows at 6.22% CAGR, the fastest track among all industries, as strict FSMA hazard-analysis mandates extend sanitizing routines and drive upgrades to CIP formulations certified for direct food contact. Power generation plants remain significant buyers of scale inhibitors, pH modifiers, and oxygen scavengers for high-pressure boilers; however, the gradual retirement of coal and combined-cycle gas turbines is tempering volumetric growth. Oil and gas fields require customized chemical cocktails to treat produced water, which is often laden with scale-forming ions and bacteria. Chemical manufacturing sites push for ultra-low conductivity influent, spurring orders for high-purity acids, caustic, and mixed-bed resins. Mining and mineral processors utilize flocculants to expedite tailings dewatering, with lithium brine projects in Nevada and Arkansas serving as new growth nodes. Pulp and paper mills are shrinking in number, but the survivors are investing in advanced biocides and slime control to raise uptime, thereby sustaining a niche but sticky client base. Sales channels diverge: municipal accounts prize multi-year contracts and safety stock, while industrial buyers shift toward just-in-time (JIT) delivery buffered by on-site bulk tanks. Technical service becomes a decisive tie-breaker as plants lean on vendor chemists to troubleshoot fluctuating influent quality and changing discharge permits.
Geography Analysis
The South accounted for 36.10% of national revenue in 2025, primarily driven by Texas refineries, Louisiana's petrochemical complexes, and Florida’s expanding municipal grids. Texas alone accounts for the majority of the region’s consumption, thanks to its network of over 30 refineries and ethylene crackers that rely on continuous cooling-water treatment, boiler chemistry, and wastewater conditioning. Gulf Coast proximity to chlor-alkali plants lowers freight costs, delivering an advantage over Western counterparts.
The West is projected to post the fastest CAGR of 5.96% through 2031. California’s reuse rule requires every major industrial site to retrofit membrane trains with tailored antiscalants and oxidants. Semiconductor fabs in Arizona demand ultrapure chemicals certified to parts-per-trillion impurity thresholds. Data centers in Nevada and Utah add evaporative cooling towers that require low-phosphate, non-phosphonate antiscalants suitable for zero-liquid-discharge (ZLD) systems. High freight costs from Gulf Coast hubs are prompting distributors to establish satellite blending plants near Los Angeles and Phoenix, thereby improving lead times and reducing carbon footprints.
The Northeast captures PFAS-related funding faster than any other region, upgrading decades-old pipe networks. Short-haul distances between chemical makers in New Jersey and mid-Atlantic consumers hold freight economics in check.
Midwestern demand continues to grow at a stable pace. Agro-processing facilities buy commodity coagulants for corn wet-milling and ethanol plants, while historic steel towns gradually retrofit cooling systems. Logistics lanes radiating from Chicago support efficient railcar distribution, cushioning delivered costs despite distance from Gulf monomers.
Competitive Landscape
The United States water treatment chemicals market exhibits moderate fragmentation, yet consolidation momentum builds as compliance costs escalate. Digital integration emerges as a central battlefield. Market leaders bundle sensors, cloud dashboards, and chemicals under performance-guarantee contracts. Smaller formulators counter by specializing in high-temperature, high-salinity niches where bulk producers lack tailored SKUs. Patent filings rise for PFAS-selective adsorbents and low-halogen oxidants. Vendors with EPA-registered biocide lines and robust toxicology portfolios hold a barrier against new entrants because re-registration costs can top USD 3 million per active ingredient. Private-equity ownership climbs as platforms buy regional blenders to gain route density, then cross-sell premium polymers.
United States Water Treatment Chemicals Industry Leaders
Ecolab
Solenis
Kemira
Veolia
SNF
- *Disclaimer: Major Players sorted in no particular order

Recent Industry Developments
- April 2025: BASF SE launched Trilon G, a GLDA-based chelant with 56% renewable carbon content, marketed as a readily biodegradable alternative to EDTA for cleaning and softening duties.
- July 2024: BASF divested its Magnafloc and Rheomax mining flocculants portfolio to Solenis as part of a strategy to focus on flotation reagents and solvent-extraction aids.


United States Water Treatment Chemicals Market Report Scope
The United States water treatment chemicals market includes:
By Product Type
| Biocides and Disinfectants |
| Coagulants and Flocculants |
| Corrosion and Scale Inhibitors |
| Defoamers and Defoaming Agents |
| pH Adjusters and Softeners |
| Other Product Types |
By End-user Industry
| Power |
| Oil and Gas |
| Chemical Manufacturing |
| Mining and Mineral Processing |
| Municipal |
| Food and Beverage |
| Pulp and Paper |
| Other End-user Industries |
By Geography
| Northeast |
| Midwest |
| South |
| West |
| By Product Type | Biocides and Disinfectants |
| Coagulants and Flocculants | |
| Corrosion and Scale Inhibitors | |
| Defoamers and Defoaming Agents | |
| pH Adjusters and Softeners | |
| Other Product Types | |
| By End-user Industry | Power |
| Oil and Gas | |
| Chemical Manufacturing | |
| Mining and Mineral Processing | |
| Municipal | |
| Food and Beverage | |
| Pulp and Paper | |
| Other End-user Industries | |
| By Geography | Northeast |
| Midwest | |
| South | |
| West |


Key Questions Answered in the Report
What is the projected value of the United States Water Treatment Chemicals Market?
It is expected to reach USD 7.67 billion, supported by a 5.73% CAGR over 2026-2031 from USD 5.79 billion in 2026.
Which product category will post the strongest growth through 2031?
Biocides and disinfectants are expected to expand at a 6.08% CAGR due to increasing demands for tougher pathogen control and membrane biofouling mitigation.
What drives chemical sales to semiconductor fabs in Arizona?
Ultrapure water requirements for advanced lithography generate orders for high-purity acids, ion-exchange resins, and antiscalants certified to meet <1 ppb metal standards.
Why do municipalities remain the largest buyer group?
Continuous Safe Drinking Water Act compliance and large-scale pipe-replacement programs keep municipal utilities using sizable chemical volumes every day.
How do digital dosing systems affect chemical consumption?
Real-time sensor-linked feed pumps reduce overdosing by 15-25%, while also creating value-based contracts that reward suppliers for guaranteed performance rather than sheer volume.
Page last updated on:


