Moving Bed Bioreactor Market Size and Share
Market Overview
| Study Period | 2021 - 2031 |
|---|---|
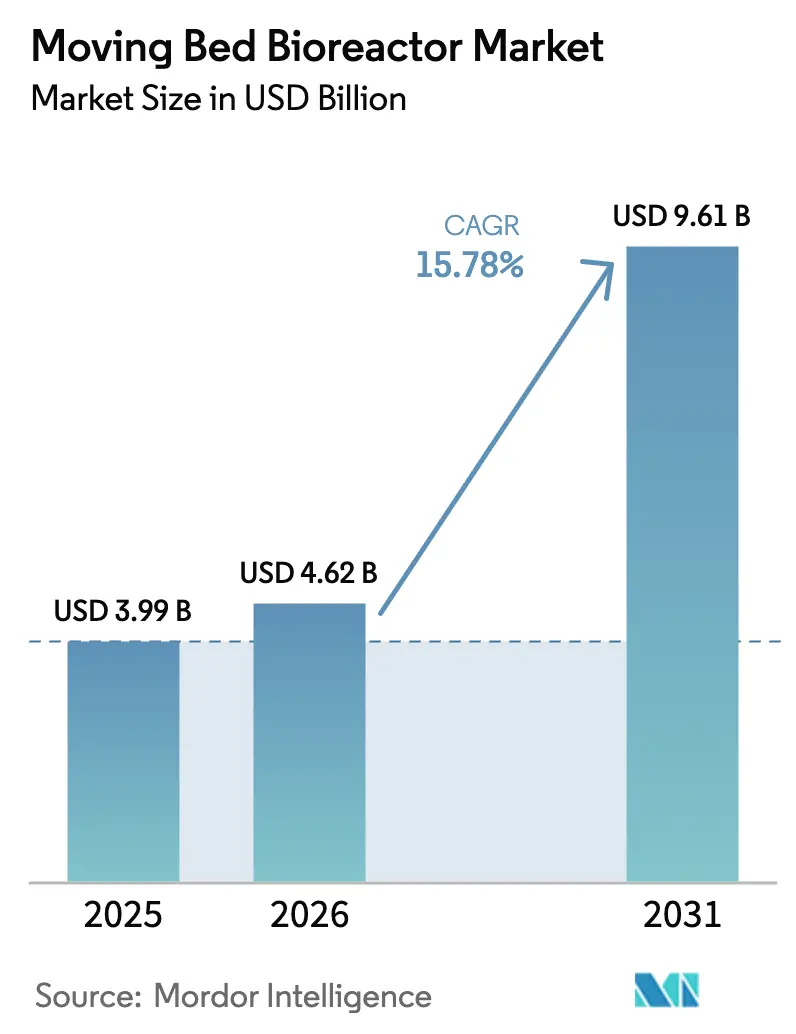
| Market Size (2026) | USD 4.62 Billion |
| Market Size (2031) | USD 9.61 Billion |
| Growth Rate (2026 - 2031) | 15.78% CAGR |
| Fastest Growing Market | Asia Pacific |
| Largest Market | Asia Pacific |
| Market Concentration | Medium |
Major Players *Disclaimer: Major Players sorted in no particular order Image © Mordor Intelligence. Reuse requires attribution under CC BY 4.0. | |
Moving Bed Bioreactor Market Analysis by Mordor Intelligence
The Moving Bed Bioreactor Market size is expected to increase from USD 3.99 billion in 2025 to USD 4.62 billion in 2026 and reach USD 9.61 billion by 2031, growing at a CAGR of 15.78% over 2026-2031. Growing pressure on utilities to meet tighter nutrient-discharge limits while keeping energy budgets flat is shifting capital toward compact biofilm solutions that retrofit existing tanks without expanding plant footprints. Municipalities in dense urban zones, where land acquisition can out-price equipment, are adopting carriers that supply more than 500 m² of surface area per m³, enabling secondary upgrades inside the walls of 1970s-era basins. Industrial processors are also accelerating adoption because non-compliance fines for biochemical oxygen demand (BOD) and chemical oxygen demand (COD) can exceed USD 50,000 per day, dwarfing the operating cost delta between MBBR and conventional sludge lines. Asia-Pacific set the growth pace in 2025, buoyed by China’s multi-trillion-dollar wastewater build-out and India’s river-rejuvenation mandates that favor plug-and-play biology over civil construction.
Key Report Takeaways
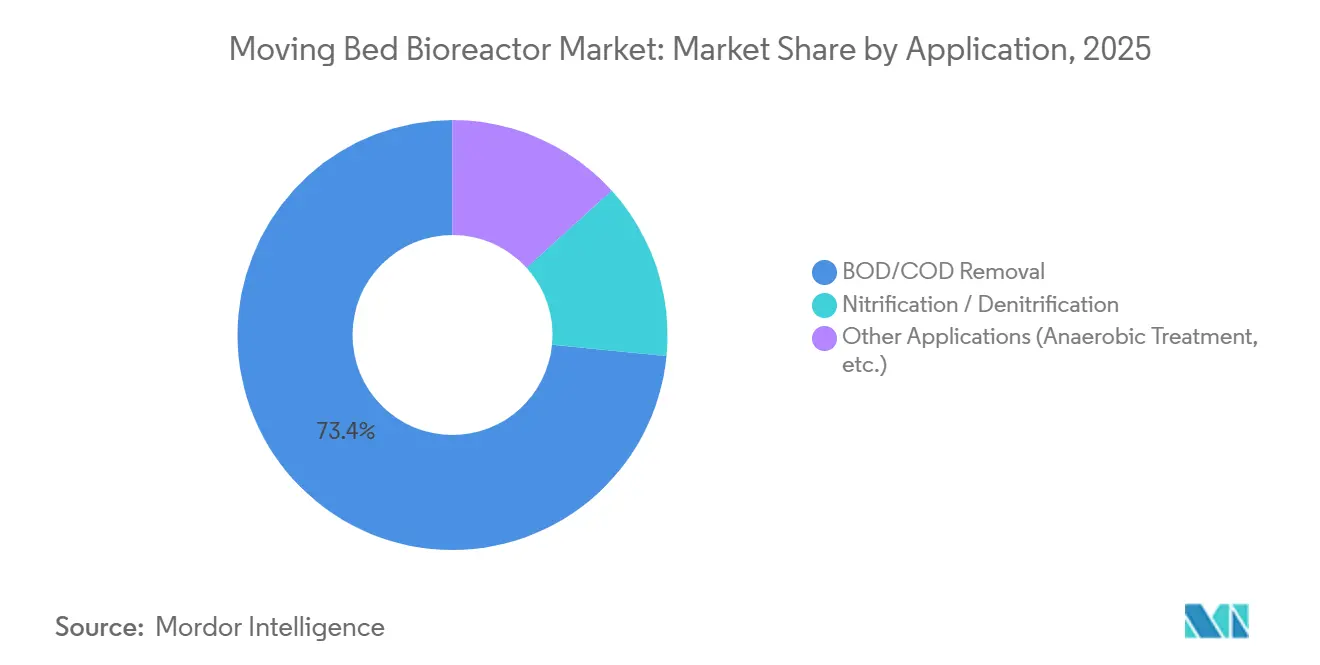
- By application, BOD/COD removal led with 73.44% of the Moving Bed Bioreactor market share in 2025 and is forecast to grow at a 15.87% CAGR through 2031.
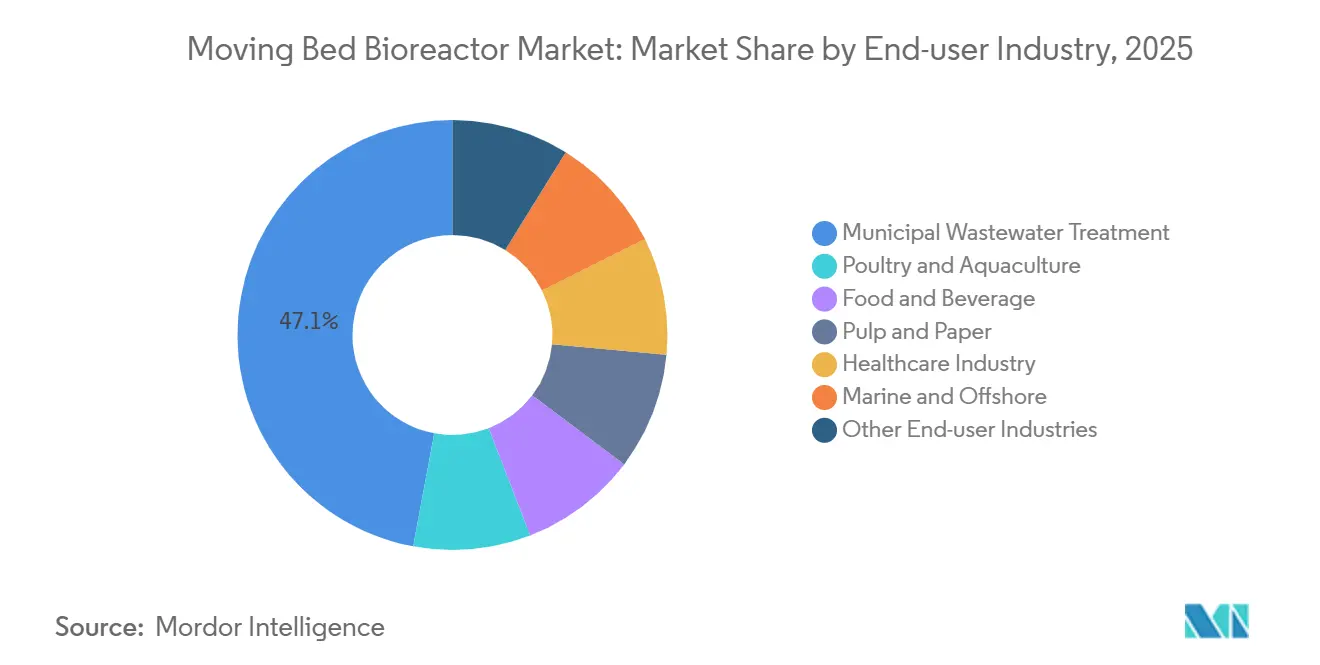
- By end-user industry, municipal wastewater treatment accounted for 47.06% of revenue in 2025, while poultry and aquaculture are expected to post the fastest 15.81% CAGR to 2031.
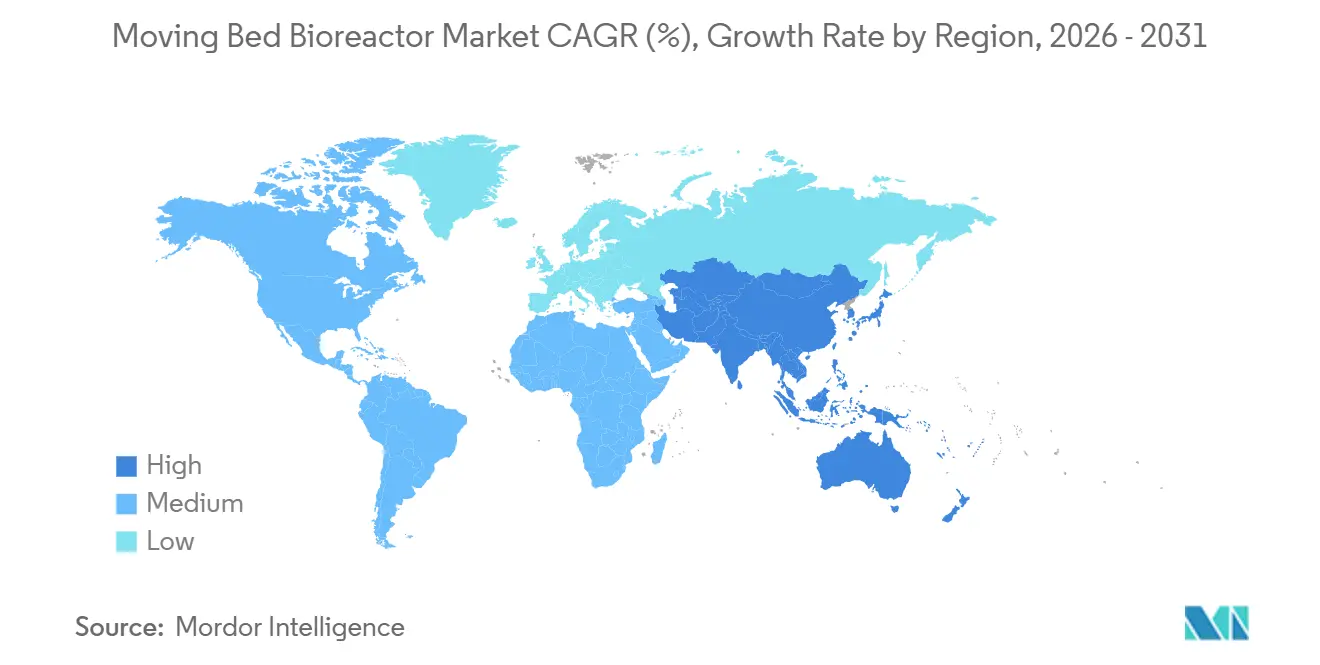
- By geography, Asia-Pacific captured 30.04% share in 2025 and is projected to expand at an 18.04% CAGR, outpacing all other regions.
Note: Market size and forecast figures in this report are generated using Mordor Intelligence’s proprietary estimation framework, updated with the latest available data and insights as of January 2026.
Global Moving Bed Bioreactor Market Trends and Insights
Drivers Impact Analysis*
| Driver | (~) % Impact on CAGR Forecast | Geographic Relevance | Impact Timeline |
|---|---|---|---|
| Scarcity of Freshwater Resources in Water-Stressed Regions | +3.2% | APAC core, Middle East, North Africa, spill-over to Mediterranean Europe | Long term (≥ 4 years) |
| Stringent Global and Regional Wastewater-Discharge Regulations | +4.1% | Global, with peak enforcement in EU, North America, China | Medium term (2-4 years) |
| Integration with Anaerobic Digestion for Energy-Positive Plants | +2.8% | North America, Europe, early pilots in Brazil and South Africa | Long term (≥ 4 years) |
| Integration With Anaerobic Digestion for Energy-Positive Plants | +2.8% | North America, Europe, early pilots in Brazil and South Africa | Long term (≥ 4 years) |
| Uptake in Decentralized Containerized Treatment for Remote Sites | +3.4% | APAC (mining corridors in Australia, Indonesia), Middle East (oil & gas camps), Sub-Saharan Africa | Short term (≤ 2 years) |
| Source: Mordor Intelligence | |||
Scarcity of Freshwater Resources in Water-Stressed Regions
More than 2.3 billion people live in basins where renewable supply falls below 500 m³ per capita, forcing municipalities to view treated wastewater as a strategic water source[1]United Nations, “World Water Development Report 2025,” un.org . Carriers that achieve BOD below 5 mg/L without tertiary clarifiers cut pre-reverse-osmosis conditioning steps, trimming membrane replacement costs by up to 40%. India’s Jal Jeevan Mission piloted 12 rural MBBR gray-water modules in Rajasthan and Gujarat in 2025 to offset wells that now sit 300 m below grade, where diesel extraction costs top USD 0.80 per m³. Singapore’s NEWater program has relied on biofilm pre-conditioning since 2024, sustaining membrane flux above 60 L m⁻² h⁻¹ in tropical feedwater. In regions where desalination averages USD 0.50 per m³, MBBR-polished effluent can be delivered for USD 0.20 – 0.35 per m³, creating a tangible price spread for utility bond prospectuses.
Stringent Global and Regional Wastewater-Discharge Regulations
The European Union lowered total nitrogen limits from 10 mg/L to 6 mg/L for agglomerations above 10,000 PE in January 2025, affecting 4,200 plants that cannot meet targets with conventional activated sludge alone. China’s Class 1A standard now caps ammonia-nitrogen at 1.5 mg/L in the Yangtze Economic Belt, with automatic suspension of industrial discharge permits for municipal laggards. The U.S. EPA set a seasonal 0.07 mg/L phosphorus threshold in the Great Lakes basin in 2025, steering retrofit budgets toward biofilm nitrifiers that avoid alum sludge haul-off. India’s bathing-water rules require fecal coliform under 100 MPN per 100 mL; field data from 14 MBBR pilots showed log-3 pathogen reduction without chlorination, eliminating disinfection-by-product risks. Multilateral lenders have begun referencing ISO 24511 process-resilience metrics in tender documents, effectively making shock-load-tolerant platforms a prerequisite for funding.
Rising Industrial Wastewater Volumes from Pulp and Paper Industry
U.S. mills discharged 4.1 billion m³ of process water in 2025, 68% of which required biological polishing before river discharge. MBBR’s bio-mass density of 12 g VSS L⁻¹ compresses hydraulic retention time to 6 hours, allowing mills to treat kraft liquors within existing clarifiers. Nordic facilities integrate anaerobic pre-treatment to harvest methane, as demonstrated at Stora Enso’s Oulu mill, which generated 2.3 MW of onsite power in 2025. Indonesia and Vietnam adopted portable containerized skids that avoid stranded assets as concessions shift wood-supply zones. Recycled-fiber mills in North America, which processed 38 million t of recovered paper in 2025, now retrofit MBBR to protect ultrafiltration lines from fiber fines.
Integration With Anaerobic Digestion for Energy-Positive Plants
The Water Environment Federation counted 47 net-zero U.S. plants in 2025, each pairing anaerobic MBBR with CHP to export power at USD 0.08 – 0.12 kWh⁻¹. Biofilm carriers colonized by methanogens convert 0.30 – 0.35 m³ CH₄ kg⁻¹ COD removed, outperforming conventional digesters by up to 15%. DC Water’s Blue Plains complex now covers 33% of its electrical load through a 12-MW MBBR digest line and saves USD 8.2 million annually in avoided sludge hauling. EU transport directives double-count wastewater-derived biogas toward renewable targets, creating a monetizable credit stream that cuts MBBR payback to 7 – 9 years. Brazil’s sugar-cane ethanol belt began stacking carbon credits on methane capture at vinasse plants, with Raízen verifying 14,000 t CO₂e offsets in 2025.
Restraints Impact Analysis*
| Restraint | (~) % Impact on CAGR Forecast | Geographic Relevance | Impact Timeline |
|---|---|---|---|
| High Upfront Capital Expenditure for Full-Scale Installations | -2.1% | Global, acute in South America, Sub-Saharan Africa, Southeast Asia | Short term (≤ 2 years) |
| Biofilm Carrier Fouling and Maintenance Complexity | -1.4% | Global, with higher impact in industrial applications (food & beverage, pulp & paper) | Medium term (2-4 years) |
| Shortage of Skilled Operators for Biofilm-Based Processes | -1.6% | APAC (excluding Japan, South Korea), Middle East, Sub-Saharan Africa, rural North America | Medium term (2-4 years) |
| Source: Mordor Intelligence | |||
High Upfront Capital Expenditure for Full-Scale Installations
Greenfield 50,000-PE plants price out at USD 8 – 15 million, a 25 – 40% premium to conventional sludge lines once carriers, fine-bubble blowers, and retention screens are specified. Emerging-market bond caps of 3 – 5% of annual utility budgets delay procurement, leaving municipalities liable for interim discharge penalties. Brazil’s sanitation plan shows 47% of sub-100 k municipalities lack concessional funding for nutrient removal, stalling 23 Amazon basin projects despite total nitrogen limits of 5 mg/L. In Sub-Saharan Africa, capital intensity of USD 600 – 900 m⁻³ dwarfs the USD 300 – 450 m⁻³ cost of waste-stabilization ponds even though ponds demand 50-fold more land[2]African Development Bank, “Water Infrastructure Finance Outlook 2025,” afdb.org. Blended-finance models are emerging - Kenya’s Lake Victoria South Water Board closed a USD 42 million deal in 2025 under a 60/40 public-private split, but currency hedges add 120-180 bps to debt service, limiting replication.
Bio-Film Carrier Fouling and Maintenance Complexity
Water Research Foundation audits found 41% of 62 plants suffered mineral scaling that cut nitrification rates below design, forcing blowers 15-25% above spec and adding USD 12,000 – 18,000 in annual power per MGD. Dairy plants see grease-mediated sloughing that clogs retention screens, with one Wisconsin site logging 340 labor-hours per year on acid washes. Pulp mills experience lignin crusting that resists chemical clean-in-place; Weyerhaeuser replaced 30% of carriers at its Longview mill for USD 280,000 in 2025. Predictive fouling analytics, such as Xylem’s BioCarrier Platform launched in 2025, use turbidity sensors to forecast scaling 60–90 days ahead, cutting unscheduled downtime by 40% yet adding USD 8,000 – 12,000 annual subscription cost. Plants below 5 MGD often forgo such software, absorbing unplanned maintenance hits that erode OPEX savings.
*Our forecasts treat driver/restraint impacts as directional, not additive. The impact forecasts reflect baseline growth, mix effects, and variable interactions.
Segment Analysis
By Application: Organic Load Drives Three-Quarters of Demand
BOD/COD removal commanded 73.44% of the Moving Bed Bioreactor market size in 2025 and will retain momentum with a 15.87% CAGR through 2031. High-strength effluent from breweries, distilleries, and dairy plants, often exceeding 1,000 mg/L BOD, can be polished in 4 – 8 h hydraulic retention times, compared with 18 – 24 h for legacy sludge lines, unlocking surcharge relief that pays back capital in three to five years. Hybrid chemistries that couple carriers with ultrafiltration now meet direct potable reuse specifications, evident in California’s 130 MGD Groundwater Replenishment System upgrade that cut membrane change-outs by three years.
The nitrification/denitrification niche is widening as coastal permits drop total nitrogen below 3 mg/L, illustrated by 18 Chesapeake Bay plants that installed MBBR modules in 2025 to avoid USD 1.2 billion in clarifier construction. Anaerobic variants remain under 10% share yet are pulling attention from food and beverage processors monetizing captured methane; Danone’s 1,200 m³ d⁻¹ whey system in Argentina offsets 420 kW of grid power, demonstrating biogas value stacking. Across applications, the Moving Bed Bioreactor market presents a resilient pathway for utilities balancing load shocks, energy intensity, and land scarcity.


By End-User Industry: Aquaculture Outpaces Municipal Growth
Municipal wastewater treatment delivered 47.06% of Moving Bed Bioreactor market share in 2025, reflecting retrofit volume across North America and Europe where nutrient caps target legacy plants built before 1980. Yet aquaculture and poultry are forecast for the fastest 15.81% CAGR, powered by recirculating aquaculture systems (RAS) that demand ammonia below 0.5 mg/L to protect gill health. Norway issued 22 land-based salmon permits in 2025, each requiring biofilters processing up to 2 kg feed m⁻³ d⁻¹; MBBR’s nitrification rates of 0.8 – 1.2 g N m⁻² d⁻¹ enable stocking densities above 80 kg m⁻³, doubling flow-through yields.
In China, shrimp farmers pivoted from ponds to indoor RAS to curb white-spot virus, installing 500 – 1,000 m³ d⁻¹ lines in Guangdong and Fujian where land tops USD 200,000 ha⁻¹. Food & beverage processors now integrate MBBR to remove 1,800 mg/L BOD at breweries like Anheuser-Busch’s Baldwinsville facility, slicing sewer surcharges by USD 2.1 million per year. Marine and offshore units command premium pricing—USD 800,000 – 1.2 million per container—because corrosion-resistant alloys and explosion-proof drives are standard. Healthcare outlets are piloting extended-retention carriers that co‐metabolize pharmaceutical residues, posting 60 – 75% atenolol and sulfamethoxazole removal in German field tests.
Geography Analysis
Asia-Pacific owned 30.04% of the Moving Bed Bioreactor market share in 2025 and is tracking an 18.04% CAGR through 2031, buoyed by China’s CNY 240 billion county-sewage fund and India’s Namami Gange awards for 1,240 MLD capacity. ASEAN industrial corridors, where effluent grew 11% in 2025, installed centralized biofilm hubs; Vietnam’s Dong Nai province alone commissioned 85,000 m³ d⁻¹ of dye effluent capacity to protect drinking intakes downstream.
North America continues a retrofit-heavy cycle as 40% of its 14,780 plants pre-date 1980; Milwaukee’s Jones Island saved USD 180 million by choosing a 60 MGD MBBR line over new clarifiers and hit a 0.06 mg/L P effluent in 2025. Canada’s regulations drive containerized adoption in remote Arctic towns; Nunavut installed five skid units sized for 800 – 2,000 residents, discharging safely into marine waters under ice cover. Mexico’s border cities tapped federal grants for 18 units to cut cross-border BOD to 30 mg/L, meeting binational treaties with the United States.
Europe’s circular-economy playbook prioritizes nutrient recovery; 47 Bavarian plants coupled MBBR with struvite reactors in 2025, selling 8,200 t fertilizer at EUR 450 – 600 t⁻¹, offsetting 12 – 18% of OPEX. Nordic plants integrate heat pumps that pulled 180 GWh from effluent in Stockholm in 2025, lowering natural-gas imports by 18 million m³. South America leans on biofilm digesters at Brazil’s sugar mills, where 12 units displaced 34,000 MWh of grid electricity in 2025. Middle Eastern oil fields deploy containerized skids; Saudi Aramco’s Shaybah field polished 4,200 m³ d⁻¹ for aquifer reinjection, ending USD 12 per m³ freshwater trucking costs.

Competitive Landscape
The top five vendors - Veolia, Xylem, Genesis Water Solutions, World Water Works, and Headworks International - controlled roughly 56% of 2025 revenue, giving the Moving Bed Bioreactor market a moderate concentration profile. Carrier patent portfolios remain the major moat; Veolia’s 2021 acquisition of AnoxKaldnes fused K-series and Z-series media under one umbrella, while low-cost Chinese carriers now claim 800 m² m⁻³ surface area though long-term fouling data are still thin. Xylem’s 2025 launch of pre-colonized nitrifier carriers cut commissioning from eight to three weeks, resonating with utilities facing USD 25,000 day⁻¹ consent-decree fines.
Digital twins are the new battleground. Fluence’s NIROBOX MABR suite uses zone-based dissolved-oxygen feedback to trim blowers 40%, winning Singapore’s Tuas Nexus contract as the world’s largest integrated reclamation plant due in 2027. ISO 24519, published in 2024, now standardizes carrier surface-area testing, leveling procurement specs and pushing smaller firms to validate metrics through certified labs. Extreme-climate specialists like Biowater Technology field heat-channel carriers that avoid biofilm freezing at -15 °C, securing Greenland and northern Canada contracts where heated buildings are cost-prohibitive.
Moving Bed Bioreactor Industry Leaders
Veolia
Genesis Water Solution Pvt. Ltd.
Xylem
Headworks International
World Water Works
- *Disclaimer: Major Players sorted in no particular order

Recent Industry Developments
- September 2025: Blue Lagoon Resources Inc. announced the commissioning of the Moving Bed Bioreactor (MBBR) system at its Dome Mountain Water Treatment Plant. The MBBR system was part of the Dome Mountain Water Treatment Plant, designed to treat up to 400 liters per minute (L/min).
- April 2025: SUSBIO launched SUSBIO ECOTREAT, a packaged MBBR-based sewage treatment plant in India. SUSBIO ECOTREAT is suitable for residential buildings, hotels, hospitals, commercial complexes, and small industrial units.


Global Moving Bed Bioreactor Market Report Scope
A Moving Bed Bioreactor (MBBR) is a biological wastewater treatment process that uses free-floating plastic carriers (media) within an aeration tank to support the growth of specialized bacteria. It is widely recognized as a standard technology for municipal and industrial wastewater treatment due to its compact design and high efficiency.
The moving bed bioreactor market is segmented by application, end-user industry, and geography. By application, the market is segmented into BOD/COD removal, nitrification/denitrification, and other applications (e.g., anaerobic treatment). By end-user industry, the market is segmented into municipal wastewater treatment, poultry and aquaculture, food and beverage, pulp and paper, healthcare industry, marine and offshore, and other end-user industries (e.g., chemical and petrochemical, textile and dyeing). The report also covers the market size and forecasts for moving bed bioreactor in 16 countries across major regions. For each segment, the market sizing and forecasts have been done on the basis of value (USD).
| BOD/COD Removal |
| Nitrification / Denitrification |
| Other Applications (Anaerobic Treatment, etc.) |
| Municipal Wastewater Treatment |
| Poultry and Aquaculture |
| Food and Beverage |
| Pulp and Paper |
| Healthcare Industry |
| Marine and Offshore |
| Other End- user Industries (Chemical and Petrochemical, Textile and Dyeing, etc.) |
| Asia-Pacific | China |
| India | |
| Japan | |
| South Korea | |
| ASEAN Countries | |
| Rest of Asia-Pacific | |
| North America | United States |
| Canada | |
| Mexico | |
| Europe | Germany |
| United Kingdom | |
| France | |
| Italy | |
| Spain | |
| NORDIC Countries | |
| Rest of Europe | |
| South America | Brazil |
| Argentina | |
| Rest of South America | |
| Middle East and Africa | Saudi Arabia |
| South Africa | |
| Rest of Middle East and Africa |
| By Application | BOD/COD Removal | |
| Nitrification / Denitrification | ||
| Other Applications (Anaerobic Treatment, etc.) | ||
| By End-user Industry | Municipal Wastewater Treatment | |
| Poultry and Aquaculture | ||
| Food and Beverage | ||
| Pulp and Paper | ||
| Healthcare Industry | ||
| Marine and Offshore | ||
| Other End- user Industries (Chemical and Petrochemical, Textile and Dyeing, etc.) | ||
| By Geography | Asia-Pacific | China |
| India | ||
| Japan | ||
| South Korea | ||
| ASEAN Countries | ||
| Rest of Asia-Pacific | ||
| North America | United States | |
| Canada | ||
| Mexico | ||
| Europe | Germany | |
| United Kingdom | ||
| France | ||
| Italy | ||
| Spain | ||
| NORDIC Countries | ||
| Rest of Europe | ||
| South America | Brazil | |
| Argentina | ||
| Rest of South America | ||
| Middle East and Africa | Saudi Arabia | |
| South Africa | ||
| Rest of Middle East and Africa | ||


Key Questions Answered in the Report
What is the size of the Moving Bed Bioreactor market?
The Moving Bed Bioreactor market size stands at USD 4.62 billion in 2026 and is forecast to advance at a 15.78% CAGR, reaching USD 9.61 billion by 2031.
Which application holds the largest revenue share?
BOD/COD removal leads with 73.44% of 2025 revenue and retains momentum through 2031.
Which end-user segment is expanding the quickest?
Poultry and aquaculture installations are projected for a 15.81% CAGR during 2026-2031.
Why is Asia-Pacific the fastest-growing region?
Massive public spending in China and India, coupled with industrial expansions across ASEAN, drives an 18.04% regional CAGR.
Page last updated on:


