
Market Overview
| Study Period | 2021 - 2031 |
|---|---|
| Market Size (2026) | USD 255.49 Billion |
| Market Size (2031) | USD 334.05 Billion |
| Growth Rate (2026 - 2031) | 5.51 % |
| Fastest Growing Market | Europe |
| Largest Market | Asia Pacific |
| Market Concentration | Medium |
Major Players
*Disclaimer: Major Players sorted in no particular order Image © Mordor Intelligence. Reuse requires attribution under CC BY 4.0. |
|
Fruit And Vegetable Ingredients Market Analysis by Mordor Intelligence
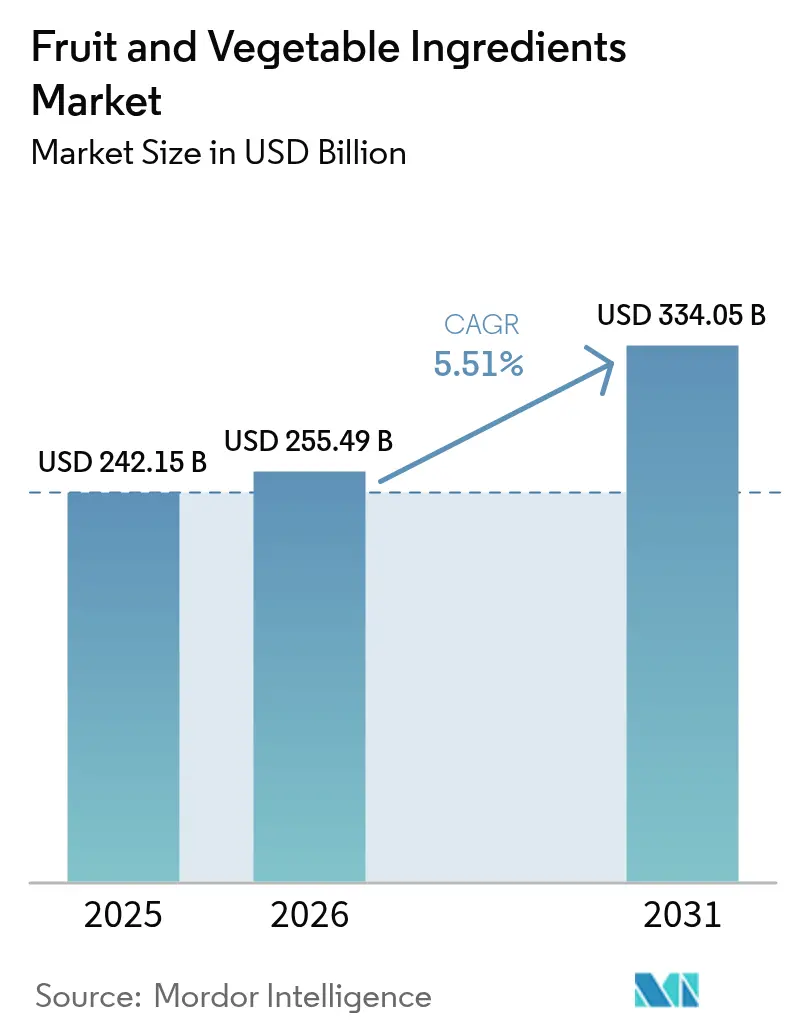
The fruit and vegetable ingredients market size was valued at USD 242.15 billion in 2025 and estimated to grow from USD 255.49 billion in 2026 to reach USD 334.05 billion by 2031, at a CAGR of 5.51% during the forecast period (2026-2031). The market growth is driven by increasing demand for clean-label products, natural preservation methods, and functional nutrition, which has enhanced the importance of fruit and vegetable concentrates, powders, and extracts in food processing. Global food manufacturers are reformulating their existing products to remove synthetic additives, while regional processors implement high-pressure processing (HPP) and cold-press extraction techniques to extend product shelf life while maintaining nutritional value. The increasing costs of synthetic sweeteners and colorants, combined with stricter labeling regulations, are pushing manufacturers toward natural alternatives. Additionally, circular-economy initiatives in key markets encourage the conversion of by-products into valuable ingredients, improving supply chain stability and reducing costs. These factors establish a stable demand foundation in the fruit and vegetable ingredients market, supporting growth for both ingredient suppliers and finished-goods manufacturers.
Key Report Takeaways
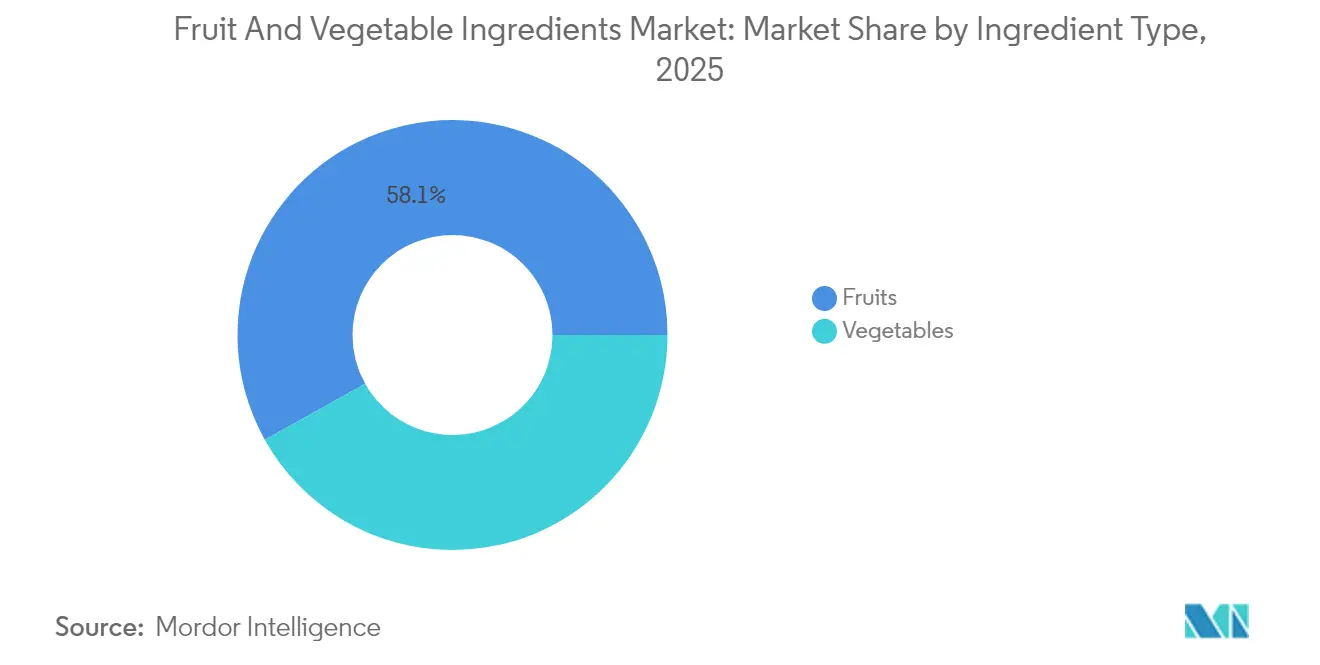
- By ingredient type, fruits led with 58.10% of the 2025 fruit and vegetable ingredients market share, while vegetables are forecast to expand at a 7.59% CAGR between 2026-2031.
- By form, concentrates commanded a 35.02% share of the 2025 fruit and vegetable ingredients market size, whereas powders are projected to grow fastest at 8.45% CAGR between 2026-2031.
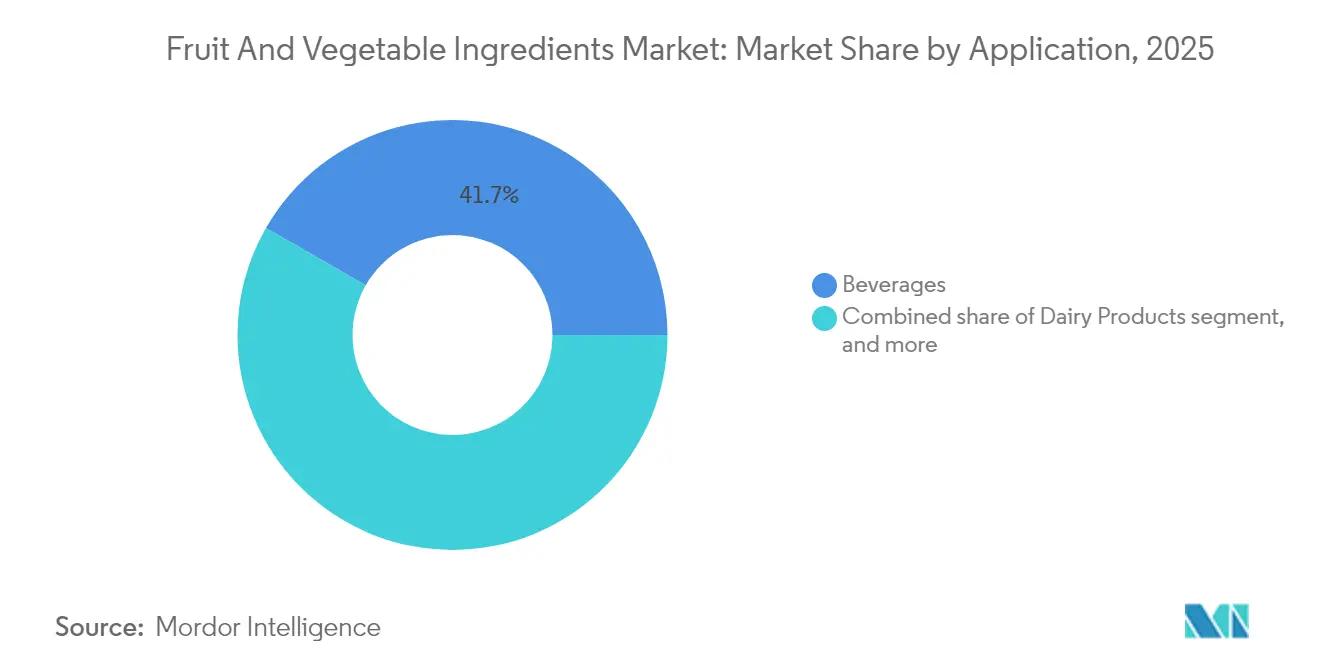
- By application, beverages dominated with 41.72% revenue share in 2025; dairy products registered the highest forecast CAGR at 7.29% through 2031.
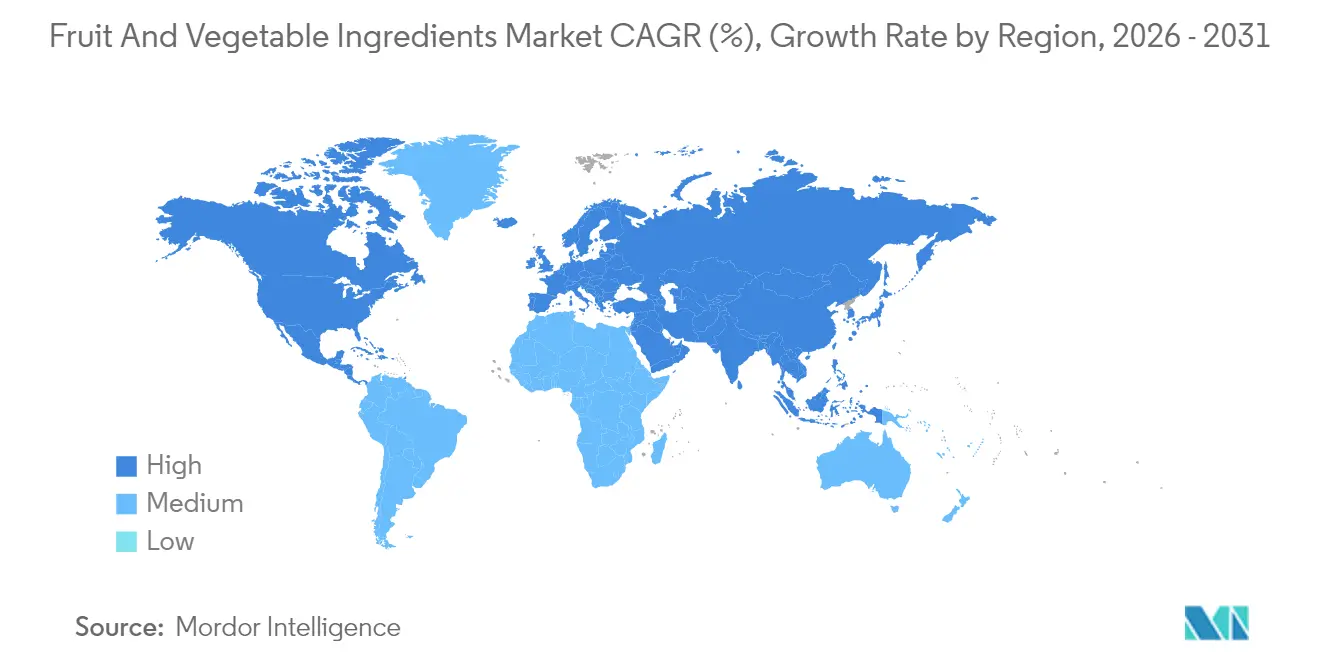
- By geography, Europe accounted for 32.30% of global value in 2025, but Asia-Pacific is set to record the quickest expansion at 7.96% CAGR through 2031.
Note: Market size and forecast figures in this report are generated using Mordor Intelligence’s proprietary estimation framework, updated with the latest available data and insights as of 2026.
Market Trends and Insights
Drivers Impact Analysis of Fruit And Vegetable Ingredients Market*
| Driver | (~) % Impact on CAGR Forecast | Geographic Relevance | Impact Timeline |
|---|---|---|---|
| Rising demand for clean-label and natural ingredients in packaged foods | +1.5% | Global, with the strongest adoption in North America and Europe | Medium term (2-4 years) |
| Growing adoption of fruit-based sugar-replacers by beverage formulators | +0.8% | Global, led by Asia-Pacific and North America | Short term (≤ 2 years) |
| Functional-food launches featuring "super-fruit" phytonutrients | +1.2% | North America and Europe core, expanding to Asia-Pacific | Medium term (2-4 years) |
| Growth of plant-based and vegan foods | +0.9% | Global, with premium adoption in developed markets | Long term (≥ 4 years) |
| Upcycling of fruit and vegetable side-streams into value-added powders | +0.7% | Europe and North America leading, emerging in Asia-Pacific | Long term (≥ 4 years) |
| Expansion of cold-press and HPP capabilities improving ingredient shelf-life | +0.6% | Global, with technology concentration in developed markets | Short term (≤ 2 years) |
| Source: Mordor Intelligence | |||
Rising Clean-Label Demand Reshapes Formulation Strategies
Consumer demand for ingredient transparency has significantly influenced product formulation decisions, with clean-label products achieving higher price points across food categories. The FDA's revised guidelines for natural flavoring classifications have established defined regulatory frameworks for fruit and vegetable-derived ingredients, reducing compliance complexities for manufacturers. According to the International Food Information Council 2024 Report, 36% of U.S. consumers indicated that natural or clean labeling enhances their perception of product safety, demonstrating the direct impact of clean-label positioning on consumer trust and purchasing decisions[1]Source: International Food Information Council, "2024 IFIC Food & Health SURVEY," https://ific.org/wp-content/uploads/2024/06/2024-IFIC-Food-Health-Survey.pdf. In European markets, manufacturers report that consumers accept 15-20% price premiums for clean-label products, particularly in premium bakery and confectionery items. This preference has expanded beyond developed markets into emerging economies, where growing middle-class populations increasingly value ingredient transparency. In response, major food manufacturers have modified their existing product formulations, generating consistent demand for natural fruit and vegetable ingredients over synthetic options.
Functional Food Innovation Drives Super-Fruit Integration
The integration of nutrition science and food technology has transformed certain fruits from basic ingredients into functional components with proven health benefits. Elderberry, acai, and tart cherry ingredients now sell at 3-4 times the price of conventional fruit ingredients, primarily due to their antioxidant content and immune system benefits. Glanbia Nutritionals report indicates that 72% of consumers preferred functional beverages with health benefits, while 44% actively seeked products containing natural ingredients in 2023/24[2]Source: Glanbia Nutritionals, "Functional Beverages to Support Wellbeing," https://www.glanbianutritionals.com/en/nutri-knowledge-center/insights/functional-beverages-support-wellbeing. This consumer demand for both effectiveness and ingredient transparency has established super-fruits as essential components in the functional food and beverage industry. Food manufacturers are increasingly incorporating fruit-derived powders, purees, and concentrates into nutraceuticals, sports nutrition products, and functional beverages to support claims of immune health, recovery, and wellness. The widespread integration of super-fruits has extended beyond premium products into mainstream items such as yogurts, energy bars, and fortified snacks, demonstrating a significant transformation from specialized products to broader market adoption across everyday nutrition categories.
Plant-Based Food Expansion Creates New Application Opportunities
The plant-based food market has expanded beyond meat alternatives to include fruit and vegetable ingredients in dairy alternatives and processed foods. Proteins and fibers extracted from vegetables provide essential nutritional benefits, including amino acids and dietary fiber, while simultaneously functioning as texture modifiers in plant-based products. Current regulations in major markets actively support plant-based ingredients, particularly exemplified by the EU's Farm to Fork strategy, which aims to reduce synthetic additive usage through comprehensive policy frameworks and incentives. The market continues to show increasing demand for specialized fruit and vegetable ingredients that can effectively mimic the taste, texture, and functional properties of dairy and meat products while adhering to clean-label requirements and consumer preferences for natural ingredients.
Technology-Enabled Upcycling Transforms Waste Streams
The adoption of advanced processing technologies enables the conversion of fruit and vegetable byproducts into valuable ingredients, generating additional revenue while improving sustainability. These technologies include enzymatic treatments, fermentation processes, and specialized extraction methods that break down complex plant materials into usable components. The process involves multiple stages, from initial sorting and cleaning to precise mechanical separation and biochemical conversion. The European Union's Circular Economy Action Plan offers regulatory framework and financial support for upcycling projects, particularly focusing on food waste reduction through targeted initiatives and compliance requirements[3]Source: European Commission, "Circular Economy Action Plan", https://environment.ec.europa.eu/strategy/circular-economy-action-plan_en. The plan encompasses specific guidelines for waste hierarchy implementation, monitoring mechanisms, and financial incentives for businesses adopting circular practices. Companies such as Floura & Co demonstrate the economic benefits of converting fruit peels into functional flours through innovative processing techniques, reducing costs by 40-50% compared to traditional ingredients while preserving nutritional value.
Restraints Impact Analysis of Fruit And Vegetable Ingredients Market*
| Restraint | (~) % Impact on CAGR Forecast | Geographic Relevance | Impact Timeline |
|---|---|---|---|
| Competition from synthetic substitutes | -0.4% | Global, with cost sensitivity highest in emerging markets | Short term (≤ 2 years) |
| Supply-chain volatility for exotic fruits | -0.6% | Global, with highest impact on premium segments | Medium term (2-4 years) |
| Short shelf life and stability challenges | -0.3% | Global, particularly affecting developing market distribution | Short term (≤ 2 years) |
| High CAPEX for aseptic and freeze-drying lines | -0.5% | Emerging markets primarily, with limited access to capital | Long term (≥ 4 years) |
| Source: Mordor Intelligence | |||
Supply Chain Volatility Constrains Premium Segment Growth
Exotic fruits including acai, dragon fruit, passion fruit, and mangosteen serve as high-value ingredients in functional beverages, supplements, and premium snacks. However, their supply chains face significant vulnerabilities. These fruits primarily grow in specific regions of Latin America, Southeast Asia, and Africa, where dependence on smallholder farmers, fragmented supply networks, and limited infrastructure increases disruption risks. The seasonal nature of harvests and the fruits' perishability create additional challenges for consistent year-round supply. The impact of climate change, manifesting through increased occurrences of droughts, floods, and hurricanes, threatens harvest yields and export volumes. Supply chain constraints, including port congestion and insufficient cold-chain infrastructure in production regions, compound these challenges. These factors, combined with increasing freight costs and trade-related geopolitical tensions, result in unstable pricing and irregular supply patterns.
Short shelf life and stability challenges
The perishable nature of fruit and vegetable ingredients creates significant challenges throughout the manufacturing value chain. Fresh and minimally processed forms, including purees, juices, and refrigerated concentrates, require strict cold-chain management and have limited shelf life. Processed formats such as powders and freeze-dried ingredients face issues with moisture sensitivity, flavor degradation, and nutrient loss during storage and transportation. Specifically, vitamin C and antioxidant compounds in fruit-based ingredients degrade when exposed to oxygen, light, or heat, reducing their functional and nutritional benefits. These stability issues complicate formulation, packaging, and distribution processes, increasing manufacturing costs. Food and beverage companies using fruit and vegetable ingredients for functional products risk inconsistent sensory profiles and reduced efficacy, which affects consumer trust. The challenge intensifies for clean-label products, where manufacturers cannot use synthetic preservatives or stabilizers to extend shelf life.
*Our forecasts treat driver/restraint impacts as directional, not additive. The impact forecasts reflect baseline growth, mix effects, and variable interactions.
Fruit And Vegetable Ingredients Market Segment Analysis
By Ingredient Type:
Vegetables Outpace Traditional Fruit DominanceThe vegetable ingredients segment is projected to grow at 7.59% CAGR through 2031, emerging as the fastest-growing category, while fruits maintain a dominant 58.10% market share in 2025. The growth in vegetable ingredients stems from increased use in plant-based proteins and functional foods, particularly carrot and beetroot powders in natural coloring applications. Root vegetables demonstrate strong growth potential due to their natural sweetness and color properties, while tomato-based ingredients remain stable in sauce and soup applications. Mango, kiwi, and tropical berries maintain premium price points but experience limited volume growth due to supply chain limitations.
Apple and orange ingredients dominate fruit volumes due to reliable supply chains and consistent availability, though their growth remains moderate in the mature market. The berry segment, including strawberries, raspberries, and blueberries, exhibits robust growth based on antioxidant content and premium product applications. Pineapple ingredients compete with lower-cost synthetic alternatives, while banana ingredients find steady demand in sports nutrition products due to their potassium content. Vegetable ingredients from zucchini, butternut squash, and pumpkin show increased adoption in gluten-free and paleo products, supported by their clean-label status.



By Form:
Powder Innovation Drives Processing EvolutionPowders represent the fastest-growing form segment with an 8.45% CAGR, while concentrates hold 35.02% market share in 2025. Powders offer advantages in shelf-life and transportation efficiency. The adoption of spray-drying and freeze-drying technologies enables powder production that preserves heat-sensitive nutrients and volatile compounds, overcoming traditional processing limitations. The powder segment experiences increased demand in dry-mix applications, dietary supplements, and instant food products where reconstitution capabilities are essential. Regulatory requirements favor powder forms due to lower preservative needs and longer shelf life.
Concentrates retain market leadership through their established position in beverage manufacturing and cost efficiency in high-volume production, despite slower growth rates. Pastes and purees fulfill specific needs in baby food and premium sauce production, where texture qualities are essential. Pieces and slices serve distinct applications in breakfast cereals, snack bars, and products featuring visible fruit components. The "Others" category, comprising not-from-concentrate juices and specialized extracts, meets specific requirements in pharmaceutical and nutraceutical applications that demand standardized active compound levels.
By Application:
Dairy Products Surge Past Traditional Beverage LeadershipDairy products represent the fastest-growing application segment with a 7.29% CAGR, driven by premium product development and functional benefits. Beverages retain the largest market share at 41.72% in 2025. The dairy segment's expansion stems from increased use of fruit and vegetable ingredients in yogurt, cheese, and milk alternatives, as manufacturers replace synthetic additives with natural coloring and flavoring components. Plant-based dairy alternatives fuel demand for vegetable proteins and natural sweeteners, supported by clean-label regulations. Consumers demonstrate willingness to pay 20-30% price premiums for functional dairy products containing super-fruit ingredients with proven health benefits.
The beverage segment maintains its market leadership through established supplier relationships and high-volume requirements, despite showing signs of market maturation. The confectionery sector exhibits consistent demand for natural fruit flavors and colors, especially in premium chocolate and gummy products where clean-label formulations justify higher prices. Bakery applications demonstrate steady growth as manufacturers adopt clean-label bread and pastry formulations, substituting fruit and vegetable ingredients for synthetic preservatives and colorants. Soups and sauces provide stable demand for vegetable-based ingredients, while ready-to-eat products increase their use of fruit and vegetable powders to enhance nutritional value and extend shelf life.
Geography Analysis
Europe Fruit and Vegetable Ingredients Market
Europe holds 32.30% market share in 2025, built on extensive investments in processing technologies and regulations favoring natural ingredients. German and Dutch processors maintain premium pricing through stringent quality standards and efficient processing methods. France dominates luxury fruit ingredients for premium confectionery and bakery products, while the United Kingdom retains significant market presence in functional food ingredients despite Brexit trade changes. The EU's Farm to Fork strategy reinforces natural ingredients and sustainable processing, creating market advantages for European producers. However, elevated labor and energy costs limit growth, causing some processing operations to relocate to lower-cost regions while maintaining European quality certifications.
APAC Fruit and Vegetable Ingredients Market
Asia-Pacific shows the highest growth rate at 7.96% CAGR, driven by expanding middle-class demographics and increasing adoption of Western processing methods. China leads regional expansion through infrastructure development and government-backed food processing modernization programs focused on export markets. Thailand and Indonesia utilize agricultural resources and cost advantages to establish strong positions in tropical fruit ingredients, particularly in coconut, mango, and pineapple processing. While supply chain infrastructure gaps and quality standardization issues persist, investments in cold-chain logistics and processing technologies continue to address these challenges.
North America Fruit and Vegetable Ingredients Market
North American markets maintain consistent growth through developments in functional foods and clean-label formulations, with the United States spearheading super-fruit ingredient innovation and premium products. Canada offers reliable supply chains for traditional fruit ingredients while expanding vegetable protein processing capabilities. Mexico's food processing industry benefits from U.S. market proximity and competitive labor costs, attracting multinational processing investments. The region's regulatory framework, including FDA guidelines, facilitates natural ingredient incorporation in food applications.

Regulatory Landscape
Regulation affecting fruit and vegetable ingredients is tightening around additive specifications, residues, and traceability, influencing raw-material sourcing and processing controls for concentrates, powders, and extracts. In the European Union, Commission Regulation (EU) 2026/196 amended specifications for certain food additives including gums and pectins, with an August 18, 2026 compliance date that requires ingredient suppliers and food manufacturers to re-qualify inputs and manage inventory transitions within the study period.
Controls on plant-origin raw materials are also becoming more structured in Europe through pesticide-residue monitoring and test methods. Commission Implementing Regulation (EU) 2026/748 (March 31, 2026) set the coordinated multiannual control program for pesticide residues for 2027 to 2029, and Commission Implementing Regulation (EU) 2026/765 (April 1, 2026) defined methods for official controls from January 1, 2027, increasing the need for documented supplier assurance and aligned laboratory protocols. In the United States, FDA FSMA traceability requirements remain a key reference point for certain fruits and vegetables on the Food Traceability List, but an FY2026 appropriations provision delays enforcement until July 20, 2028, giving ingredient manufacturers and brand owners more time to standardize lot-level data capture across multi-origin supply chains.
Competitive Landscape
The fruit and vegetable ingredients market shows moderate fragmentation, with regional players actively pursuing consolidation strategies to achieve economies of scale and access advanced technological capabilities. Major multinational companies such as Archer Daniels Midland, Kerry Group, and Cargill maintain their competitive positions through extensive integrated supply chains and sophisticated processing capabilities across multiple ingredient categories and geographic markets.
These companies prioritize the development of value-added ingredients with enhanced functional properties, making substantial investments in research and development to create differentiated products that command premium prices in the market. A significant technological divide exists between large integrated processors who invest heavily in advanced extraction and preservation technologies, and smaller regional players who focus their resources on niche applications and local market advantages.
Substantial market opportunities are emerging in specialized applications, including plant-based dairy alternatives, functional beverages, and clean-label confectionery products, where traditional ingredient suppliers currently lack the necessary technical expertise or processing capabilities to meet market demands. Companies with comprehensive integrated capabilities spanning agricultural sourcing, advanced processing techniques, and sophisticated application development have established a strong competitive advantage, as customers increasingly seek comprehensive single-source solutions for their complex formulation requirements.
Fruit And Vegetable Ingredients Industry Leaders
-
Archer Daniels Midland Company
-
Olam International
-
Kerry Group PLC
-
Südzucker AG (AGRANA)
-
Döhler GmbH
- *Disclaimer: Major Players sorted in no particular order

Fruit And Vegetable Ingredients Market Companies Covered in this Report
- Archer Daniels Midland Company
- Kerry Group plc
- Döhler GmbH
- Südzucker AG (AGRANA)
- Sensient Technologies Corporation
- Olam International Limited
- Cargill Incorporated
- Tate & Lyle plc
- SVZ Industrial Fruit & Vegetable Ingredients
- Hans Zipperle AG
- Kanegrade Ltd
- Taura Natural Food Ingredients
- SunOpta Inc.
- Diana Food (Symrise AG)
- Ingredion Incorporated
- Chr. Hansen Holding A/S
- Tree Top Inc.
- Paradise Fruits Solutions GmbH
- Milne Fruit Products Inc.
- Dohler Group Juices & Purees Division

Market Opportunities and Future Outlook
Upcycling and functionalization of fruit and vegetable side-streams are shifting from concept into active product portfolios, creating openings for ingredient suppliers to deliver clean-label functionality (fiber, mouthfeel, and stability) alongside sustainability credentials. In June 2026, Ingredion acquired NutriLeads' Benicaros, a prebiotic fiber ingredient derived from upcycled carrot pomace, pointing to continued M&A momentum around vegetable-fiber ingredients that combine clean-label formulation with gut-health positioning. Innovation is also moving into beverage and flavor systems using upcycled fruit fractions, including the July 2026 Del Monte Corporation and Treatt launch of upcycled fruit extracts (pineapple, watermelon, mango, and cantaloupe) created from premium fruit materials generated in processing operations.
Processing capacity and local crop-linked infrastructure are another opportunity area, especially where fruit supply consistency constrains formulators. In June 2026, Suntory Beverage and Food GB&I invested GBP 14.5 million in a new blackcurrant processing facility in Herefordshire (UK), designed around modern evaporation and membrane filtration to strengthen supply chain capability for a key fruit input. Academic work in 2026 also highlights advanced extraction and structuring approaches, including ultrasound-assisted processing and membrane-based concentration, aimed at improving hydration and stability and retaining phytochemicals in dietary fiber concentrates and bioactive-rich powders, aligning with the market move toward higher-value powders and standardized extracts for functional beverages, dairy products, and nutrition-led applications.
Recent Industry Developments in Fruit And Vegetable Ingredients Market
- June 2026: Archer Daniels Midland Company expanded its Customer Creation and Innovation Center lab in Hungary to support beverage development across Eastern Europe, including low-sugar concepts and faster formulation support for regional customers. The added application capability strengthens supplier involvement earlier in product design, which can increase pull-through demand for fruit and vegetable concentrates, extracts, and related systems in ready-to-market beverage formats.
- February 2025: Dole launched Green Banana Powder made from minimally processed unripe bananas sourced from its plantations in the Philippines. The ingredient is distributed through a partnership with Givaudan as part of the Sense Texture range and targets clean-label texture and viscosity replacement in soups, sauces, baked goods, and snacks, expanding the commercial role of fruit-derived powders beyond flavor and sweetness into functional formulation performance.
- October 2024: Fruit d'Or introduced Blue d'Or Vitality, an organic powder blend of wild blueberries and cranberries aimed at sports nutrition and nutraceutical applications. The launch supports the shift toward premium berry-based powders positioned around antioxidant and wellness benefits, reinforcing demand for standardized, shelf-stable fruit powders in protein mixes, superfood blends, and energy formats.


Fruit And Vegetable Ingredients Market Report Scope and Research Methodology
Market Definition and Coverage
This market covers commercial ingredients made from fruits and vegetables that are sold to food and beverage manufacturers for use in recipes, reformulation, and product standardization, where the value is counted at the ingredient supplier selling price.
Scope exclusions: Fresh whole produce sold for direct consumption, on-farm losses, and retail-ready finished foods are not counted as market revenue.
Segments Covered in This Report
-
Ingredient Type
-
Fruits
- Apple
- Orange
- Pineapple
- Mango
- Banana
- Kiwi
-
Berries
- Strawberries
- Raspberries
- Blueberries
- Other Berries
- Other Fruits
-
Vegetables
- Carrots
- Beetroots
- Tomato
- Zucchinis
- Butternuts
- Pumpkins
- Other Vegetables
-
Fruits
-
Form
- Concentrates
- Pastes and Purees
- Pieces and Slices
- Powders
- Others (NFC Juices, extracts)
-
Application
- Beverages
- Confectionery Products
- Bakery Products
- Soups and Sauces
- Dairy Products
- RTE Products
- Others
-
Geography
-
North America
- United States
- Canada
- Mexico
- Rest of North America
-
Europe
- Germany
- France
- United Kingdom
- Spain
- Netherlands
- Italy
- Sweden
- Poland
- Belgium
- Rest of Europe
-
Asia-Pacific
- China
- India
- Japan
- Australia
- South Korea
- Indonesia
- Thailand
- Singapore
- Rest of Asia-Pacific
-
South America
- Brazil
- Argentina
- Chile
- Colombia
- Peru
- Rest of South America
-
Middle East and Africa
- United Arab Emirates
- South Africa
- Nigeria
- Saudi Arabia
- Egypt
- Morocco
- Turkey
- Rest of Middle East and Africa
-
North America
Data Sources, Market Sizing, and Validation
Desk Research
Desk research was used to set the factual base for the model before any assumptions were applied, so the market totals stay aligned with real supply and demand signals. We pulled long-run context from public sources such as FAOSTAT crop production series, UN Comtrade trade flows for processed fruit and vegetable products, and USDA datasets where relevant to global fruit and vegetable processing.
To keep the model grounded in what processors can realistically supply, supporting reads were taken from sources such as Codex Alimentarius standards (for ingredient definitions and labeling cues), peer-reviewed journals on processing yields and shelf-stable formats, and association or government food-industry statistics. Company annual reports, investor decks, and reputable press were then used to cross-check capacity additions, pricing direction, and category focus. A paid subscription for company financials and a patent database were referenced selectively to validate scale and innovation signals. The sources listed here are illustrative only, and many other public and paid references were used for data collection, validation, and clarification.
Primary Interviews and Surveys
Primary work focused on ingredient makers, distributors, and large food manufacturers that buy these inputs, so pricing logic and channel mix were validated in practical commercial terms. Interviews and short surveys were also used to test yield assumptions (raw-to-ingredient conversion), typical contract structures, and how demand moves across beverages, bakery, dairy, soups and sauces, and ready-to-eat foods across APAC, EMEA, and the Americas.
Distribution of primary research fieldwork respondents
| Company type | Respondent position | Region |
|---|---|---|
| Top tier: 27% | CXOs: 13% | APAC: 41% |
| Mid tier: 54% | Functional/Unit leaders: 40% | EMEA: 32% |
| Smaller Players: 19% | Managers: 47% | Americas: 27% |
Market-Sizing & Forecasting
Sizing started with a top-down build where processed fruit and vegetable supply and trade indicators were used to reconstruct an addressable ingredient demand pool, and then the spend was translated into value using observed price bands by form. Once those totals were formed, they were stress-tested with selective bottom-up approximations such as sampled supplier revenue splits, distributor channel checks, and volume times average selling price for common ingredient formats.
Key inputs used in the model included processed output proxies (drying, juicing, and puree capacity utilization), yield factors from raw produce into concentrate or powder, import and export trends for processed categories, application-led consumption signals in major packaged-food categories, and inflation-adjusted price movements for fruit and vegetable inputs. For the forecast, scenario analysis was used so upside and downside cases could be anchored to a few drivers that interviewees agreed on, including beverage reformulation pace, clean-label adoption, and the availability of seasonal raw materials. Where bottom-up visibility was weaker for smaller processors, gaps were handled through regional scaling factors tied back to trade intensity and observed processing footprint.
Data Validation & Update Cycle
Validation was done in layers so a single weak datapoint did not drive the outcome, and the final numbers stayed explainable. Model outputs were checked against independent signals such as processed-food export value trends, major capacity announcements, and direction of ingredient pricing, and then outliers were revisited until the variance looked reasonable.
Before sign-off, the build goes through an analyst review that rechecks definitions, unit conversions, and currency timing, followed by a second pass that focuses on whether growth drivers match what was heard in interviews. The report is refreshed annually, and interim updates are triggered when a material event changes supply, pricing, or demand expectations. Right before delivery, a fresh update pass is completed so the numbers reflect the latest publicly available signals.
Mordor Intelligence's Fruit and Vegetable Ingredients Market Estimate Compared With Other Published Estimates
Published market values for fruit and vegetable ingredients often look different because each publisher makes its own calls on what to count as an ingredient, what pricing level to use, and how to treat global trade and currency timing. Differences also show up when base years vary, or when forecasts embed aggressive assumptions about clean-label reformulation and beverage growth.
The main gap comes from whether adjacent categories like retail-ready juices, finished baby food, or broader processed fruit and vegetable products are quietly rolled into the total, where Mordor Intelligence counts only B2B ingredient formats and keeps the value at the ingredient supplier selling price after checking it against yield and trade signals.
Benchmark comparison
| Source | Market Size | Gaps in Research Methodology |
|---|---|---|
| Mordor Intelligence | USD 255.49 B (2026) | |
| Global Consultancy A | USD 232.80 B (2025) | Uses an earlier base year and mixes ingredient demand with broader category framing, so the price level and timing of currency conversion can pull the total down versus a 2026 start. |
| Industry Publisher B | USD 250.63 B (2025) | Keeps a 2025 value but can reflect wider inclusion of processed forms and different assumptions on average selling price progression, which shifts the headline number even when the end uses look similar. |
The spread across the three values is mainly explained by scope cutoffs and how value is booked, and then by the chosen base year and pricing ramp. By tying the model to observable processing footprint, yields, and trade intensity, the estimate remains traceable to clear inputs and can be rechecked as market conditions change.


Key Questions Answered in the Report
How large is the fruit and vegetable ingredients market in 2026?
The market stands at USD 255.49 billion in 2026 and is forecast to reach USD 334.05 billion by 2031.
Which ingredient segment is growing fastest?
Vegetable-based ingredients are advancing at a 7.59% CAGR, driven by plant-based protein and natural color applications.
What is driving the growth in powder forms of fruit and vegetable ingredients?
Superior shelf life, reduced freight costs, and advanced drying techniques are pushing powders to an 8.45% CAGR.
Why is Asia-Pacific expanding more quickly than other regions?
Rising middle-class incomes, rapid processing-plant investment, and proximity to tropical raw materials underpin the region’s 7.96% CAGR.
Page last updated on:


 Your data is secure and never sold or shared.


