Market Overview
| Study Period | 2021 - 2031 |
|---|---|
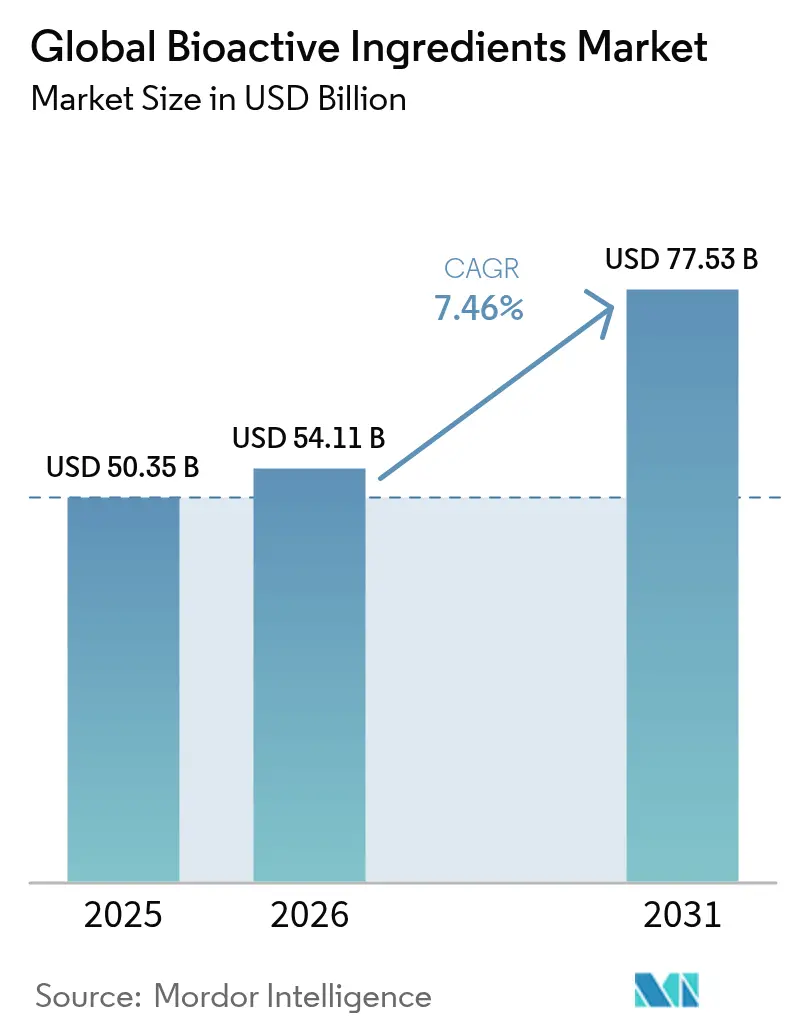
| Market Size (2026) | USD 54.11 Billion |
| Market Size (2031) | USD 77.53 Billion |
| Growth Rate (2026 - 2031) | 7.46% CAGR |
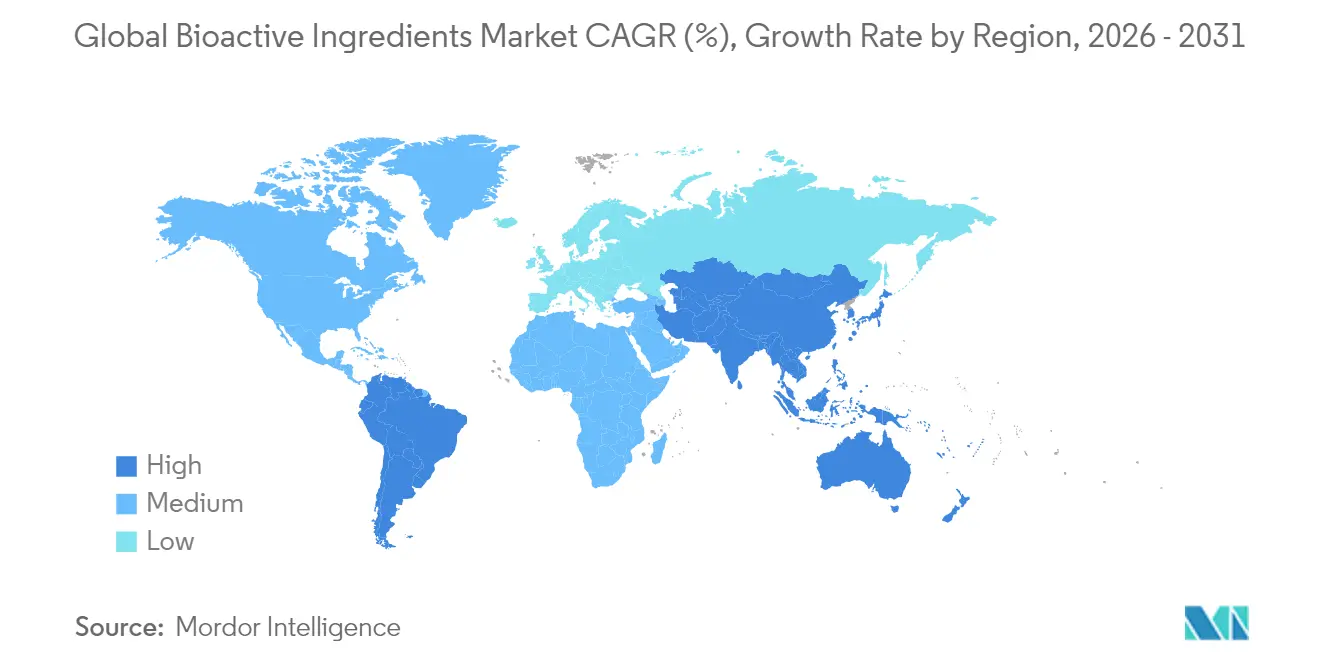
| Fastest Growing Market | Asia Pacific |
| Largest Market | Europe |
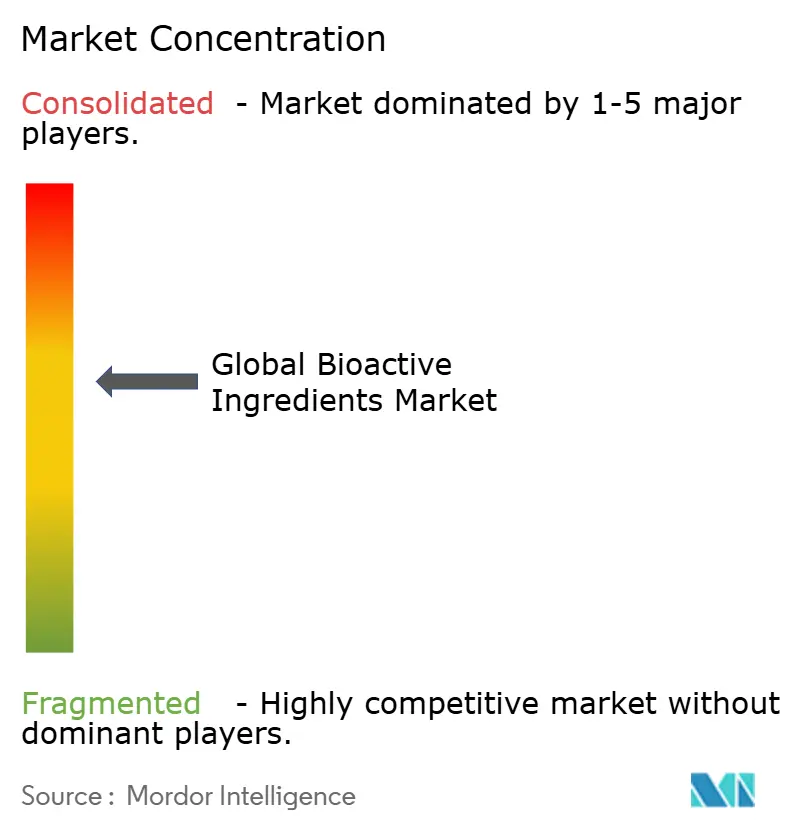
| Market Concentration | Medium |
Major Players
*Disclaimer: Major Players sorted in no particular order Image © Mordor Intelligence. Reuse requires attribution under CC BY 4.0. |
|
Global Bioactive Ingredients Market Analysis by Mordor Intelligence
The bioactive ingredients market size is expected to grow from USD 50.35 billion in 2025 to USD 54.11 billion in 2026 and is forecast to reach USD 77.53 billion by 2031 at 7.46% CAGR over 2026-2031. This growth corresponds with increasing consumer demand for functional foods and supplements that support disease prevention and wellness. Several factors drive market development, including enhanced food safety regulations and ingredient approval processes that improve product quality and market access. Technological progress in ingredient delivery systems has enhanced bioavailability and efficacy. Consumer awareness of preventive healthcare and self-care practices has led to higher consumption of functional foods and supplements. The expanding aging population and their nutritional requirements have increased demand for targeted bioactive solutions. Furthermore, advances in nutrigenomics and personalized nutrition research have created new opportunities for specialized bioactive ingredients.
Key Report Takeaways
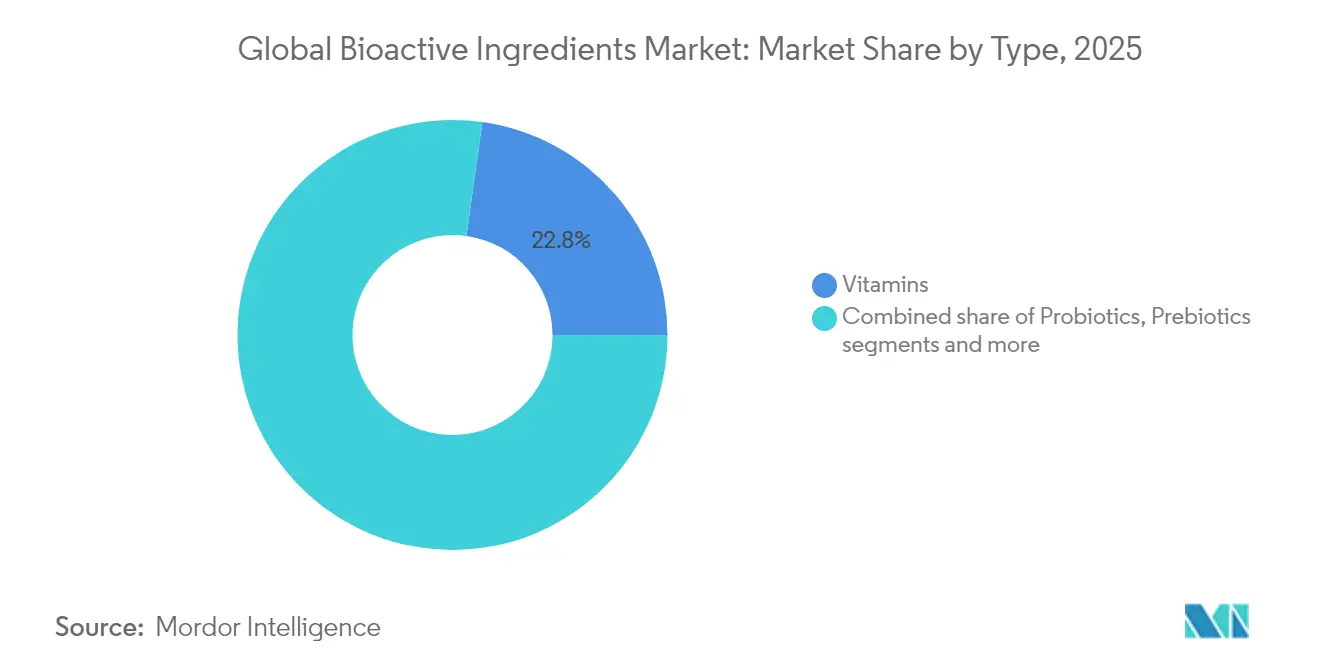
- By type, vitamins led with 22.78% of bioactive ingredients market share in 2025, whereas probiotics are projected to grow at a 9.04% CAGR from 2026-2031.
- By source, plant-based ingredients captured 62.48% share of the bioactive ingredients market in 2025, while microbial sources are set to expand at a 10.31% CAGR through 2031.
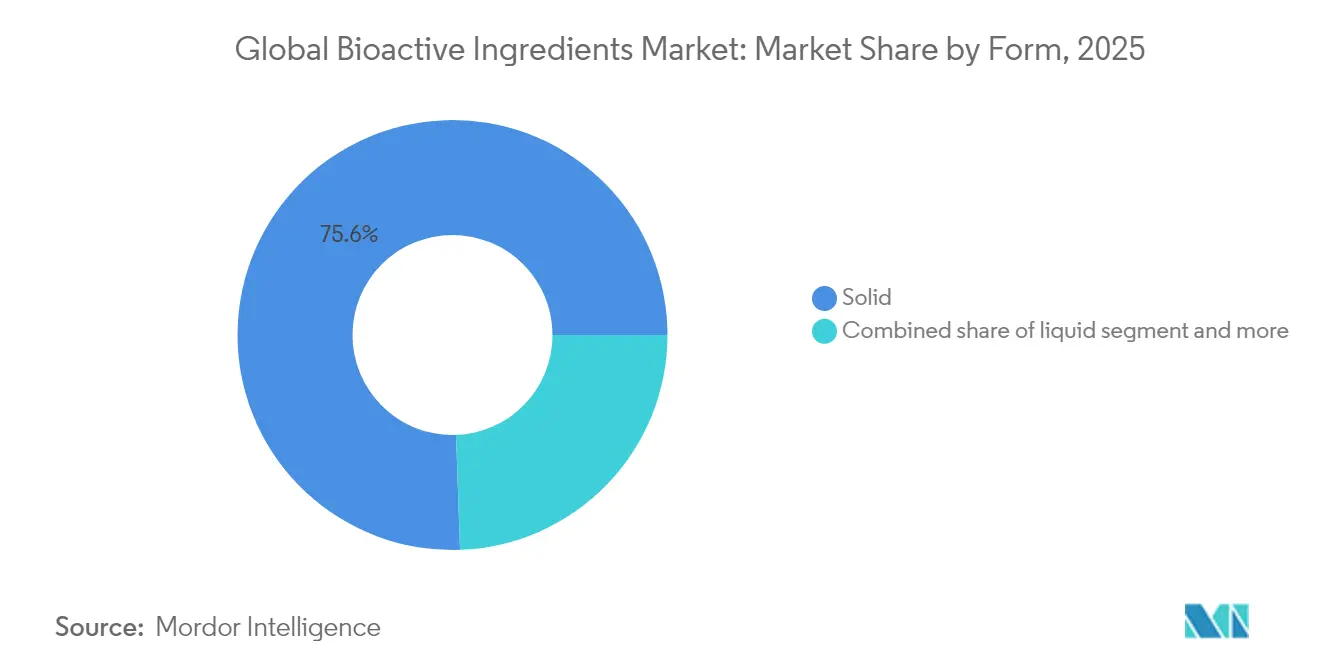
- By form, solid formats held 75.56% revenue share in 2025; liquid formats are forecast to climb at an 11.08% CAGR to 2031.
- By application, dietary supplements accounted for 35.68% of the bioactive ingredients market size in 2025, but food and beverages will advance at a 10.76% CAGR between 2026-2031.
- By geography, Europe commanded 34.12% of the bioactive ingredients market in 2025, whereas Asia-Pacific is poised for the fastest 10.61% CAGR over the same outlook period.
Note: Market size and forecast figures in this report are generated using Mordor Intelligence’s proprietary estimation framework, updated with the latest available data and insights as of 2026.
Global Bioactive Ingredients Market Trends and Insights
Drivers Impact Analysis*
| Driver | (~) % Impact on CAGR Forecast | Geographic Relevance | Impact Timeline |
|---|---|---|---|
| Rising consumer demand for health and wellness products | +1.8% | Global, with the strongest impact in North America and Europe | Medium term (2-4 years) |
| Growing prevalence of chronic and age-related conditions | +1.5% | Global, particularly developed markets | Long term (≥ 4 years) |
| Surging demand for plant-based and sustainable ingredients | +1.2% | Europe and North America are leading, expanding to Asia-Pacific | Medium term (2-4 years) |
| Expanding pharmaceutical applications | +1.0% | North America and Europe, emerging in Asia-Pacific | Long term (≥ 4 years) |
| Rising popularity of personalized nutrition | +0.8% | North America and Europe, pilot programs in Asia-Pacific | Medium term (2-4 years) |
| Technological advancements in ingredient delivery | +0.7% | Global, with innovation centers in North America and Europe | Short term (≤ 2 years) |
| Source: Mordor Intelligence | |||
Rising consumer demand for health and wellness products
The increasing consumer emphasis on preventive healthcare drives the adoption of bioactive ingredients in functional foods, dietary supplements, and personalized nutrition products. Health consciousness and understanding of nutrition's role in disease prevention serve as primary market drivers, while the global aging population seeks natural health solutions. Consumer preference for clean-label products and sustainable sourcing has increased demand for plant-based ingredients. Increased disposable income in developing economies has expanded consumer access to premium nutritional products, exemplified by Nestlé's NAN Sinergity infant formula with six human milk oligosaccharides and Bifidobacterium infantis. Improved ingredient extraction and processing technologies have enhanced the efficiency and quality of bioactive ingredients, while major companies' increased research and development investments strengthen scientific validation. The growth of distribution channels, especially e-commerce, has improved product accessibility and market reach, supporting industry expansion.
Growing prevalence of chronic and age-related conditions
The increasing aging population and prevalence of chronic diseases drive the demand for bioactive ingredients that offer therapeutic benefits, particularly for cardiovascular health, cognitive function, and metabolic disorders. Nestlé Health Science's COGNIKET-MCI trial, which studies BrainXpert ketogenic products for mild cognitive impairment, demonstrates the pharmaceutical applications of these ingredients. The condition affects approximately 20% of individuals over 65 years [1]Nestle Health Science, "Seven-country mild cognitive impairment trial underway", nestlehealthscience.com. The trial encompasses 380 participants across seven countries and evaluates cognitive decline prevention, quality of life improvement, and sleep quality enhancement through medium chain triglycerides and B-vitamins. Plant-derived bioactive compounds demonstrate effectiveness in neuroprotective, metabolic, and hepatoprotective applications. Compounds such as ellagic acid and gallic acid provide antioxidant and anti-inflammatory benefits essential for addressing non-communicable diseases. The market impact is significant, as AI-driven precision nutrition interventions reduce healthcare costs through improved health outcomes, contributing to market sustainability as healthcare systems emphasize prevention over treatment.
Surging demand for plant-based and sustainable ingredients
Sustainability requirements are transforming ingredient sourcing practices, as companies aim to reduce their environmental impact compared to conventional methods. According to the BMEL Food Report 2024, more than 77% of German consumers prefer regional food sources, creating opportunities for organic brands to strengthen their sustainability positioning [2]BMEL, "The BMEL Food Report 2024", bmel.de. The increasing focus on health and wellness, aging population, and rising healthcare costs drive the demand for bioactive ingredients in functional foods and dietary supplements. Consumer awareness about preventive healthcare and the benefits of natural ingredients further accelerates market growth. The plant-based market continues to expand with increased purchases of vegetarian and vegan alternatives, while technological advancements in extraction and processing methods enhance the efficacy of bioactive compounds. Additionally, seaweed has emerged as a sustainable resource for pharmaceutical manufacturing, offering a renewable and abundant supply without the need for freshwater or arable land. The growing research and development activities in identifying new bioactive compounds and their applications across the food, pharmaceutical, and cosmetic industries contribute to market expansion.
Expanding pharmaceutical applications
Bioactive ingredients are used in both nutraceutical and pharmaceutical applications, with regulatory frameworks supporting the development of therapeutic compounds for specific health conditions. The market is expanding due to increased consumer focus on preventive healthcare, higher demand for functional foods, and expanded research into natural therapeutic compounds. Plant-derived compounds are effective against multidrug-resistant microorganisms, with phenolics, terpenoids, alkaloids, and glycosides showing efficacy against resistant bacterial strains through various mechanisms. The combination of an aging population and increasing healthcare costs drives the demand for natural bioactive compounds in dietary supplements and functional foods. Advances in extraction and processing technologies have improved the commercial viability of bioactive ingredients. Modern delivery systems using nanotechnology, such as liposomes and nanoparticles, enhance the bioavailability and targeted delivery of bioactive compounds like curcumin and resveratrol. The development of plant-based platforms for monoclonal antibody production and plant viral nanoparticles provides cost-effective alternatives to conventional drug delivery methods, particularly in regions with limited healthcare access.
Restraints Impact Analysis*
| Restraint | (~) % Impact on CAGR Forecast | Geographic Relevance | Impact Timeline |
|---|---|---|---|
| Price volatility and sustainability challenges in raw material sourcing | -1.4% | Global, particularly affecting China-dependent supply chains | Short term (≤ 2 years) |
| Limited bioavailability of certain ingredients | -0.9% | Global, with higher impact in developing markets | Medium term (2-4 years) |
| Complex and stringent regulatory framework | -0.7% | North America and Europe primarily, expanding to Asia-Pacific | Long term (≥ 4 years) |
| Competition from cost-effective synthetic alternatives | -0.6% | Global, with varying regional preferences | Medium term (2-4 years) |
| Source: Mordor Intelligence | |||
Price volatility and sustainability challenges in raw material sourcing
The concentration of supply chains creates vulnerabilities in the vitamin market, demonstrating risks in raw material sourcing for bioactive ingredients. Market disruptions in 2024 included a European producer explosion affecting Vitamin E and A supplies, highlighting the risks of concentrated production facilities. Vitamin D3 prices remained high due to supply limitations, while Vitamin C prices decreased due to excess capacity [3]All About Feed, "Vitamin markets: High prices for vitamin D due to material shortages", allaboutfeed.net . New tariffs, including 25% on Canadian and Mexican goods and 10% on Chinese imports, created additional cost pressures [4]The White House, "Fact Sheet: President Donald J. Trump Imposes Tariffs on Imports from Canada, Mexico and China", whitehouse.gov. These tariffs significantly impacted herbal ingredients where alternative sourcing was limited. The increased costs affected manufacturers' profit margins and pricing ability. Supply chain vulnerabilities and trade barriers present challenges for market participants, potentially restricting market expansion and new product development. The geographical concentration of raw materials creates risks for supply and quality control. Environmental, political, or economic challenges in primary production regions cause disruptions across the supply chain. These factors limit market growth and require more resilient supply chain strategies.
Complex and stringent regulatory framework
Regulatory complexity across jurisdictions creates significant market entry barriers and compliance costs that particularly affect smaller manufacturers and innovative ingredient developers in the bioactive ingredients market. The European Food Safety Authority's updated novel food guidance, effective February 2025, requires enhanced documentation including detailed production processes, composition analysis, stability data, and nutritional assessments, increasing application complexity and review timelines. The FDA's elimination of self-affirmed GRAS pathways requires companies to submit comprehensive safety data for regulatory review, providing public disclosure and regulatory assurance while increasing compliance costs for manufacturers previously relying on internal safety determinations. These regulatory requirements often lead to extended product development cycles and increased research and development costs. Additionally, manufacturers face challenges in standardizing bioactive ingredients due to natural variations in source materials, which can affect product consistency and quality control measures. The complex extraction and purification processes, combined with the need for specialized equipment and expertise, further increase production costs and limit market participation, especially for emerging companies.
*Our forecasts treat driver/restraint impacts as directional, not additive. The impact forecasts reflect baseline growth, mix effects, and variable interactions.
Segment Analysis
Type: Probiotics Lead Innovation Wave
Vitamins hold the largest market share at 22.78% in 2025, due to their established consumer acceptance and broad use in dietary supplements and food fortification. The vitamin segment's dominance stems from increased consumer focus on preventive healthcare, growing fortification mandates across countries, and rising demand in developing markets. The omega-3 fatty acids segment faces supply chain difficulties, as increased contamination cases require stricter testing procedures and quality assurance measures. These challenges primarily affect fish oil-based omega-3 sources, leading manufacturers to explore alternative sources like algae and krill oil while implementing advanced purification technologies.
The probiotics segment is projected to grow at a CAGR of 9.04% through 2031, driven by expanding knowledge of gut health and microbiome research developments. The growth trajectory is particularly evident in functional foods, where manufacturers are incorporating diverse probiotic strains to meet consumer demand. In the beverage sector, probiotic-enriched drinks continue to gain market share, especially in dairy-based and plant-based alternatives. The dietary supplements category shows robust growth, with consumers increasingly seeking specialized probiotic formulations for specific health benefits. The prebiotics segment demonstrates steady growth, primarily through ingredients like inulin and fructooligosaccharides that complement probiotic products.


Source: Microbial Innovation Disrupts Plant Dominance
Plant-based sources hold a 62.48% market share in 2025, driven by consumer demand for sustainable options and regulatory approval of botanical ingredients. These sources benefit from well-established supply chains, extensive scientific validation, and cost-effective production methods. Recent agricultural innovations and enhanced extraction processes have improved both yield and quality of botanical ingredients, strengthening their market position. The widespread acceptance of plant-based colors is further supported by their proven safety record and compatibility with various food applications. The market dominance is reinforced by continuous research and development efforts focused on improving color stability and expanding the range of natural shades available.
Microbial-based alternatives are growing at a 10.31% CAGR, primarily due to innovations in precision fermentation that enable the production of complex color molecules. This growth is driven by new fermentation facility investments, improved production strains, and advanced bioprocessing methods. The technology enables consistent year-round production while reducing environmental impact and maintaining product quality standards. Microbial sources offer advantages in scalability and resource efficiency compared to traditional extraction methods. The segment's growth is further accelerated by increasing industry adoption and ongoing technological advancements in fermentation processes.
Form: Liquid Applications Drive Technology Innovation
Solid forms maintain a dominant 75.56% market share in 2025, driven by established manufacturing processes and widespread consumer acceptance. The prevalence of tablets, capsules, and powder formulations reflects their proven track record in delivering consistent dosage and stability. These forms benefit from well-established quality control measures and standardized production methods, making them cost-effective for manufacturers. Consumer familiarity with solid forms, coupled with their convenience in storage and transportation, contributes to their market leadership. Additionally, solid forms offer extended shelf life and precise dosage control, making them particularly suitable for a wide range of nutritional and pharmaceutical applications.
Liquid forms are experiencing the highest growth rate with an 11.08% CAGR, due to their superior bioavailability, rapid absorption, and ease of consumption. Liposome technology enables liquid formulations to encapsulate both hydrophilic and hydrophobic bioactive compounds, enhancing stability and therapeutic efficacy while reducing side effects. Nanoencapsulation technology improves liquid applications by increasing the solubility and bioavailability of hydrophobic molecules. The use of Facilitated Self-Assembling Technology (FAST) eliminates the need for additional surfactants or stabilizers. The market share of liquid forms is expected to increase as developments in stability and formulation technology continue to advance.
Application: Food and Beverages Accelerate Functional Integration
Dietary supplements dominate the market with a 35.68% share in 2025, driven by established consumer behavior and regulatory frameworks for nutraceutical applications. This market leadership results from increased health awareness, aging populations seeking preventive healthcare, and extensive distribution networks through pharmacies and health stores. Manufacturers are expanding beyond traditional supplements to develop integrated lifestyle products that offer health benefits through multiple consumption formats. The product range now includes specialized formulations for sports nutrition, weight management, immune support, and cognitive health, addressing specific consumer segments and health needs.
The food and beverages segment demonstrates a 10.76% CAGR, propelled by functional food development and consumer interest in integrated nutrition through daily diets. This expansion reflects consumer preferences for fortified products and clean-label solutions. Manufacturers incorporate bioactive ingredients across bakery products, dairy alternatives, beverages, and confectionery items. Current market offerings include omega-3 fortified plant-based beverages, probiotic-enriched snacks, and antioxidant-enhanced breakfast cereals, meeting both nutritional requirements and consumer preferences.
Geography Analysis
Europe holds 34.12% market share in 2025, driven by robust regulations and high consumer health awareness. The European Food Safety Authority's updated novel food guidance, effective February 2025, improves application processes through standardized documentation and digital platforms. Germany leads consumption through strong retail distribution networks, while the United Kingdom focuses on plant-based innovations. France emphasizes natural ingredient applications, and the Netherlands has emerged as a center for precision fermentation and sustainable ingredient innovation.
Asia-Pacific exhibits the highest growth rate at 10.61% CAGR through 2031, supported by increasing disposable incomes and health awareness. China leads regional consumption despite supply chain challenges, with significant expansion in domestic ingredient manufacturing. India presents substantial growth opportunities with new regulatory approvals and government support for traditional medicine ingredients. Australia maintains high regulatory standards through strict quality control measures, while ASEAN countries develop harmonized guidelines. Indonesia, Thailand, and Vietnam improve testing infrastructure to meet rising health demand.
North America displays established market characteristics with comprehensive regulatory structures and consistent supplement consumption. The FDA's GRAS rule modifications enhance ingredient transparency through mandatory electronic notifications and safety documentation. Manufacturers face new compliance requirements, including additional safety studies and expert panel evaluations. Canada and Mexico experience increased tariff impacts on specialty ingredients and botanical extracts. The United States advances precision nutrition through artificial intelligence applications and extensive clinical research programs.
Note: Segment shares of all Individual regions will be available upon report purchase

Competitive Landscape
The bioactive ingredients market exhibits moderate concentration, with consolidation accelerating through strategic acquisitions targeting specialized capabilities and geographic expansion. Market leaders in the market include Archer-Daniels-Midland Company, International Flavors & Fragrances Inc., Kerry Group plc, BASF SE, and Cargill, Incorporated.
Market concentration remains distributed among established players, though recent mergers and acquisition activity indicate industry maturation toward integrated platforms combining ingredient production, delivery technology, and application expertise.
Technology differentiation emerges as a key competitive factor, with companies leveraging precision fermentation, nanotechnology delivery systems, and AI-driven personalization to capture market share. Emerging disruptors include precision fermentation companies like Better Dairy, developing complex proteins through yeast strains, while established players face pressure from cost-effective synthetic alternatives and supply chain vulnerabilities requiring strategic diversification beyond traditional sourcing regions.
Global Bioactive Ingredients Industry Leaders
-
Archer-Daniels-Midland Company
-
International Flavors & Fragrances Inc.
-
Kerry Group plc
-
BASF SE
-
Cargill, Incorporated
- *Disclaimer: Major Players sorted in no particular order

Recent Industry Developments
- June 2025: Better Dairy announced development of human osteopontin through precision fermentation using yeast strains, targeting infant formula applications with competitive pricing for high-value proteins. The innovation addresses supply challenges for bioactive ingredients while expanding applications beyond infant formula to women's health and healthy aging markets.
- May 2025: FDA approved Galdieria extract blue derived from Galdieria sulphuraria for use in various food categories under good manufacturing practices, following a color additive petition from Fermentalg. The approval demonstrates regulatory progression for novel bioactive ingredients derived from microorganisms.
- May 2025: FDA approved butterfly pea flower extract as a color additive in cereals and snacks, effective June 26, 2025, following Sensient Colors LLC petition. The decision reflects growing regulatory acceptance of natural bioactive ingredients in food applications.
- April 2024: European Commission authorized five new novel foods, including monosodium salt of L-5-methyltetrahydrofolate and beta-glucan from Euglena gracilis, applied by Merck & Cie KmG, expanding approved bioactive ingredient options across various food categories with specified maximum levels and labeling requirements.


Global Bioactive Ingredients Market Report Scope
Bioactive ingredients are the constituents of food or dietary supplements that are consumed other than for basic nutritional needs. Bioactive ingredients provide extra nutrition and health after consumption'.
The bioactive ingredients market is segmented by ingredient type, application, and geography. By ingredient, the market is segmented into probiotics and prebiotics, omega-3 fatty acids, vitamins, carotenoids, plant extracts, minerals, amino acids, proteins, and peptides. Vitamins are further segmented into vitamins A, B, C, and others. Based on application, the market studied is segmented into food and beverage, dietary supplement, animal nutrition, personal and beauty care, and pharmaceutical. Based on geography, the market is segmented into North America, Europe, Asia-Pacific, South America, and Middle East & Africa.
For each segment, the market sizing and forecasts have been done based on value (in USD million).
By Type
| Vitamins |
| Probiotics |
| Prebiotics |
| Omega-3 Fatty Acids |
| Carotenoids |
| Plant Extracts |
| Minerals |
| Others |
By Source
| Plant-based |
| Microbial-based |
| Animal-based |
| Others |
By Form
| Solid |
| Liquid |
| Others |
By Application
| Dietary Supplements |
| Food and Beverages |
| Animal Nutrition |
| Others |
Geography
| North America | United States |
| Canada | |
| Mexico | |
| Rest of North America | |
| Europe | Germany |
| United Kingdom | |
| Italy | |
| France | |
| Spain | |
| Netherlands | |
| Rest of Europe | |
| Asia-Pacific | China |
| India | |
| Japan | |
| Australia | |
| South Korea | |
| Rest of Asia-Pacific | |
| South America | Brazil |
| Argentina | |
| Rest of South America | |
| Middle East and Africa | South Africa |
| Saudi Arabia | |
| United Arab Emirates | |
| Rest of Middle East and Africa |
| By Type | Vitamins | |
| Probiotics | ||
| Prebiotics | ||
| Omega-3 Fatty Acids | ||
| Carotenoids | ||
| Plant Extracts | ||
| Minerals | ||
| Others | ||
| By Source | Plant-based | |
| Microbial-based | ||
| Animal-based | ||
| Others | ||
| By Form | Solid | |
| Liquid | ||
| Others | ||
| By Application | Dietary Supplements | |
| Food and Beverages | ||
| Animal Nutrition | ||
| Others | ||
| Geography | North America | United States |
| Canada | ||
| Mexico | ||
| Rest of North America | ||
| Europe | Germany | |
| United Kingdom | ||
| Italy | ||
| France | ||
| Spain | ||
| Netherlands | ||
| Rest of Europe | ||
| Asia-Pacific | China | |
| India | ||
| Japan | ||
| Australia | ||
| South Korea | ||
| Rest of Asia-Pacific | ||
| South America | Brazil | |
| Argentina | ||
| Rest of South America | ||
| Middle East and Africa | South Africa | |
| Saudi Arabia | ||
| United Arab Emirates | ||
| Rest of Middle East and Africa | ||


Key Questions Answered in the Report
What is the current bioactive ingredients market size and how fast is it growing?
The bioactive ingredients market size reached USD 54.11 billion in 2026 and is expected to climb to USD 77.53 billion by 2031 at a 7.46% CAGR.
Which segment is expanding fastest within the bioactive ingredients market?
Probiotics stand out, advancing at a 9.04% CAGR through 2031 on the back of microbiome science and strong demand in Asia-Pacific.
Why are microbial sources gaining traction over traditional plant inputs?
Precision fermentation allows cost-effective, animal-free production of complex molecules like HMOs and collagen analogues, driving a 10.31% CAGR for microbial ingredients.
What are the main risks facing the bioactive ingredients industry?
Supply-chain concentration in China, raw-material price volatility, and varying international regulations present near-term headwinds challenging the market growth.
Page last updated on:


