Vision Transformers Market Size and Share
Market Overview
| Study Period | 2019 - 2030 |
|---|---|
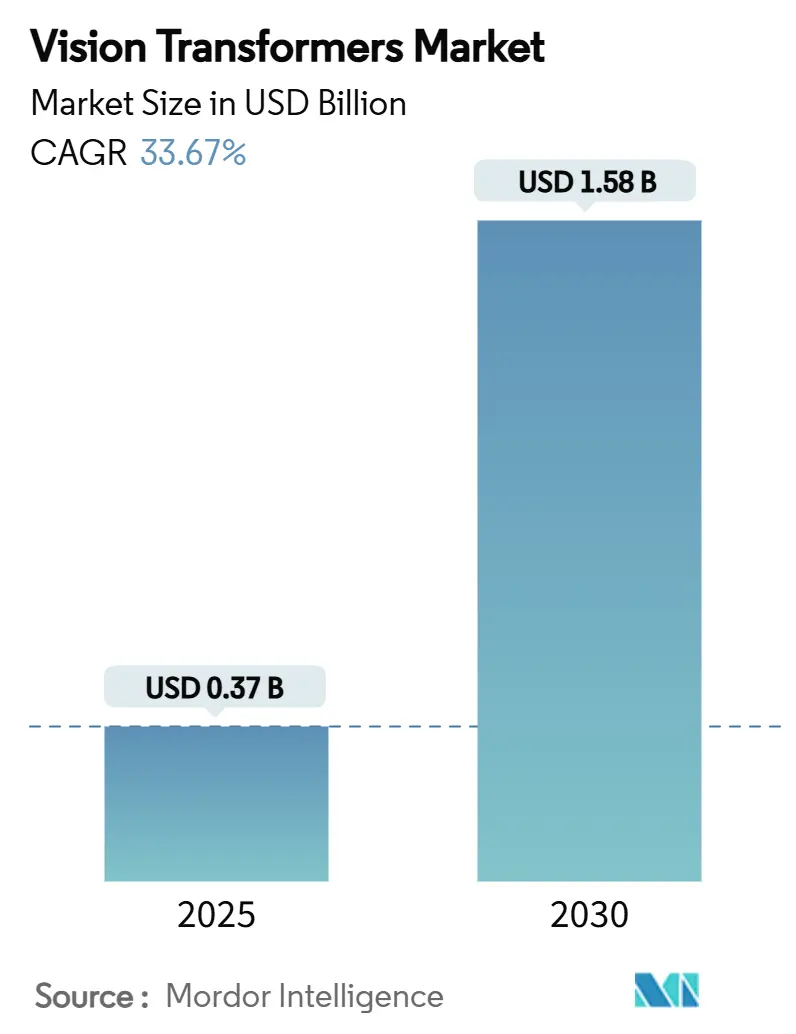
| Market Size (2025) | USD 0.37 Billion |
| Market Size (2030) | USD 1.58 Billion |
| Growth Rate (2025 - 2030) | 33.67% CAGR |
| Fastest Growing Market | Asia Pacific |
| Largest Market | North America |
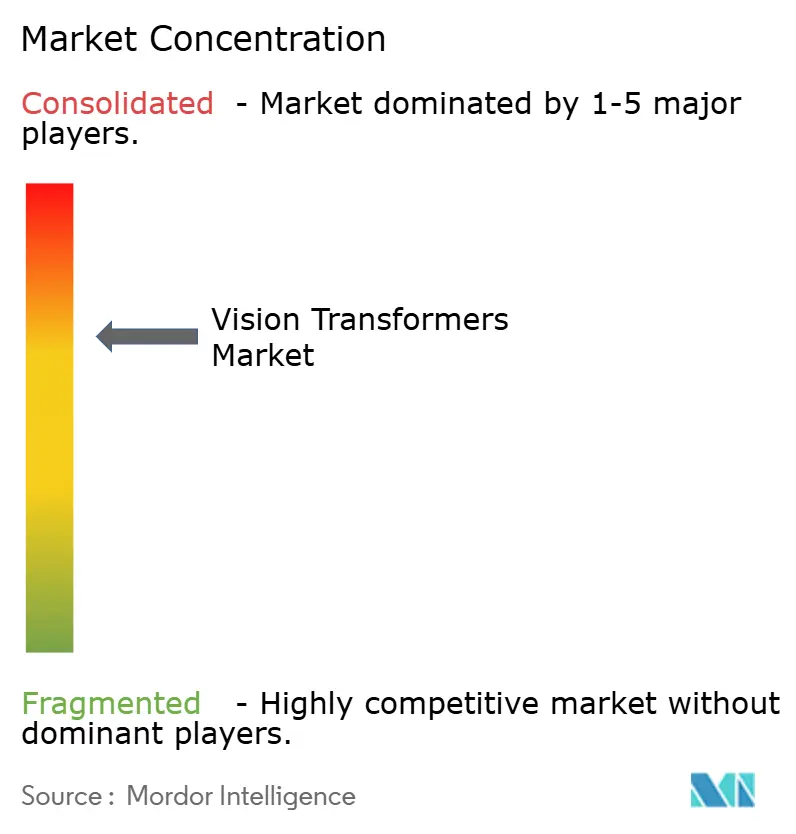
| Market Concentration | Medium |
Major Players *Disclaimer: Major Players sorted in no particular order Image © Mordor Intelligence. Reuse requires attribution under CC BY 4.0. | |
Vision Transformers Market Analysis by Mordor Intelligence
The vision transformers market size stands at USD 0.37 billion in 2025 and is expected to exceed USD 1.58 billion by 2030, expanding at a 33.67% CAGR. This acceleration reflects a 327% value jump over the period, powered by transformer architectures that capture global image context and consistently outperform legacy CNN models. Growing enterprise demand for high-resolution visual recognition, the rollout of H100/H200 GPUs, and maturing edge inference frameworks are reinforcing momentum. Competitive differentiation now pivots on optimized self-attention accelerators, open-source model releases, and cloud-edge orchestration strategies. Simultaneously, supply chain pressures around advanced packaging and high-bandwidth memory temper near-term capacity, but pricing relief is projected as capacity additions in South Korea and Taiwan come online. Expanded government AI budgets in North America, China, India, and Japan amplify funding flows into transformer-based R&D, while regulatory clarity around real-world deployment promotes broader enterprise uptake.
Key Report Takeaways
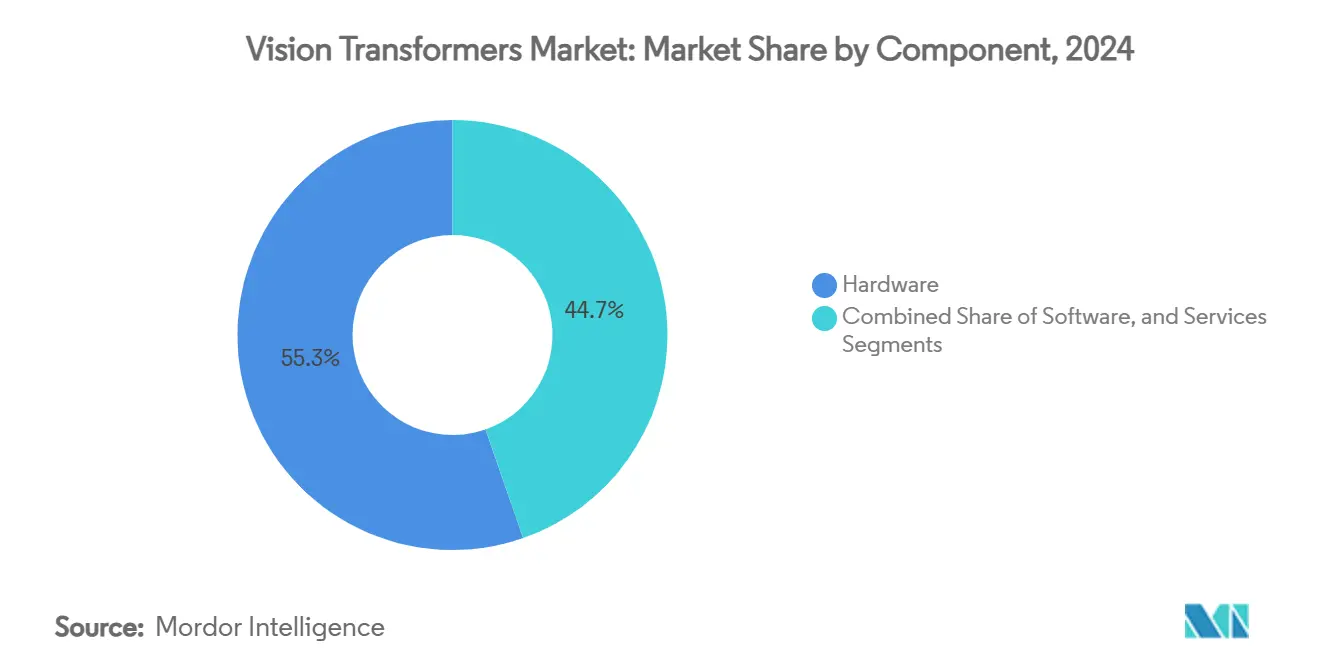
- By component, hardware led with 55.34% revenue share in 2024 while edge AI chipsets posted a 33.73% CAGR through 2030.
- By application, image classification held 46.98% of the vision transformers market share in 2024 and image captioning is projected to grow at 33.87% CAGR to 2030.
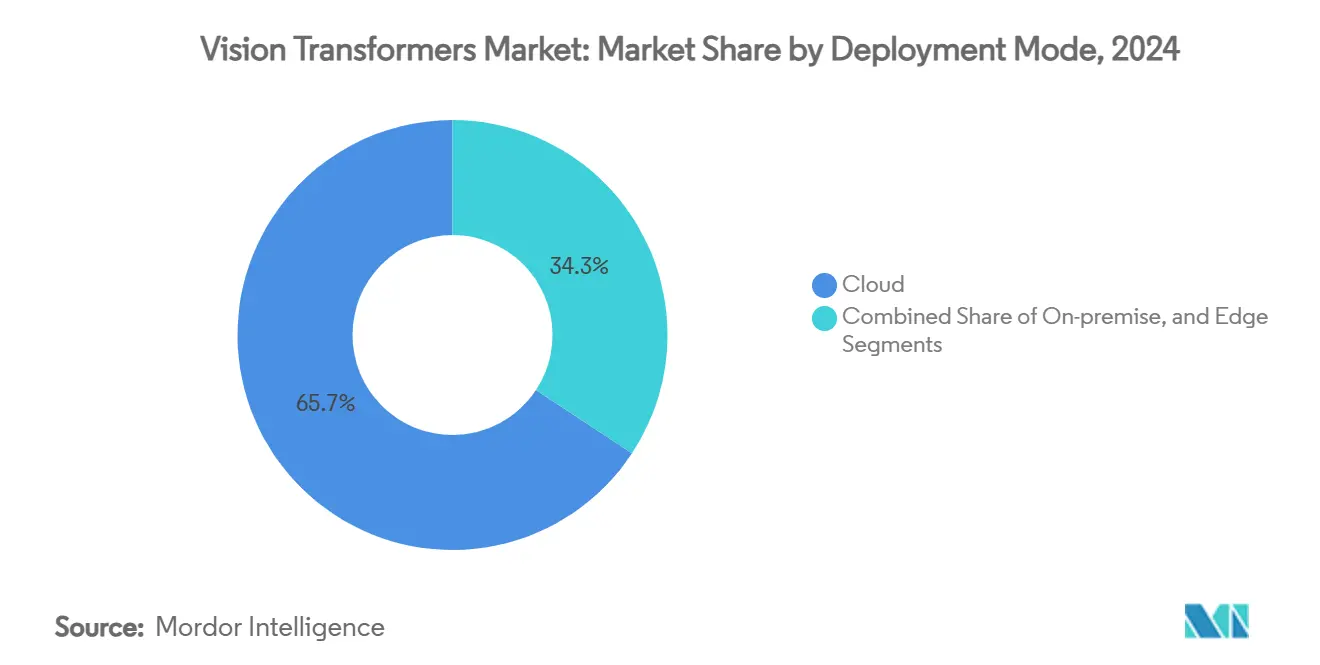
- By deployment mode, cloud platforms captured 65.74% share of the vision transformers market size in 2024; edge deployment is advancing at a 33.79% CAGR.
- By end user, healthcare and life sciences commanded 28.41% share in 2024, whereas government and defense is registering the fastest 33.94% CAGR through 2030.
- By geography, North America accounted for 38.34% of the vision transformers market in 2024, but Asia-Pacific is forecast to record a 34.17% CAGR to 2030.
Global Vision Transformers Market Trends and Insights
Drivers Impact Analysis*
| Driver | (~) % Impact on CAGR Forecast | Geographic Relevance | Impact Timeline |
|---|---|---|---|
| Mainstream adoption in image-centric AI tasks | +8.2% | North America / Europe first movers | Medium term (2-4 years) |
| Proliferation of advanced GPUs, TPUs and edge AI chips | +7.8% | US, China, Taiwan fabs | Short term (≤ 2 years) |
| Autonomous systems’ need for real-time perception | +6.9% | Global automotive and defense hubs | Medium term (2-4 years) |
| Rise of multi-modal vision-language transformer stacks | +5.4% | Global spillover to emerging markets | Long term (≥ 4 years) |
| Edge-oriented sparsity and quantization breakthroughs | +4.1% | Asia-Pacific manufacturing, North America R&D | Short term (≤ 2 years) |
| Open-source foundational ViT models lowering barriers | +3.8% | Developing markets | Medium term (2-4 years) |
| Source: Mordor Intelligence | |||
Mainstream Adoption in Image-Centric AI Tasks
Enterprise rollouts have moved beyond laboratories as businesses report significant accuracy gains in complex visual workflows. Pathology centers deploying 632-million-parameter models achieve 94.11% diagnostic sensitivity across multi-class cancer detection, accelerating decision support in oncology. [1]Shakarami, “DepViT-CAD: Deployable Vision Transformer-Based Cancer Diagnosis,” arxiv.orgManufacturers integrate attention-rich models to pinpoint minute surface defects that CNNs frequently miss, cutting manual inspection time by 38%. Financial back-office teams rely on ViT-enabled document parsing that attains 98% field-level accuracy, curbing paper-based errors and expediting invoice reconciliation. These performance gains are encouraging chief technology officers to migrate visual operations onto transformer backbones, reinforcing the vision transformers market trajectory.
Proliferation of Advanced GPUs, TPUs and Edge AI Chips
Hardware cycles are shortening as hyperscalers and system-on-chip designers unlock fresh memory bandwidth and compute density. NVIDIA H200 boards list at roughly USD 30,000 and deliver 4.8 TB/s throughput, allowing 70-billion-parameter ViTs to train in 30% fewer epochs. Concurrently, Microsoft’s Florence-2 inference stack demonstrates 15 W edge operation on Raspberry Pi-class devices, extending transformer relevance to resource-constrained endpoints.[2]Hackster.io, “Vision-Language Models at the Edge,” hackster.io High-bandwidth memory shortages remain a bottleneck but are easing as new module suppliers scale in Japan and South Korea.
Autonomous Systems’ Need for Real-Time Perception
Self-driving programs from Tesla to European truck platooning consortia rely on camera-only perception powered by lightweight ViTs that cut computational cost by 90% yet retain context precision. In defense, FPGA-accelerated ViTs enable split-second target recognition on Synthetic Aperture Radar feeds, allowing maritime patrol aircraft to differentiate combatant from civilian vessels in cluttered scenes. These latency-sensitive scenarios underscore demand for sparsified attention blocks and mixed-precision arithmetic that squeeze transformer logic into strict power budgets.
Rise of Multi-Modal Vision-Language Transformer Stacks
Developers are fusing vision transformers with large language models to unlock richer cross-domain reasoning. Microsoft’s 4.2-billion-parameter Phi-3 Vision compresses multi-modal capabilities into an edge-deployable footprint, while NVIDIA’s VILA architecture pairs ViT encoders with quantized language decoders to excel in video Q&A, outperforming larger baselines. E-commerce search engines using image-text alignment record a 4.95% click-through uplift as shoppers receive more relevant visual matches. Multi-modal traction widens the vision transformers market addressable base, touching customer service, robotics, and content moderation workflows.
Restraints Impact Analysis*
| Restraint | (~) % Impact on CAGR Forecast | Geographic Relevance | Impact Timeline |
|---|---|---|---|
| High compute cost and power draw | -4.7% | Developing economies most affected | Short term (≤ 2 years) |
| Data-hungry pre-training requirements | -3.2% | Domain-specific verticals | Medium term (2-4 years) |
| Attention-acceleration IP patent thickets | -2.1% | US and EU litigations | Long term (≥ 4 years) |
| Regulatory and security risks from transformer hallucinations | -1.8% | North America and Europe | Medium term (2-4 years) |
| Source: Mordor Intelligence | |||
High Compute Cost and Power Draw
Pricing for cloud-based H100 GPU nodes ranges between USD 2.80 and USD 10.00 per hour, pushing experimentation out of reach for smaller firms.[3]Cyfuture Cloud, “Nvidia H100 GPU Price 2025,” cyfuture.cloud Data-center energy usage also rises sharply: a 70-billion-parameter ViT can draw 1.2 MWh during a single multi-epoch training run, straining facilities that lack renewable power offsets. Organizations mitigate cost through hybrid pipelines-training in the cloud, then exporting quantized INT4 weights onto edge accelerators. Memory pooling and structured sparsity are further reducing active power, yet their adoption remains uneven across legacy infrastructure.
Data-Hungry Pre-Training Requirements
Foundational ViTs often demand millions of labeled images to generalize, a hurdle in regulated domains such as healthcare. The Virchow pathology model required 1.5 million slides to hit 0.949 AUC. Similar dataset scarcity appears in industrial inspection where proprietary imagery cannot be shared externally under non-disclosure constraints. Synthetic data pipelines help, but they entail robust validation to prevent over-fitting and hallucination. Regions with stringent data-sovereignty laws, such as the EU, face added complexity when federating training across borders, elongating development cycles and dampening the vision transformers market growth impulse.
*Our forecasts treat driver/restraint impacts as directional, not additive. The impact forecasts reflect baseline growth, mix effects, and variable interactions.
Segment Analysis
By Component: Hardware Infrastructure Drives Adoption
Hardware commanded 55.34% of 2024 revenue, underscoring how compute availability underpins the vision transformers market. Flagship H200 GPUs ship with 141 GB HBM and 4.8 TB/s bandwidth, offering 50% faster inference than predecessors and lowering iteration times for enterprises experimenting at scale. The services layer is likewise expanding as cloud vendors wrap containerized ViT pipelines into managed offerings, erasing DevOps overhead for mid-market adopters.
Edge AI chips sit at the heart of growth. At 33.73% CAGR, they convert datacenter-class intelligence into field-deployable platforms. Microsoft’s Florence-2 shows that a USD 60 single-board computer can host a sparsified ViT and sustain 20 fps inference inside a 15 W power envelope. Tight integration between silicon, firmware, and model compression methods is shaping a component ecosystem where value migrates toward vertically-optimized stacks.


By Application: Image Classification Retains Lead; Captioning Surges
Image classification retained 46.98% share as of 2024, lifted by manufacturing, retail, and medical diagnostics seeking global pixel context capture. In oncology, DepViT-CAD pushes vision transformers market size for cancer diagnostics with 94.11% sensitivity across 11 malignancies.
Image captioning, however, is the fastest grower at 33.87% CAGR. E-commerce portals embed ViT-text decoders to enrich catalog metadata, generating automated descriptions that boost product discoverability. Meanwhile, object detection segments tap transformer backbones for defense and autonomous driving, where attention layers fuse LiDAR-less camera arrays into cohesive scene understanding. Vision transformers market share in segmentation tasks is rising too, as annotation-efficient ViTs cut the cost of pixel-wise labeling.
By Deployment Mode: Cloud Dominates; Edge Accelerates
Cloud platforms held 65.74% share in 2024 thanks to pay-as-you-go GPU fleets at AWS, GCP, and Azure. On-demand access to H200 clusters priced near USD 10 an hour democratizes large-scale experimentation without upfront capex. Yet edge deployments are climbing 33.79% CAGR as robotics, smart cities, and industrial IoT demand sub-100 ms latency and data-sovereign inference.
Hybrid topologies are emerging: training remains cloud-centric, while distilled or quantized models reside on edge gateways or vehicle compute modules. Jetson-class boards execute INT4 ViTs at under 15 W, showing viable economics for battery-powered robotics. As sparsity compilers mature, edge inference throughput is projected to triple by 2027, further redistributing the vision transformers market size between cloud and on-prem footprints.
By End User: Healthcare Commands Value; Defense Leads Growth
Healthcare and life sciences account for 28.41% of 2024 spending, leveraging ViTs in radiology, pathology, and ophthalmology. The Virchow model’s 0.949 AUC across 17 cancers exemplifies how domain-specific pre-training answers stringent clinical accuracy thresholds.
Government and defense is the fastest mover at 33.94% CAGR. Maritime surveillance programs now integrate ViT-enabled SAR processing on board patrol aircraft, automating vessel classification and anomaly detection. Automotive OEMs also escalate investment as camera-only robotaxis near commercial readiness. Retail, e-commerce, and media outfits trail closely, spurred by visual search and content personalization.
Geography Analysis
North America contributed 38.34% of 2024 value. A dense cluster of GPU suppliers, cloud hyperscalers, and academic labs accelerates commercialization cycles. FDA fast-track pathways for AI-aided diagnostics further lift healthcare deployments.
Asia-Pacific posts the highest 34.17% CAGR. China’s state-backed programs funnel capital into transformer silicon startups, driving projected USD 98 billion AI spend in 2025. Japan earmarked USD 960 million for compute clusters that favor Japanese-language ViTs, and India’s IndiaAI Mission funds a sovereign 4,096-GPU supercluster.
Europe emphasizes ethical AI. The EU AI Act nudges companies toward edge-heavy deployments and federated learning, favoring privacy-preserving ViT training. Subsidies for low-carbon datacenters across Scandinavia are also attracting transformer workloads, balancing regional energy constraints.


Competitive Landscape
The vision transformers market shows moderate concentration. NVIDIA’s hardware stack drives barrier formation, yet software leadership is contested among Google (Universal Transformer patents), Microsoft (Phi-3 Vision edge models), and Meta (open-source ViT derivatives). Cloud incumbents cross-sell GPUs with turnkey DevOps, shrinking time-to-proof-of-concept.
Strategic focus is shifting to vertical models: Lockheed Martin tailors defense-grade ViTs with on-device cryptographic hardening, and emerging med-tech firms pursue FDA clearance for pathology and radiology workloads. Patent litigation around attention kernels and memory-efficient transformers creates licensing complexity that may consolidate IP under a handful of licensors.
Edge-optimized toolchains are the next battleground. Qualcomm’s cross-view attention patent and ARM-based NPU integrations aim to rival NVIDIA on low-power endpoints, while Graphcore and AMD target high-density datacenter scenarios. Strategic alliances between silicon vendors and software studios-such as Jetson-VILA bundles-will dictate value capture through 2030.
Vision Transformers Industry Leaders
NVIDIA Corporation
Google LLC (Alphabet)
Microsoft Corporation
Meta Platforms Inc.
Amazon Web Services Inc.
- *Disclaimer: Major Players sorted in no particular order

Recent Industry Developments
- July 2025: Lockheed Martin unveiled ViT-powered Synthetic Aperture Radar analytics for autonomous maritime surveillance, integrating on-board MLOps pipelines.
- July 2025: Foreign investment in Chinese AI ventures is projected to hit USD 98 billion, with startups channeling funds toward vision transformers market R&D.
- June 2025: SoftBank outlined a USD 33.2 billion allocation to OpenAI-aligned superintelligence programs, planning to embed ViTs across portfolio companies.
- June 2024: Tesla commenced robotaxi trials in Austin using camera-only ViT perception stacks for full-self-driving navigation.


Global Vision Transformers Market Report Scope
| Hardware |
| Software |
| Services |
| Image Classification |
| Image Captioning |
| Image Segmentation |
| Object Detection |
| Other Applications |
| Cloud |
| On-premise |
| Edge |
| Retail and E-commerce |
| Media and Entertainment |
| Automotive |
| Government and Defense |
| Healthcare and Life Sciences |
| Other End Users |
| North America | United States | |
| Canada | ||
| Mexico | ||
| South America | Brazil | |
| Argentina | ||
| Rest of South America | ||
| Europe | Germany | |
| United Kingdom | ||
| France | ||
| Russia | ||
| Rest of Europe | ||
| Asia-Pacific | China | |
| Japan | ||
| India | ||
| South Korea | ||
| Australia | ||
| Rest of Asia-Pacific | ||
| Middle East and Africa | Middle East | Saudi Arabia |
| United Arab Emirates | ||
| Rest of Middle East | ||
| Africa | South Africa | |
| Egypt | ||
| Rest of Africa | ||
| By Component | Hardware | ||
| Software | |||
| Services | |||
| By Application | Image Classification | ||
| Image Captioning | |||
| Image Segmentation | |||
| Object Detection | |||
| Other Applications | |||
| By Deployment Mode | Cloud | ||
| On-premise | |||
| Edge | |||
| By End User | Retail and E-commerce | ||
| Media and Entertainment | |||
| Automotive | |||
| Government and Defense | |||
| Healthcare and Life Sciences | |||
| Other End Users | |||
| By Geography | North America | United States | |
| Canada | |||
| Mexico | |||
| South America | Brazil | ||
| Argentina | |||
| Rest of South America | |||
| Europe | Germany | ||
| United Kingdom | |||
| France | |||
| Russia | |||
| Rest of Europe | |||
| Asia-Pacific | China | ||
| Japan | |||
| India | |||
| South Korea | |||
| Australia | |||
| Rest of Asia-Pacific | |||
| Middle East and Africa | Middle East | Saudi Arabia | |
| United Arab Emirates | |||
| Rest of Middle East | |||
| Africa | South Africa | ||
| Egypt | |||
| Rest of Africa | |||


Key Questions Answered in the Report
What revenue value is projected for vision transformers by 2030?
The vision transformers market size is forecast to reach USD 1.58 billion by 2030, supported by a 33.67% CAGR.
Which application currently dominates spending?
Image classification leads with a 46.98% share in 2024 owing to widespread adoption in healthcare, manufacturing, and retail visual workflows.
Why are edge deployments growing faster than cloud?
Edge inference reduces latency, lowers bandwidth costs, and eases data-sovereignty compliance, which explains its 33.79% CAGR growth pace.
Which region offers the highest growth potential?
Asia-Pacific is expected to expand at a 34.17% CAGR, propelled by large-scale government AI investments in China, India, and Japan.
How are compute costs impacting adoption?
High GPU pricing and energy draw shave roughly 4.7 percentage points off forecast CAGR, prompting firms to embrace quantization, sparsity, and hybrid cloud-edge strategies.
What sectors are emerging beyond healthcare and defense?
Retail and e-commerce adopt ViT-powered visual search, automotive firms advance camera-based autonomy, and media companies explore automated content captioning.
Page last updated on:


