
Intelligent Lighting Market Size and Share
Market Overview
| Study Period | 2020 - 2031 |
|---|---|
| Market Size (2026) | USD 5.39 Billion |
| Market Size (2031) | USD 7.81 Billion |
| Growth Rate (2026 - 2031) | 7.71 % |
| Fastest Growing Market | Asia Pacific |
| Largest Market | Europe |
| Market Concentration | Medium |
Major Players
*Disclaimer: Major Players sorted in no particular order Image © Mordor Intelligence. Reuse requires attribution under CC BY 4.0. |
|
Intelligent Lighting Market Analysis by Mordor Intelligence
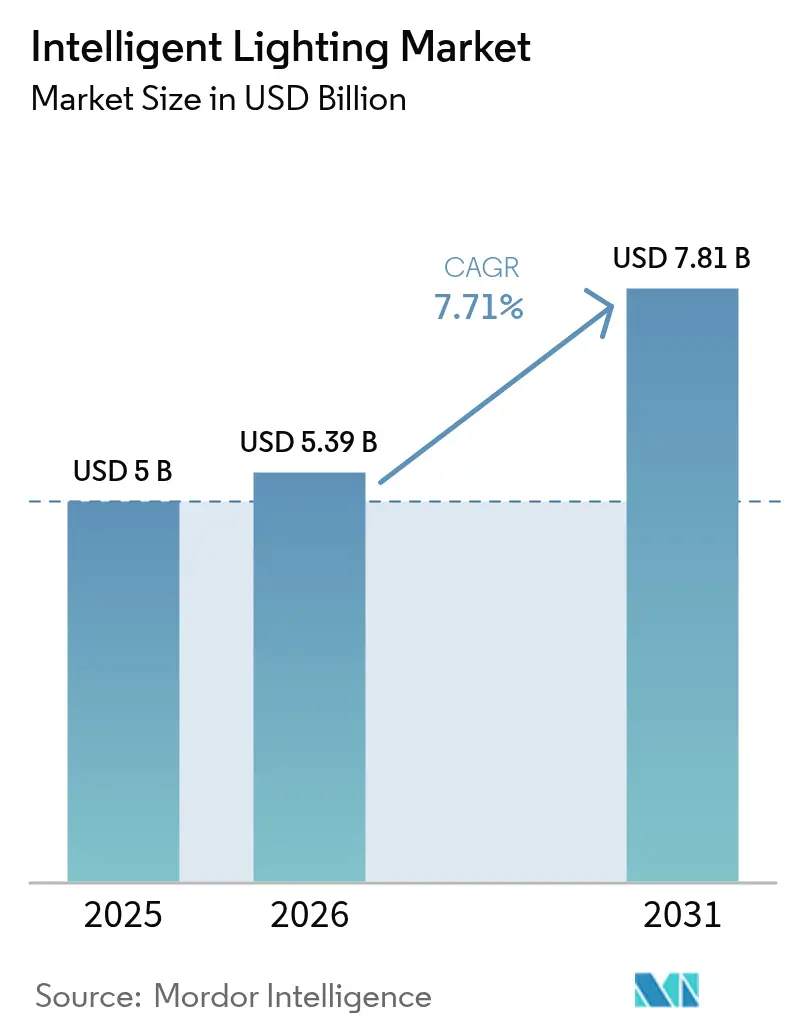
The intelligent lighting market size is expected to grow from USD 5 billion in 2025 to USD 5.39 billion in 2026 and is forecast to reach USD 7.81 billion by 2031 at 7.71% CAGR over 2026-2031. Equipment demand accelerates as mercury-containing lamps exit the market, while programmable LED systems capture share on energy savings and design flexibility. Europe’s regulatory push combines with live-event resurgence to stimulate short-term retrofits, whereas APAC’s rapid venue construction underpins long-term unit growth. Laser fixtures gain attention in outdoor spectaculars that require extremely high brightness, but LED remains the workhorse across theatres, stadia, and broadcast studios. Tariff uncertainty, component shortages, and blue-light safety caps temper momentum; nonetheless, protocol convergence and IoT-ready controls keep the intelligent lighting market on an innovation path.
Key Report Takeaways
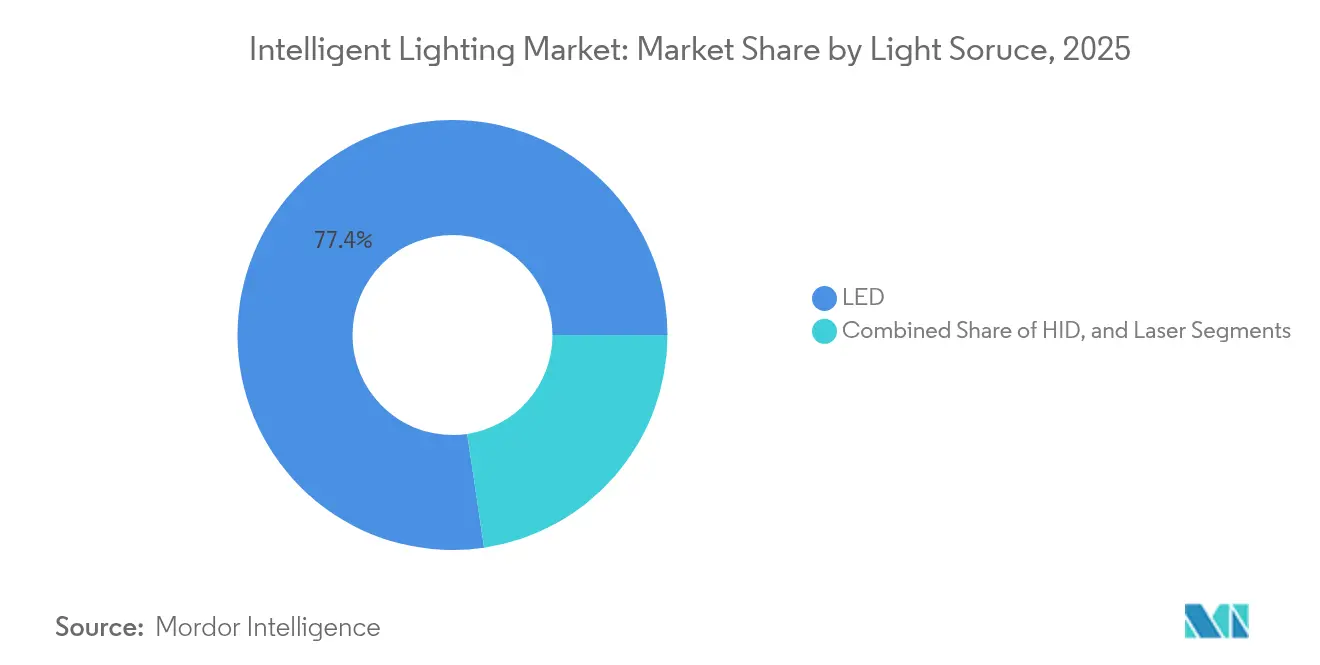
- By light source, LED commanded 77.35% of the intelligent lighting market share in 2025; laser systems are projected to expand at an 16.9% CAGR from 2026-2031.
- By fixture type, profile types held a 45.05% revenue share in 2025 in the intelligent lighting market, while beam and hybrid lights are advancing at a 11.7% CAGR to 2031.
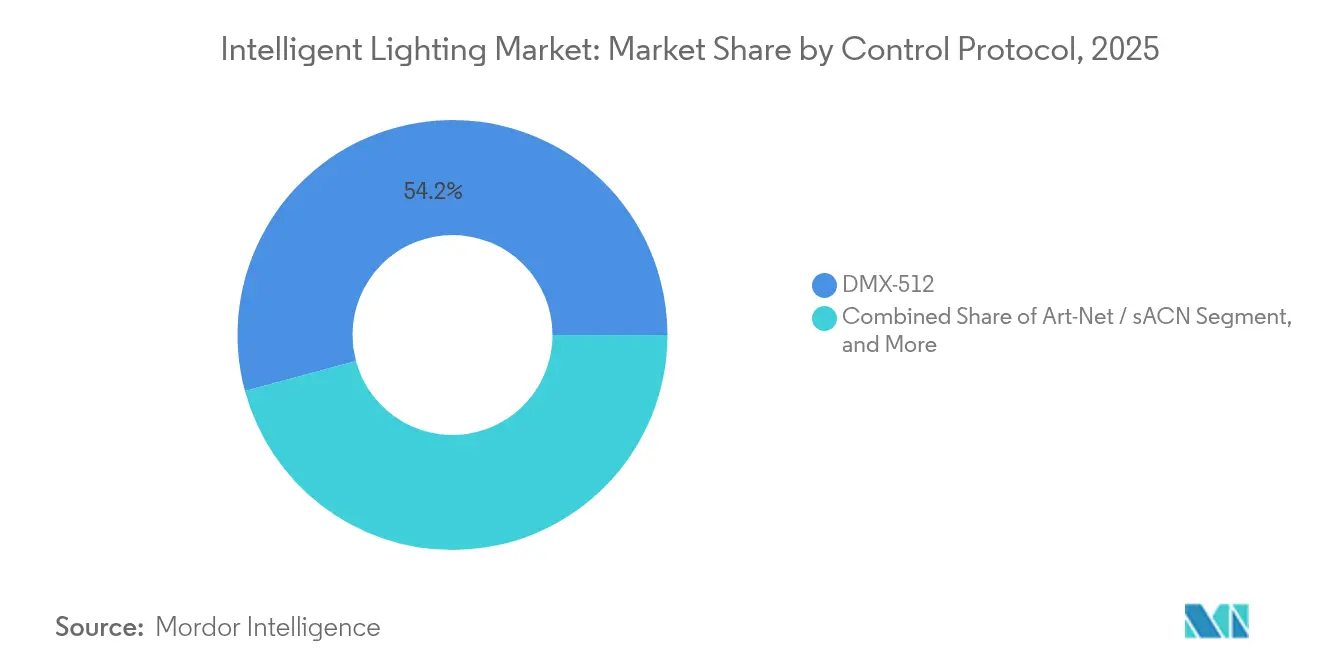
- By control protocol, DMX-512 held a 54.20% revenue share in 2025 in the intelligent lighting market, while Art-Net / sACN is advancing at a 12.4% CAGR to 2031.
- By application, indoor venues held a 59.25% revenue share in 2025 in the intelligent lighting market, while outdoor projects are advancing at a 12.2% CAGR to 2031.
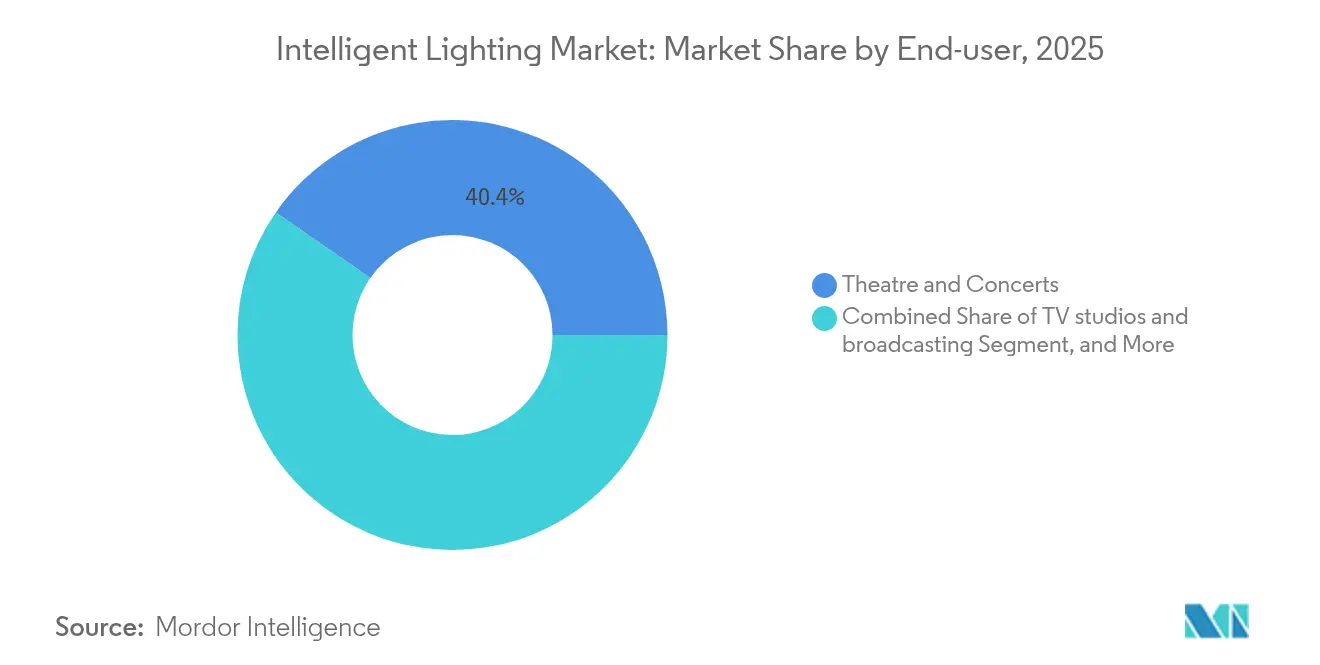
- By end-user, theatres and concerts accounted for a 40.35% slice of the intelligent lighting market size in 2025, whereas esports arenas are growing at an 16.7% CAGR during 2026-2031.
- By geography, Europe led with 32.70% share of the intelligent lighting market in 2025; APAC is forecast to register the highest regional CAGR at 9.7% through 2031.
Note: Market size and forecast figures in this report are generated using Mordor Intelligence’s proprietary estimation framework, updated with the latest available data and insights as of 2026.
Market Trends and Insights
Drivers Impact Analysis of Intelligent Lighting Market*
| Driver | (~) % Impact on CAGR Forecast | Geographic Relevance | Impact Timeline |
|---|---|---|---|
| Rapid proliferation of live events and festivals | + 2.10% | Global, strongest in North America and Europe | Medium term (2-4 years) |
| LED cost declines and energy-efficiency mandates | + 1.80% | Global, anchored by EU and North America regulations | Long term (≥ 4 years) |
| Integration of DMX and IP-based control protocols | + 1.30% | APAC core, spill-over to North America | Medium term (2-4 years) |
| Government phase-out of discharge lamps | + 1.90% | Europe primary, North America secondary | Short term (≤ 2 years) |
| Drone-light-show companion fixtures | + 0.70% | China, UAE, United States | Medium term (2-4 years) |
| Esports arena buildouts | + 1.40% | APAC lead, North America and Europe follow | Long term (≥ 4 years) |
| Source: Mordor Intelligence | |||
Rapid Proliferation of Live Events and Festivals
Global ticket sales rebounded to pre-pandemic levels, and venue operators now view programmable lighting as a revenue lever that supports premium pricing. Rental houses expand fleets of moving-head LEDs because promoters specify fixtures that can pivot from rock concerts to corporate galas without re-rigging. Large production companies embed networkable lighting into show packages, enabling creative directors to adjust looks in real time. The intelligent lighting market benefits when festivals demand power-efficient gear that can run on temporary microgrids. Distributors consolidate to guarantee same-day delivery of replacement parts, improving uptime during congested tour seasons.
LED Cost Declines and Energy-Efficiency Mandates
Average LED component prices declined by nearly 8% in 2025 as wafer yields improved and gallium-nitride devices transitioned to 6-inch substrates. The U.S. Energy Information Administration projects that LED efficiency improvements will continue as costs decline, with federal efficiency standards driving advancements in general service lighting that translate to professional applications.[1]U.S. Energy Information Administration. "LED Bulb Efficiency Expected to Continue Improving as Cost Declines." June 13, 2024. https://www.eia.gov/todayinenergy/detail.php?id=15471. Venue managers now justify upgrades by linking utility savings to shorter payback periods, often under three years. Government subsidies for energy retrofits further narrow the total cost of ownership gap against conventional rigs. Falling diode prices unlock mid-tier product lines, broadening buyer access throughout the intelligent lighting market.
Integration of DMX and IP-Based Control Protocols
Traditional DMX-512 protocols are now converging with IP-based systems such as Art-Net and sACN. This evolution not only paves the way for expansive installations but also ensures compatibility with pre-existing equipment investments. Due to this protocol advancement, lighting designers can now manage thousands of fixtures using standard network infrastructures. This shift simplifies installations and lessens maintenance demands. Furthermore, cutting-edge control systems, bolstered by protocols like ams OSRAM's Open System Protocol (OSP), can now oversee up to 1,000 devices, driving innovation in both automotive and architectural lighting sectors.[2]ams OSRAM. "Automotive Engineering Exposition 2024." January 1, 2025. https://ams-osram.com/news/press-releases/automotive-engineering-exposition-2024. Manufacturers add embedded web servers so facilities staff can retrieve energy reports through building-management dashboards. These capabilities raise switching costs for customers, further entrenching intelligent control ecosystems.
Government Phase-Out of Discharge Lamps
The European Union banned most mercury-containing lamps from December 31 2025, compelling venues to replace fluorescent work-lights and metal-halide follow-spots.[3]European Commission. "Revised Mercury Regulation enters into force." July 30, 2024. https://environment.ec.europa.eu/news/revised-mercury-regulation-enters-force-2024-07-30_en. Suppliers halted tube production months ahead of the deadline, tightening supply and accelerating LED conversions. Similar directives in Canada and several U.S. states widen the addressable pool of fixtures eligible for rebates. Leading manufacturers highlight reduced hazardous-waste disposal fees when pitching retrofit projects. The policy backdrop therefore injects mandatory demand into the intelligent lighting market at a time when discretionary spending could otherwise soften.
Restraints Impact Analysis of Intelligent Lighting Market*
| Restraint | (~) % Impact on CAGR Forecast | Geographic Relevance | Impact Timeline |
|---|---|---|---|
| High up-front CAPEX shifts users to rental | −1.20% | Global, sharpest in emerging economies | Short term (≤ 2 years) |
| Semiconductor/optics supply-chain volatility | −0.90% | Global, acute in APAC manufacturing hubs | Medium term (2-4 years) |
| Blue-light hazard regulation caps lumen output | −0.40% | Europe, North America | Long term (≥ 4 years) |
| Programming skills gap in emerging economies | −0.80% | APAC, South America, MEA | Long term (≥ 4 years) |
| Source: Mordor Intelligence | |||
High Up-Front CAPEX Shifts Users to Rental Models
A 2,000-seat theatre often faces a USD 1.2 million bill to replace its aging rig with networkable LED moving lights and consoles. Smaller operators lack balance-sheet capacity, so they choose rental packages that spread expense over an event calendar. Rental companies enjoy higher utilization but must refresh inventory every three years to stay current, which raises their own capital needs. Fixture OEMs respond by launching pay-per-use programs bundled with predictive maintenance, yet adoption remains slow outside North America and Europe. The shift temporarily suppresses unit shipments even as it sustains utilization of installed bases.
Semiconductor/Optics Supply-Chain Volatility Constrains Production
Silicon-carbide wafer shortages extend lead times for high-power laser engines beyond 40 weeks, hampering deliveries to stadium projects booked for major global tournaments. Optical glass blank prices rose 12% year-over-year after furnace outages in key Japanese plants. Manufacturers dual-source LED drivers to Vietnam and India, but new fabs still rely on critical tools imported from the same constrained suppliers. Elevated inventory buffers tie up working capital and force list-price revisions, slowing contract closures in price-sensitive segments such as municipal lighting retrofits.
*Our forecasts treat driver/restraint impacts as directional, not additive. The impact forecasts reflect baseline growth, mix effects, and variable interactions.
Intelligent Lighting Market Segment Analysis
By Light Source:
LED Continues to Dominate While Laser Gains MomentumLED technology commands 77.35% market share in 2025, reflecting its established position in intelligent lighting applications through superior energy efficiency, programmable control capabilities, and declining costs. However, laser-based systems emerge as the fastest-growing segment with 16.9% CAGR through 2031, driven by applications requiring extreme brightness levels and precise beam control in large venues and outdoor installations. HID systems maintain relevance in specific high-output applications where color rendering and intensity requirements exceed current LED capabilities, though their market share continues declining as LED technology advances. The laser segment benefits from innovations in solid-state laser design and improved safety systems that enable deployment in occupied spaces.
Patent developments demonstrate the technological sophistication driving laser adoption, with ams OSRAM's SPL S8L91A_3 A01, a high-performance 8-channel 915nm SMT pulsed laser in a QFN package, delivering 1000 watts peak optical power for LiDAR applications, showcasing the precision control possible with laser technology. The convergence of laser technology with intelligent control systems creates opportunities for applications requiring both high brightness and precise spatial control. Manufacturing advances in laser diode efficiency and thermal management expand the addressable market for laser-based intelligent lighting systems. The segment's growth trajectory reflects the industry's evolution toward application-specific solutions that optimize performance characteristics for demanding environments.



By Fixture Type:
Profile Lights Lead Versatility DemandProfile lights maintain the largest market share among fixture types in 2025, valued for their versatility in creating precise beam shapes and patterns essential for theatrical and architectural applications. Spotlights serve specialized applications requiring intense, focused illumination, while wash lights provide broad, even coverage for general area lighting needs. Beam and hybrid lights represent the fastest-growing fixture category, combining multiple lighting functions in single units that reduce installation complexity and equipment costs for venue operators. The hybrid approach reflects user preferences for flexible systems that adapt to diverse lighting requirements without extensive equipment changes.
Technological innovations in fixture design emphasize modularity and programmability, with manufacturers developing systems that combine multiple light sources and control mechanisms in compact form factors. The EVIYOS 2.0 from ams OSRAM exemplifies this trend, offering 25,600 individually controllable LEDs in automotive applications. Advanced optical systems enable precise beam control and color mixing that previously required multiple fixtures, improving installation efficiency and reducing maintenance requirements. The fixture type evolution reflects the industry's movement toward integrated solutions that maximize functionality while minimizing physical footprint and power consumption.
By Control Protocol:
DMX Legacy Meets IP InnovationDMX-512 protocol maintains dominance in 2025 due to its established ecosystem and widespread compatibility with existing equipment installations, though IP-based protocols like Art-Net and sACN capture increasing market share through scalability advantages. Ethernet-based proprietary systems serve specialized applications requiring custom functionality or enhanced security features, particularly in permanent installations where protocol optimization justifies development costs. The protocol landscape reflects the industry's transition from point-to-point control systems toward networked architectures that enable remote management and integration with building automation systems.
The integration of traditional lighting protocols with modern network infrastructure creates opportunities for enhanced functionality while maintaining backward compatibility with existing equipment investments. Patent developments in optical systems demonstrate the sophistication of next-generation control integration, with innovations in micro-LED design and light extraction efficiency enabling more precise control over individual light sources. Advanced control protocols support features like automated color calibration, predictive maintenance alerts, and energy optimization that reduce operational costs for venue operators. The protocol evolution enables lighting systems to participate in broader IoT ecosystems, creating value through data collection and analysis capabilities that inform operational decisions.
By Application:
Indoor Venues Dominate While Outdoor AcceleratesIndoor venues command 59.25% market share in 2025, reflecting the concentration of intelligent lighting deployments in controlled environments where precise lighting control creates competitive advantages for entertainment and commercial applications. Outdoor applications, including stadia and concerts, demonstrate 12.2% CAGR growth through 2031, driven by infrastructure investments in large-scale entertainment venues and the unique requirements of weather-resistant, high-brightness systems. The application divide reflects different technical requirements, with indoor systems prioritizing color accuracy and programmability while outdoor systems emphasize brightness, durability, and weather resistance.
The outdoor segment benefits from technological advances in LED efficiency and thermal management that enable reliable operation in challenging environmental conditions. Innovations like ams OSRAM's digital light technology utilizing microLED arrays enable precise control of light output in high-brightness applications, with volume production now supporting automotive adaptive driving beam headlamps that translate to outdoor entertainment applications. Weather-resistant fixtures incorporate advanced sealing and thermal management systems that maintain performance across temperature and humidity ranges. The application evolution reflects the industry's expansion beyond traditional indoor entertainment toward large-scale outdoor installations that require specialized engineering solutions.
By End-User:
Traditional Venues Anchor Market While Esports Drives GrowthTheatres and concerts command 40.35% market share in 2025, reflecting the established demand from traditional entertainment venues that prioritize lighting quality and programmability for artistic expression and audience engagement. TV studios and broadcasting facilities represent a stable segment requiring precise color rendering and consistent illumination for professional content production, while commercial and architectural spaces increasingly adopt intelligent lighting for energy management and aesthetic enhancement.
Esports arenas emerge as the fastest-growing end-user segment with 16.7% CAGR through 2031, driven by competitive gaming's explosive popularity and the unique requirements for immersive lighting that synchronizes with gameplay and audience experiences. Other end-users, including corporate events and temporary installations, contribute to market diversity through rental demand and specialized applications.
Geography Analysis
Europe Intelligent Lighting Market
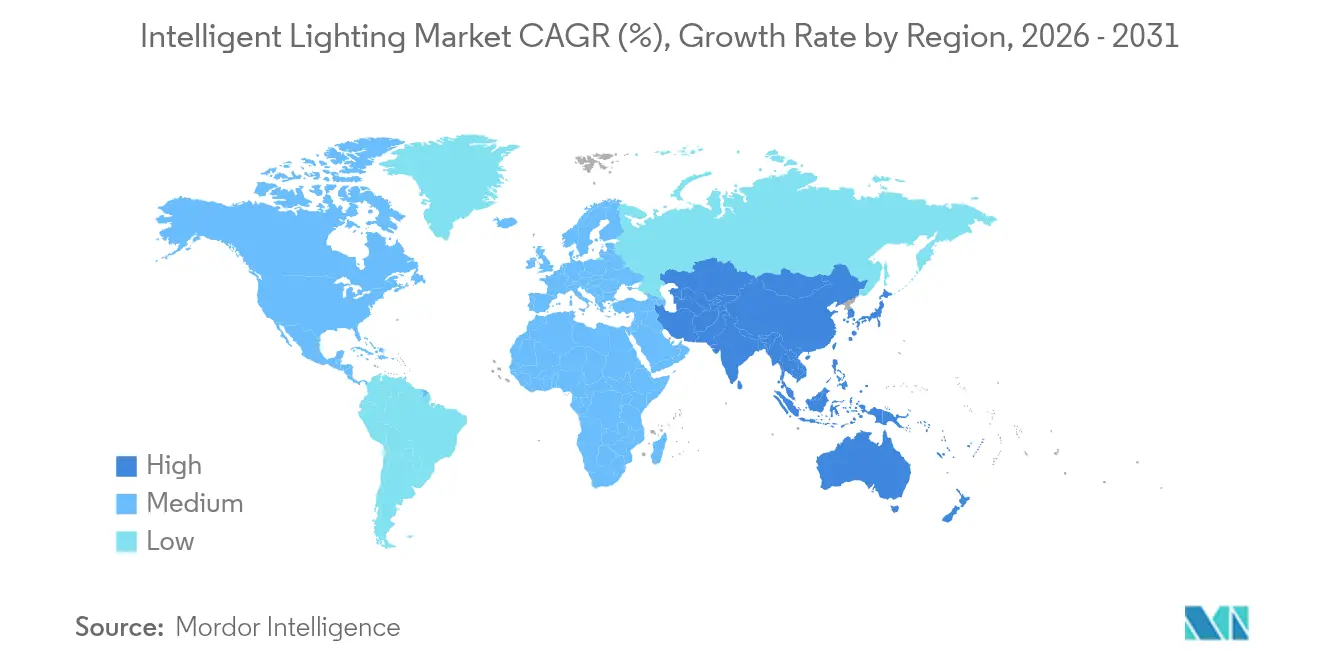
Europe maintains market leadership with 32.70% share in 2025, driven by stringent energy efficiency regulations and the phase-out of mercury-containing lamps that create substantial replacement demand for intelligent LED systems. The region's mature entertainment infrastructure and regulatory framework supporting energy-efficient technologies provide stable demand for advanced lighting solutions. Germany leads European adoption through its strong automotive and entertainment industries, while the UK benefits from its established theatre and broadcasting sectors that prioritize lighting quality and flexibility. The EU's Ecodesign requirements for light sources, covering nearly 11 billion lamps in use across Europe as of 2020, create sustained replacement opportunities as the market shifts toward LED technology.
APAC Intelligent Lighting Market
Asia-Pacific emerges as the fastest-growing region with 9.7% CAGR through 2031, reflecting rapid infrastructure development and increasing entertainment venue construction across China, Japan, and India. China's implementation of 8 new lighting standards starting January 2024, including performance requirements for reading lamps and energy efficiency standards for fluorescent lamps, demonstrates the regulatory support driving market expansion. Japan's lighting applications are expected to includes smart city applications that incorporate intelligent lighting systems and drive its demand. The region benefits from strong manufacturing capabilities and growing domestic demand for entertainment and commercial lighting applications.
North America Intelligent Lighting Market
North America represents a significant market segment driven by venue modernization and the adoption of energy-efficient technologies, though growth rates moderate compared to Asia-Pacific due to market maturity. The region's entertainment industry leadership and early adoption of intelligent lighting technologies create stable demand for advanced systems. Strategic partnerships like NYPA's collaboration with Signify to connect half a million streetlights demonstrate the scale of infrastructure modernization projects that incorporate intelligent lighting systems. However, trade tensions and tariff implementations create cost pressures that may moderate growth rates as companies adjust supply chain strategies to mitigate tariff impacts.

Regulatory Landscape
Regulation increasingly shapes intelligent lighting design and market access, particularly in Europe. The European Union banned most mercury-containing lamps from December 31, 2025, which accelerates the replacement of fluorescent and metal-halide systems with programmable LED solutions in professional venues. In parallel, the EU established the Ecodesign for Sustainable Products Regulation, Regulation (EU) 2024/1781 (June 2024). This expands the compliance lens from energy performance to life-cycle aspects, including durability, reparability, and sustainability documentation for products placed on the EU market.
In the United States, federal oversight centers on energy conservation standards and SSL technology programs. In February 2026, the U.S. Department of Energy published a final determination that energy conservation standards for metal halide lamp fixtures do not require amendment at that time, keeping the 2017 requirements in place and providing near-term regulatory stability for legacy high-intensity categories while LED and networked controls continue to advance under DOE solid-state lighting initiatives. Across regions, additional safety and blue-light hazard constraints remain a design consideration for high-luminance fixtures, reinforcing the need for optical safety engineering alongside performance gains.
Value Chain Analysis
The intelligent lighting value chain starts with upstream materials and semiconductor inputs, including LED emitters, drivers, sensors, optics, and control electronics. Dependencies extend to gallium nitride substrates and rare-earth phosphor processing, with major emitter and electronics production concentrated in China, Taiwan, and South Korea. Final luminaire and system assembly frequently occurs in hubs such as Malaysia and Mexico, supporting proximity to end markets and risk diversification. Control and interoperability requirements also pull in standards ecosystems and certification bodies, covering DMX-512/RDM for entertainment, IP-based protocols (Art-Net/sACN), and building-centric frameworks such as IEC 62386 (DALI-2) managed through the Digital Illumination Interface Alliance certification program.
Midstream participants include luminaire OEMs, console and control-platform vendors, and system integrators who design, commission, and maintain installations for theatres, stadia, broadcast, and architectural projects. Downstream, go-to-market routes split among electrical distributors (notably in North America), professional AV and lighting integrators (common in Europe), and public or municipal tender channels in parts of APAC. The chain faces recurring bottlenecks in semiconductors and optics. Smart and connected lighting modules rely on embedded memory and compute, and disruptions in logistics or component availability can extend lead times for high-power fixtures, while also increasing freight and inventory carrying costs for OEMs and rental fleets.
Competitive Landscape
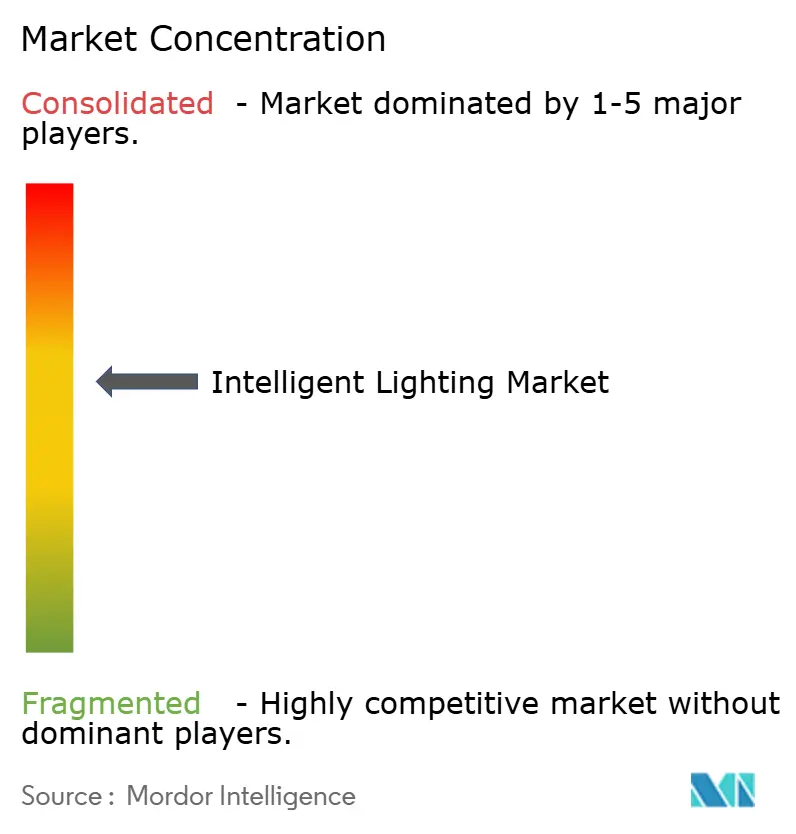
The intelligent lighting market exhibits moderate concentration with established players maintaining market positions through technological differentiation and comprehensive product portfolios rather than aggressive price competition. Industry consolidation accelerates through strategic acquisitions, with electrical distributors like Sonepar acquiring Echo Electric Supply and Robertson Electric Wholesale to strengthen distribution networks, while Mayer's acquisition of Electrical Supplies demonstrates the importance of distribution channel control in market access. Companies pursue vertical integration strategies to control supply chains and differentiate through proprietary technologies, as evidenced by the lighting industry's USD 2.4 billion smart lighting market projection that drives M&A activity focused on technology acquisition and market expansion.
Strategic partnerships emerge as a key competitive strategy, with collaborations like Siemens, Enlighted, and Zumtobel Group's partnership advancing smart building solutions through integrated IoT lighting systems. Patent activity intensifies around micro-LED technology and advanced optical systems, with companies like Meta developing micro-LED designs for high light extraction efficiency and Microsoft advancing micro-cavity micro-LED pixel designs for AR/VR applications. The competitive landscape reflects the industry's evolution toward technology-driven differentiation, with companies investing in R&D capabilities and strategic partnerships to maintain market positions as traditional lighting transitions to intelligent systems.
Intelligent Lighting Industry Leaders
-
Coemar Lighting Srl
-
Signify
-
Martin Professional
-
Robe Lighting
-
GLP German Light Products
- *Disclaimer: Major Players sorted in no particular order
Intelligent Lighting Market Companies Covered in this Report
- Signify
- Martin Professional
- Chauvet and Sons
- Robe Lighting
- GLP German Light Products
- Coemar Lighting
- High End Systems
- Clay Paky
- PR Lighting
- ADJ Products
- ETC Electronic Theatre Controls
- Avolites
- MA Lighting
- Guangzhou Guanghong Stage Lighting
- GTD Lighting
- Elation Professional
- Showtec
- Rosco Laboratories
- Vari-Lite
- Luxibel

Market Opportunities and Future Outlook
Policy-driven replacement and sustainability compliance create clear whitespace in retrofit-heavy regions, especially where mercury-containing sources are exiting the installed base. The EU ban on most mercury-containing lamps effective December 31, 2025 is already forcing venue operators and facility owners to prioritize LED conversions. The EU Ecodesign for Sustainable Products Regulation, Regulation (EU) 2024/1781, raises the bar for durability and reparability, which creates opportunities for OEMs that can document life-cycle performance and provide serviceable, upgrade-friendly platforms. At the same time, the control-protocol mix (DMX-512 alongside Art-Net/sACN) supports hybrid deployments that protect existing investments while enabling larger, networked systems, which is useful in venues that need to scale fixture counts and add monitoring without replacing entire rigs.
Opportunities also extend to regional manufacturing and supply-chain localization as buyers and governments emphasize resilience and faster delivery. Signifys July 2024 joint venture in Egypt to build a regional manufacturing base, along with its March 2025 proposal with Dixon Technologies to manufacture lighting in India, illustrates how large suppliers are building local footprints that can shorten lead times and match country-specific procurement preferences. In the Middle East, Hansa Green Technology announced an expansion at Hamriyah Free Zone in February 2025 to reach production capacity of over one million LED lighting fixtures annually, supporting regional availability for commercial and infrastructure projects. In parallel, stricter system-level requirements for networked lighting controls, including energy monitoring and integration into external systems, increase demand for interoperable controllers, commissioning tools, and services that reduce the programming-skills burden for end users and integrators.
Recent Industry Developments in Intelligent Lighting Market
- February 2026: Martin Professional introduced the Martin Macula remote follow spot system, a brand-agnostic platform designed to enable standard moving lights to function as precision-controlled tracking fixtures. The launch expands intelligent control use cases in theatres, concerts, and broadcast environments by decoupling follow-spot performance from a single fixture brand. It also reinforces the shift toward modular, network-ready control layers that can be added to existing inventories.
- June 2025: Signify launched Pineapple CoRE with Pineapple Partnerships and Schneider Electric to support decarbonization programs in the commercial and industrial property sector, initially focused on the UK. The initiative links lighting upgrades with broader building energy and automation programs, strengthening demand for connected controls and measurement capabilities. It also positions lighting suppliers closer to decision makers in multi-site retrofit projects.
- July 2024: Signify and GILA Al Tawakol Electric launched Signify Gila Lighting Technologies, a joint venture in Egypt in which Signify retained a 60% equity stake. Establishing a regional manufacturing base supports faster delivery and localization for Africa and nearby markets, which can be important for large projects with tight commissioning windows. The move also diversifies supply options as component and logistics volatility continues to influence availability.


Intelligent Lighting Market Report Scope and Research Methodology
Market Definition and Coverage
For this methodology, the intelligent lighting market is counted as the revenue generated from lighting solutions that automatically adjust output using controls, connectivity, and sensing (such as occupancy and daylight) across indoor and outdoor installed locations.
Scope exclusions: We exclude conventional lamps and fixtures that do not have intelligent control capability, and we also exclude standalone building management systems unless the value is sold as part of the lighting solution.
Segments Covered in This Report
-
By Light Source
- LED
- HID
- Laser
-
By Fixture Type
- Profile lights
- Spot lights
- Wash lights
- Beam and hybrid lights
-
By Control Protocol
- DMX-512
- Art-Net / sACN
- Ethernet-based proprietary
-
By Application
- Indoor venues
- Outdoor (stadia, concerts)
-
By End-user
- Theatres and concerts
- TV studios and broadcasting
- Commercial and architectural spaces
- Other End-user
-
By Geography
-
North America
- United States
- Canada
- Mexico
-
South America
- Brazil
- Argentina
- Rest of South America
-
Europe
- United Kingdom
- Germany
- France
- Italy
- Spain
- Rest of Europe
-
Asia Pacific
- China
- Japan
- India
- South Korea
- Australia and New Zealand
- Southeast Asia
- Rest of Asia Pacific
-
Middle East and Africa
-
Middle East
- Saudi Arabia
- United Arab Emirates
- Turkey
- Rest of Middle East
-
Africa
- South Africa
- Nigeria
- Kenya
- Rest of Africa
-
Middle East
-
North America
Data Sources, Market Sizing, and Validation
Desk Research
Desk research was used to set the market boundary, build the initial demand signals, and anchor key assumptions around technology adoption. We reviewed public statistics and standards information that help explain where intelligent lighting is being specified and where retrofit activity is visible, which then supports realistic penetration rates.
Common inputs came from sources such as the US Department of Energy efficiency and lighting publications, International Energy Agency energy indicators, Eurostat construction and electricity data series, UN Comtrade trade statistics for lighting-related categories, and technical documents from standards bodies such as IEC and CIE. We also used public company filings, investor presentations, reputable press coverage, and a paid subscription for company financials and news to sanity-check supplier exposure and timing of major product cycles. These sources are illustrative, and many other public references were also used for collection, validation, and clarification during the work.
Primary Interviews and Surveys
Primary work was used to pressure-test what we saw in desk research, especially around pricing progression, typical retrofit scope, and how controls are bundled with luminaires versus sold separately. We spoke with a mix of manufacturers, channel partners, and project-side stakeholders, and we covered demand conditions across APAC, EMEA, and the Americas so regional adoption patterns could be compared on a like-for-like basis.
Distribution of primary research fieldwork respondents
| Company type | Respondent position | Region |
|---|---|---|
| Top tier: 28% | CXOs: 16% | APAC: 47% |
| Mid tier: 52% | Functional/Unit leaders: 38% | EMEA: 30% |
| Smaller Players: 20% | Managers: 46% | Americas: 23% |
Market-Sizing & Forecasting
Sizing was built using a top-down approach where construction activity, retrofit intensity, and the installed base of connected building infrastructure are used to reconstruct the reachable demand pool for intelligent lighting, and then a value conversion is applied through adoption rates and typical system pricing. To keep the model grounded, the outputs were cross-checked with selective bottom-up approximations, including sampled supplier revenue exposure, channel feedback on shipment momentum, and project-level checks using average selling price times estimated unit volumes.
Inputs that matter in this market include the share of LED upgrades within renovation cycles, penetration of connected controls in commercial buildings, typical sensor density by floor area, average project size by end-use, and protocol-related deployment patterns that influence bill-of-material cost. For forecasting, we used scenario analysis supported by a simple multivariate regression on construction indicators and energy cost signals, and then we adjusted the forward curve with expert views on procurement lead times and control-bundling trends. When bottom-up checks had gaps, the missing pieces were handled using conservative proxy ratios from similar end-use settings and then re-tested in interviews before finalizing the totals.
Data Validation & Update Cycle
Validation was done in multiple passes so that outliers were not carried into the final number. Model outputs were compared against independent signals such as renovation cycles, electricity price direction, and the pace of connected building deployments, and then variances were reviewed before sign-off.
If a data point moved the total more than expected, we revisited the assumption, checked currency timing, and re-contacted a small set of sources to confirm the direction. Reports are refreshed annually, and interim updates are made when material events occur that can shift demand or pricing. Before delivery, the latest public releases are reviewed again so the final view reflects the most recent market conditions.
Mordor Intelligence's Intelligent Lighting Market Size Versus Other Published Estimates
Published market sizes can differ even when the topic name looks the same, because the scope line between intelligent lighting, smart lighting, and lighting controls is not drawn consistently. Differences also come from the base year used, the way prices are trended forward, and whether figures are refreshed after major changes in component costs or construction activity.
The key gap drivers in this market are what gets counted as part of the lighting system (controls bundled inside luminaires versus standalone controls), whether consumer smart bulbs are mixed with professional projects, and how retrofit demand is estimated from building activity rather than assumed at a flat rate. Currency conversion timing and the treatment of regional adoption (especially APAC acceleration versus slower retrofit cycles in some mature markets) can also shift totals by a wide margin.
Benchmark comparison
| Source | Market Size | Gaps in Research Methodology |
|---|---|---|
| Mordor Intelligence | USD 5.39 B (2026) | |
| Regional Consultancy A | USD 12.40 B (2024) | Uses an earlier base year and appears to include a broader mix of smart bulbs, fixtures, and controls across consumer and professional settings, which expands the counted demand pool compared with a project-led definition. |
| Global Consultancy B | USD 10.70 B (2024) | The title is focused on intelligent lighting control systems, which can pull in sensors, software, and control layers that may be priced and counted even when the lighting hardware is excluded or treated separately. |
The table points to a spread that is mainly explained by scope and year. In Mordor Intelligence's model, the 2026 value is tied to intelligent lighting solutions rather than the wider lighting controls stack, and the pricing curve is checked against project mix and retrofit patterns so the number stays traceable to clear adoption and ASP assumptions.


Key Questions Answered in the Report
What is the current size of the intelligent lighting market?
The intelligent lighting market is valued at USD 5.39 billion in 2026 and is projected to climb to USD 7.81 billion by 2031.
Which region is growing the fastest?
APAC leads growth with a projected 9.7% CAGR between 2026-2031, propelled by new entertainment venues and supportive national standards.
Why are laser fixtures gaining attention?
Laser systems are registering an 16.9% CAGR because they deliver extreme brightness and precise beams required in large outdoor spectacles.
How are regulations influencing technology choices?
The European Union’s ban on most mercury-containing lamps effective December 31 2025 is accelerating LED retrofits across professional venues.
What financing model is popular among small venues?
Many mid-size theatres and clubs now prefer rental or pay-per-use arrangements to avoid the high up-front capital expense of owning intelligent lighting rigs.
Are supply-chain issues still affecting deliveries?
Yes, semiconductor and optics shortages are lengthening lead times to 40 weeks for certain high-power fixtures, tightening availability heading into major global events.
Page last updated on:


 Your data is secure and never sold or shared.


