Night Vision Devices Market Size and Share
Market Overview
| Study Period | 2020 - 2031 |
|---|---|
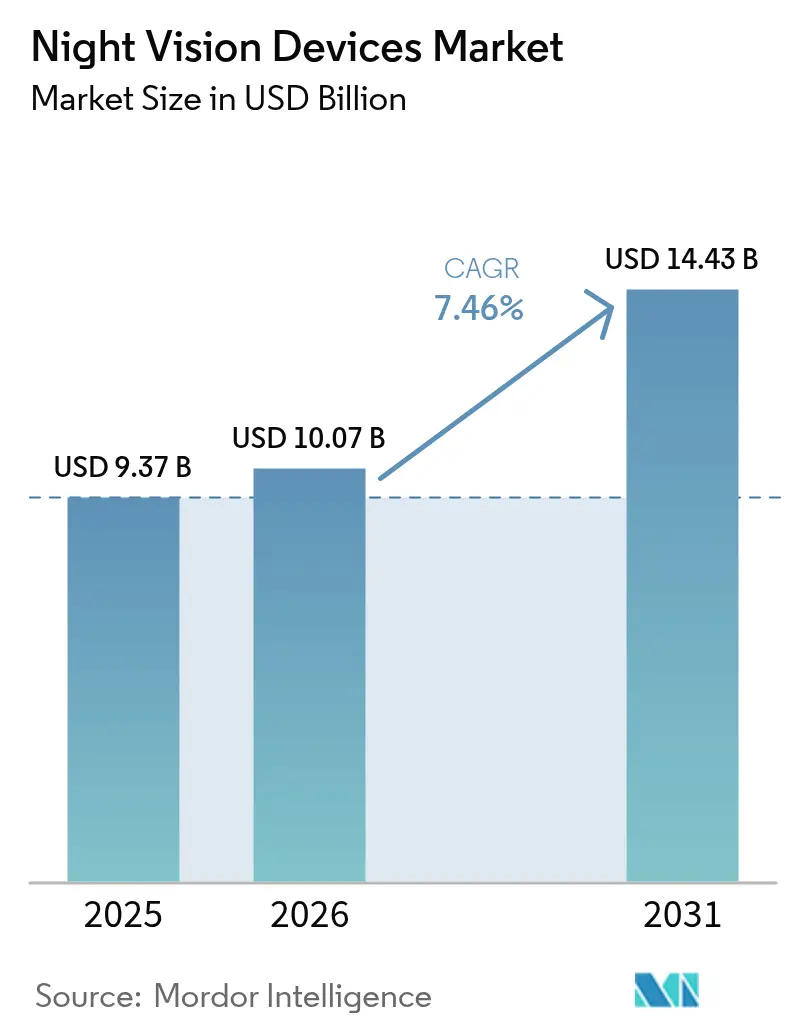
| Market Size (2026) | USD 10.07 Billion |
| Market Size (2031) | USD 14.43 Billion |
| Growth Rate (2026 - 2031) | 7.46% CAGR |
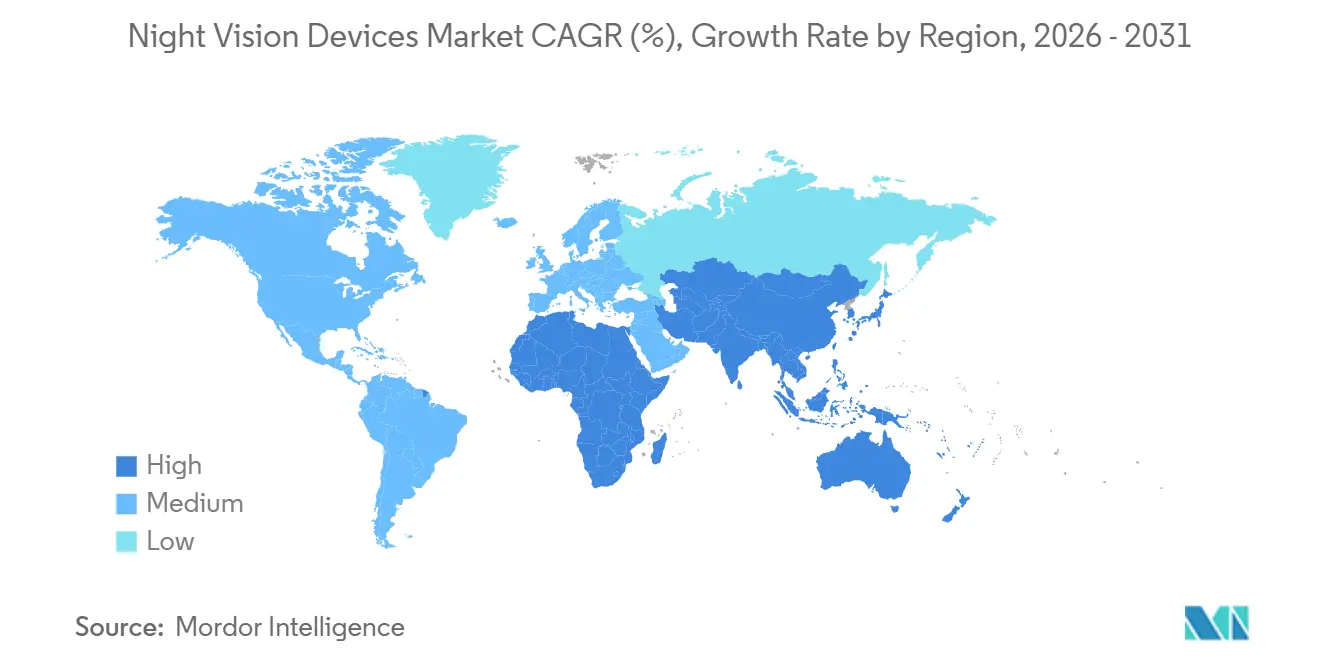
| Fastest Growing Market | Asia Pacific |
| Largest Market | North America |
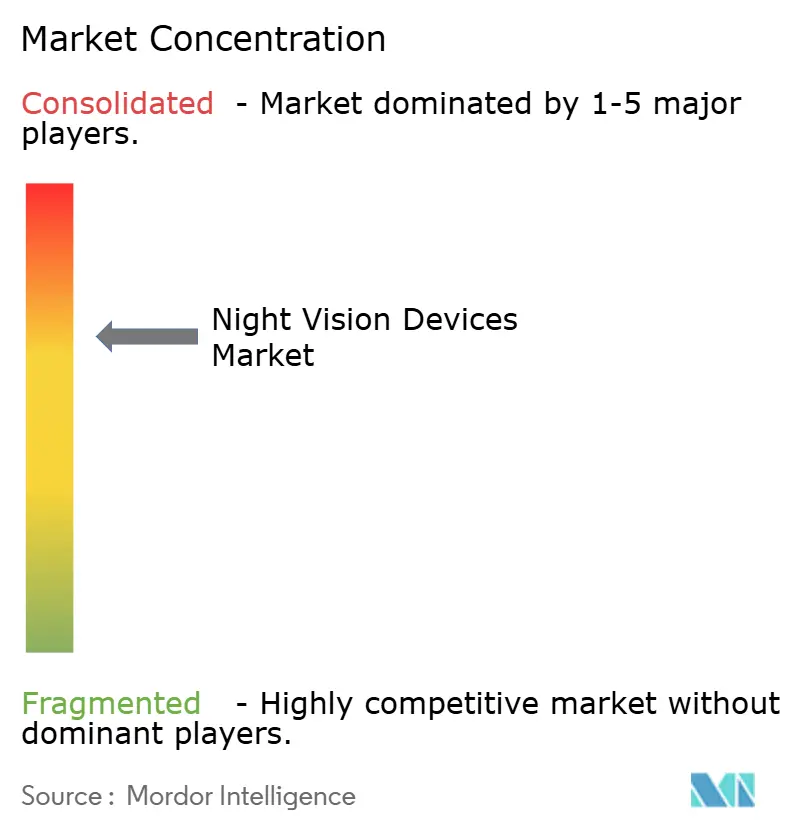
| Market Concentration | Medium |
Major Players *Disclaimer: Major Players sorted in no particular order Image © Mordor Intelligence. Reuse requires attribution under CC BY 4.0. | |
Night Vision Devices Market Analysis by Mordor Intelligence
The night vision devices market size is projected to expand from USD 9.37 billion in 2025 and USD 10.07 billion in 2026 to USD 14.43 billion by 2031, registering a CAGR of 7.46% between 2026 and 2031. Sustained procurement for soldier-vision modernization, widening adoption in municipal surveillance, and steady miniaturization of thermal cores are keeping demand on a secular uptrend. Defense buyers are replacing single-channel goggles with fused, digitally networked ensembles that shorten target-acquisition cycles, while commercial customers are embedding lightweight thermal cameras in drones, substations, and perimeter sensors to automate night-time monitoring. Geographic expansion is simultaneously helped and hindered by export-control regimes: licensing delays drive indigenous production in India, South Korea, and Turkey, yet allied upgrade programs in North America and Europe still anchor volume. Supply-chain pressure on indium antimonide is easing as detector makers dual-source mercury-cadmium-telluride wafers, limiting upward price drift even as detector counts per platform rise.
Key Report Takeaways
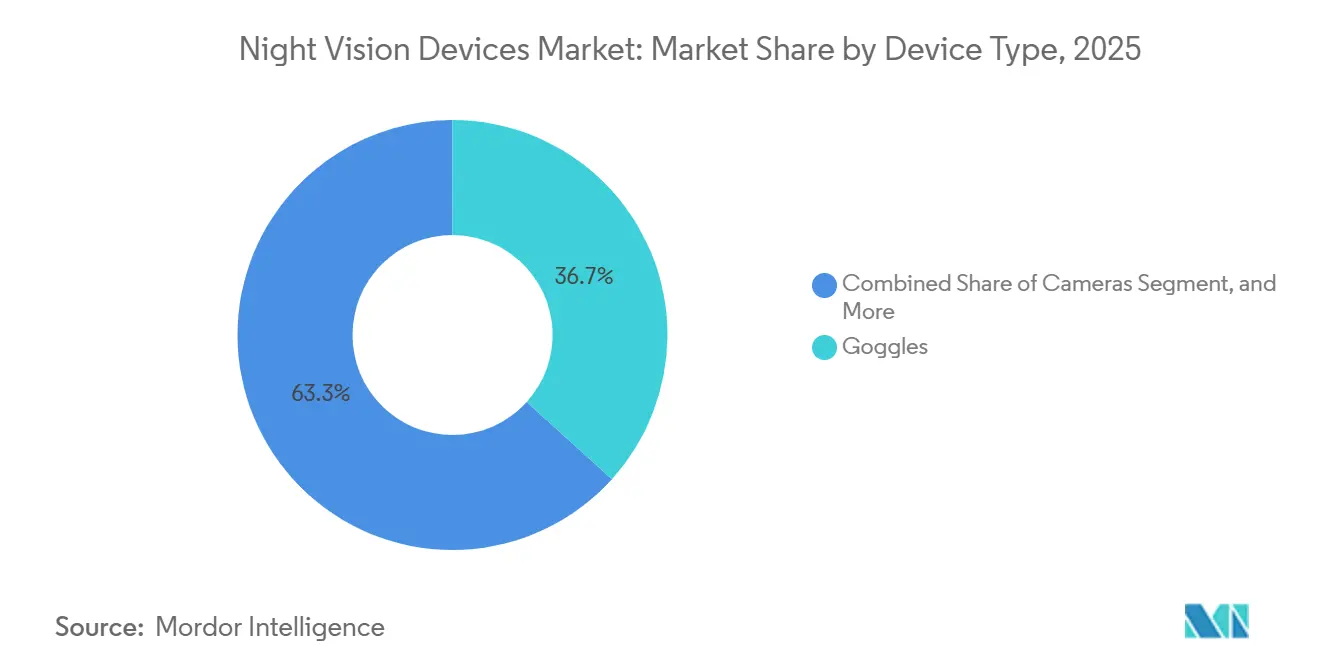
- By device type, goggles led with 36.71% of the night vision devices market share in 2025, while cameras are expected to grow at an 8.41% CAGR through 2031.
- By technology, image-intensifier systems captured 47.89% of 2025 revenue, whereas multispectral fusion is projected to advance at an 8.44% CAGR to 2031.
- By application, military and defense held 57.63% of the night vision devices market share in 2025, and surveillance and security are forecast to record the fastest expansion at 8.49% through 2031.
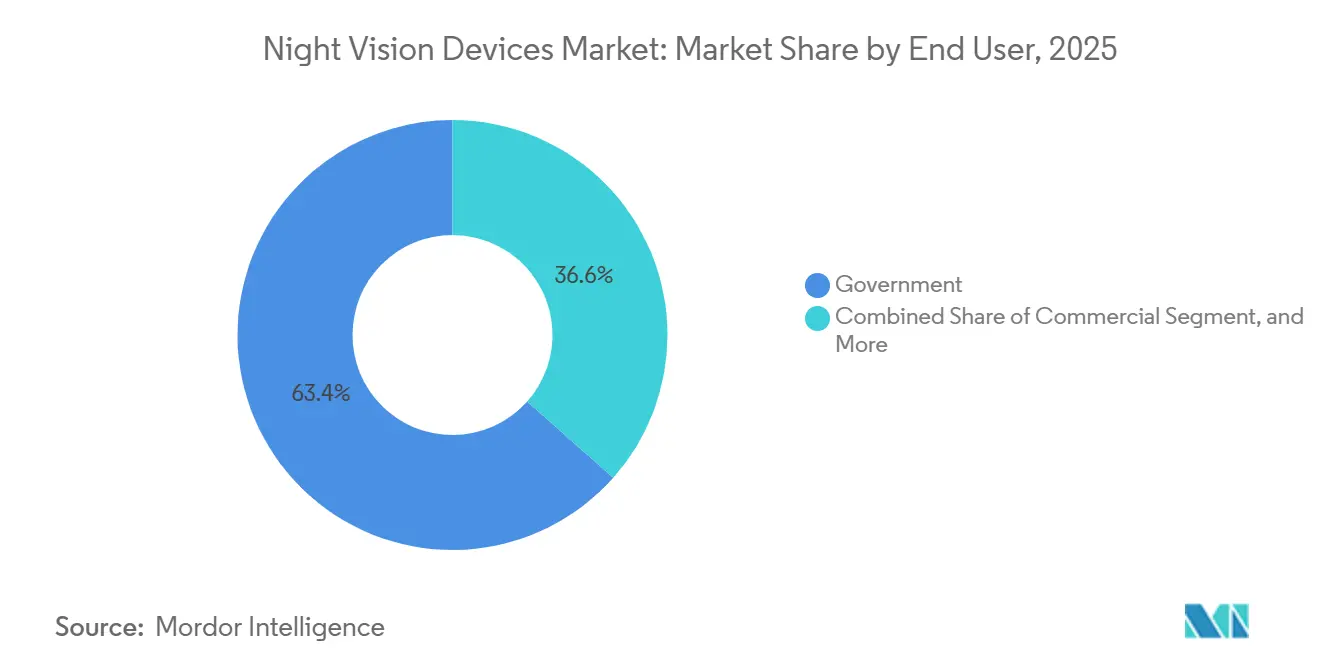
- By end user, government customers accounted for a 63.44% share in 2025, while commercial buyers are poised for a 7.96% CAGR over 2026-2031.
- By sales channel, direct contracts accounted for 53.67% of the night vision devices market share in 2025, with e-commerce expected to post the highest CAGR of 8.07% through 2031.
- By geography, North America commanded 39.74% of 2025 revenue, and Asia-Pacific is projected to grow at 8.53% annually through 2031.
Note: Market size and forecast figures in this report are generated using Mordor Intelligence’s proprietary estimation framework, updated with the latest available data and insights as of 2026.
Global Night Vision Devices Market Trends and Insights
Drivers Impact Analysis*
| Driver | (~) % Impact on CAGR Forecast | Geographic Relevance | Impact Timeline |
|---|---|---|---|
| Rising defense modernization budgets | +2.1% | Global, concentrated in North America, Europe, Asia-Pacific | Medium term (2-4 years) |
| Adoption of fused-sensor night vision for law enforcement | +1.3% | North America and Europe, expanding to Middle East | Short term (≤ 2 years) |
| Digitized soldier-vision programs | +1.8% | North America, Europe, select Asia-Pacific nations | Medium term (2-4 years) |
| Miniaturized SWaP-C image-intensifier tubes | +0.9% | Global | Long term (≥ 4 years) |
| Night-vision integration in commercial UAVs | +0.7% | Global, early adoption in North America, Asia-Pacific | Medium term (2-4 years) |
| On-orbit low-light sensors for space situational awareness | +0.4% | Global, led by North America and Europe | Long term (≥ 4 years) |
| Source: Mordor Intelligence | |||
Rising Defense Modernization Budgets
NATO members increased collective defense outlays to EUR 392 billion in 2025, up 14% from 2024, and allocated a larger share to 24-hour electro-optical upgrades.[1]“Defence Expenditure of NATO Countries (2014-2025),” NATO, nato.int The United States Army earmarked USD 377 million in FY 2025 and USD 211 million in FY 2026 specifically for fusion-ready goggles, signaling a pivot from monocular replacements to networked soldier-vision suites. India’s Defence Acquisition Council cleared INR 67,000 crore in August 2025 for thermal driver sights and weapon optics, reinforcing New Delhi’s import-substitution strategy. Japan’s FY 2026 budget features JPY 76.5 billion for multispectral UAV payloads to patrol the Senkaku Islands, confirming that airborne platforms now share the same upgrade cadence as infantry kits. South Korea’s January 2025 deployment of AI-enabled thermal towers along the DMZ cut false alarms by 35%, proving that modern budgets now integrate analytics from inception rather than bolt them on later.
Adoption of Fused-Sensor Night Vision for Law Enforcement
Urban police agencies are retiring single-channel tubes in favor of binoculars that blend thermal and image-intensified video into a single display, a change that lets Los Angeles officers spot fugitives hiding behind tinted glass during a 2024 pilot of Breach PTQ136 monoculars.[2]“Thermal Imaging Technology Pilot Program,” Los Angeles Police Department, lapd.online The United Kingdom’s GBP 120 million framework, signed in June 2025, requires automatic brightness control to prevent blooming when officers move from dark alleys to lit streets. New York City allocated USD 4.2 million for vehicle-mounted thermal cameras and then logged a 22% drop in after-dark response time at subway hubs. U.S. Customs and Border Protection added 1,200 thermal towers, which increased unauthorized-crossing detections by 18% compared with legacy infrared beacons. Thermal-visible fusion reduces the need to carry two optics, lowers training overhead, and preserves situational awareness in smoke, dust, or glare.
Digitized Soldier-Vision Programs
The Enhanced Night Vision Goggle-Binocular overlays waypoints, friend-or-foe icons, and ballistic cues on a fused thermal-visible image; a 2024 101st Airborne Division trial cut engagement time by 38% compared with legacy gear. Dual-vendor contracts awarded in January 2025 sent 24,056 ENVG-B headsets to units, ensuring supply resilience while driving common software baselines.[3]“Contracts for January 15 2025,” U.S. Department of Defense, defense.gov France’s Silfrared program is pursuing sub-20 mK detectors for Scorpion vehicles by 2027, demonstrating that vehicle and soldier optics now share common R&D pipelines. Germany integrated a six-camera thermal fusion suite into the Puma IFV, giving commanders a seamless 360-degree view during urban maneuvers. The United Kingdom’s DSTL is prototyping helmet displays that merge night imagery with synthetic-aperture radar to expose buried IEDs, a capability that moves night vision from stand-alone hardware to a node within tactical networks.
Miniaturized SWaP-C Image-Intensifier Tubes
Photonis compressed the tube diameter to 16 mm in its 4G ECHO line, yet extended the range by 35% over Gen-3 devices, allowing armies to retrofit rifle scopes without shifting barrel balance. Elbit’s 420 g XACT NV33 draws just 1.8 W, delivering 40 hours of battery life on a single lithium cell and easing logistics for long-range patrols. U.S. Special Operations Command capped full helmet assemblies at 680 g in its Visual Augmentation System requirement, pushing vendors toward carbon-fiber housings and GaN power converters. Exosens added 10 ns auto-gating to its 5G tube to eliminate muzzle-flash blindness, a feature once limited to high-end aircraft sensors. BAE Systems switched to OLED microdisplays in the Q-Warrior visor, cutting power draw by 40% and freeing battery weight for other kit.
Restraints Impact Analysis*
| Restraint | (~) % Impact on CAGR Forecast | Geographic Relevance | Impact Timeline |
|---|---|---|---|
| High lifecycle and calibration cost | -0.8% | Global | Medium term (2-4 years) |
| Export-control (ITAR, Wassenaar) restrictions | -1.1% | Global, acute in non-NATO markets | Long term (≥ 4 years) |
| Day-bright blooming and sensor saturation | -0.5% | Global | Short term (≤ 2 years) |
| Scarcity of indium antimonide supply chain | -0.7% | Global, concentrated in Asia-Pacific hubs | Medium term (2-4 years) |
| Source: Mordor Intelligence | |||
High Lifecycle and Calibration Cost
Image-intensifier tubes lose roughly 5% of their gain every 1,000 h of use, forcing USD 800 factory recalibrations every 2 years and costing the U.S. Army USD 47 million annually across a 250,000-unit fleet. Uncooled microbolometers drift faster in desert heat; a U.K. field audit found 18% of vehicle thermal sights out of spec within 10 months of deployment. Commercial security firms lack depot facilities. A Texas operator spends USD 12,000 each year maintaining 40 cameras, which is 15% of the purchase cost. Excelitas reported a six-month service backlog in 2025 because only a handful of technicians can realign fusion prisms, delaying law enforcement returns. Emerging-market militaries therefore stretch replacement cycles or buy refurbished Gen-2 optics at 60% of new-unit cost, tempering fresh sales.
Export-Control Restrictions
ITAR classifies tubes with a figure of merit above 1,400 as defense articles, adding 8-12 weeks of licensing and blocking exports to 28 embargoed states. Wassenaar’s 2024 update also restricts thermal cores with NETD below 50 mK, limiting shipments to China and Russia. India responded with an INR 659.47 crore October 2025 order to MKU and Medbit for 30,000 weapon sights, trimming import dependence by 40%. Turkey’s Aselsan exported 120 SARP remote weapon stations with domestic thermal imagers to Qatar without third-party approvals, demonstrating how local champions thrive behind regulatory walls. Hanwha’s K-ISTAR pod captured Southeast Asian UAV deals that U.S. vendors could not serve because of licensing delays.
*Our forecasts treat driver/restraint impacts as directional, not additive. The impact forecasts reflect baseline growth, mix effects, and variable interactions.
Segment Analysis
By Device Type: Goggles Dominate While Cameras Accelerate
Goggles captured 36.71% of the night vision devices market share in 2025, maintaining the lead, as binocular form factors preserve depth perception during foot patrols and reduce fatigue on long missions. Cameras are projected to record an 8.41% CAGR through 2031 as commercial unmanned-aerial-vehicle makers bundle dual-sensor payloads that stream video directly to cloud analytics dashboards. Rifle scopes retained their tactical niche after Teledyne FLIR unveiled a 20× zoom optic that extends target identification to 1,800 m, a distance that out-ranges most small-arms platforms. Monoculars remain the preferred choice in cramped turret and vehicle interiors where every gram matters, while clip-on thermal attachments retrofit legacy glass without changing operator training. These overlapping roles reduce product cannibalization and stabilize overall volumes within the device mix.
Cameras’ fast climb widens the installed sensor base that feeds artificial-intelligence engines, lowering per-node costs and driving adoption in perimeter monitoring, smart traffic lights, and critical-asset inspections. Although binocular goggles will stay the largest revenue contributor through 2031, sustained cost declines in uncooled thermal cores are expected to pull entry-level camera kits below USD 1,000, enticing budget-constrained public-safety agencies. The night vision devices market for goggles will nonetheless expand in absolute terms, as Western armies have only partially completed their transition to fused binoculars. Vendors are also redesigning housings with carbon fiber and magnesium alloys, trimming 15% of weight and improving mean-time-between-failure scores, which strengthens procurement arguments. Combined, these shifts confirm that device-type leadership will remain fluid as mission profiles diversify.


By Technology: Fusion Gains Ground on Legacy Intensifiers
Image intensifiers accounted for 47.89% of 2025 revenue, yet now cede momentum to multispectral fusion systems, which are forecast to grow at an 8.44% CAGR through 2031. Intensifiers still deliver superior low-light detail for reading text or distinguishing uniforms, but they struggle in smoke, fog, or glare that thermal channels easily pierce. Fusion optics overlays both streams in real time, cutting target-recognition errors by roughly 40% during recent U.S. Army drills. Infrared-illumination units hold a small niche in wildlife studies where adversary detection is irrelevant, while emerging low-light CMOS sensors populate sub-USD 500 consumer cameras that emphasize social-media connectivity.
Price gaps are narrowing: the premium for dual-mode goggles fell from 80% in 2025 to about 60% in 2026, and scale economies are on track to compress that spread below 30% by decade’s end. As a result, many defense ministries now write fusion capability as a baseline specification rather than an option, locking out single-channel bids. Thermal vendors continue shrinking pixel pitch, allowing 640×512 arrays to fit within 7.5 g cores that mount easily on drones and handheld stabilizers. The night vision devices market size tied to pure intensifiers will gradually shift from frontline deployment toward secondary uses such as driver enhancement, maintenance inspection, and resale into commercial security. This evolution underscores how technological convergence is steering procurement toward integrated spectral architectures.
By Application: Surveillance Outpaces the Defense Core
Military and defense contributed 57.63% of demand in 2025; however, surveillance and security applications are tracking the fastest 8.49% CAGR on the back of smart-city installations that link thermal cameras with video analytics to trim response times and deter crime. Navigation and marine safety stay steady because International Maritime Organization rules mandate thermal systems on passenger ships above 500 GT, prompting 3,200 retrofits during 2025. Wildlife conservation uses drone-borne thermal imaging to enumerate nocturnal species within hours rather than months, without disturbing habitats.
Urbanization curves suggest surveillance will pass military demand by 2033 as municipalities invest in persistent perimeter awareness to compensate for strained police staffing. Energy utilities, data centers, and telecom towers are already deploying fixed thermal cameras to predict equipment failures before downtime cascades, monetizing night vision as a preventive-maintenance asset. The night vision devices market share assigned to wildlife, search-and-rescue, and firefighting remains modest but socially salient, attracting philanthropic funding that subsidizes hardware costs in developing regions. Across all civil missions, software analytics now drives procurement more than sensor resolution, indicating a swing from hardware-defined value toward data-service ecosystems.
By End User: Commercial Buyers Expand the Revenue Base
Government agencies accounted for 63.44% of 2025 spending due to multiyear tenders, such as the 178,000-unit German-Belgian goggles order, which locks suppliers into predictable build schedules. Yet commercial entities, utilities, logistics yards, and agricultural firms are projected to log a 7.96% CAGR as detector prices sink below USD 1,000 and integration APIs simplify back-office uptake. Consumer enthusiasts still orbit around recreational hunting and night photography, and their demand spikes during peak holiday shopping on e-commerce platforms.
Corporate buyers increasingly embed real-time thermals into asset-management suites to satisfy insurers that reward reduced fire and theft risk with premium discounts. Public critical infrastructure operators also face tighter regulatory mandates for after-dark situational awareness, which is accelerating their purchase cycles. As a result, the night vision devices market share of government buyers will contract gradually but retain absolute primacy because sovereign defense budgets dwarf private outlays. The consumer slice will remain volatile, rising and falling with discretionary-income swings, yet its feedback loops on ease of use, size, and smartphone pairing continue to shape features that eventually migrate into professional lines.
By Sales Channel: E-Commerce Reshapes Procurement
Direct contracts captured 53.67% of 2025 revenue as defense ministries negotiated bespoke specifications and long-term spares packages with prime contractors. Distributors accounted for 38% of the value, providing regional showrooms where mid-sized security integrators can demo optics and secure service agreements. E-commerce accounted for the remaining 8.26%, but it is forecast to grow at an 8.07% CAGR and could own 60% of consumer transactions by 2031 as younger buyers pivot entirely to online shopping.
Platform operators now embed jurisdiction filters and age verification to comply with ITAR and Wassenaar rules, unlocking global carts for non-restricted SKUs. Manufacturers redesign packaging to survive parcel handling and preload firmware updates that activate upon pairing with mobile apps, eliminating dealer set-up steps. Distributors respond by bundling tripods, batteries, and extended warranties to keep added-value relevance. Direct contracts remain insulated from these swings because sovereign buyers require integrated training and classified software support. This multichannel coexistence means the night vision devices market will continue to expand across all routes, but margin profiles will differ sharply between unitized online sales and service-rich defense frameworks.
Geography Analysis
North America accounted for 39.74% of the night vision devices market share in 2025, anchored by the United States Department of Defense’s USD 377 million fiscal-year 2025 procurement and USD 211 million fiscal-year 2026 appropriation, funds channeled mainly into fusion-ready goggles. Canada added a CAD 48 million (USD 35 million) thermal-sight order for its C20 rifle program, while Mexico raised its 2025 budget for night optics by 22% to bolster counter-narcotics patrols along the northern border. The region benefits from vertically integrated factories clustered within 500 km of Boston and Orlando, which shorten lead times and enable quick depot repairs, keeping replacement cycles on a steady four-to-six-year cadence.
Asia-Pacific is the fastest-growing territory, projected to expand at an 8.53% CAGR through 2031 as India’s INR 659.47 crore (USD 79 million) October 2025 buy for 30,000 weapon sights and Japan’s JPY 277.3 billion unmanned-capability budget lifts regional spending. South Korea deployed AI-enabled thermal towers that cut DMZ false alarms by 35%, and Australia placed an AUD 120 million (USD 78 million) order for Boxer combat-vehicle payloads, signaling that land, maritime, and border missions all demand upgraded optics. China’s 2025 export quota on indium antimonide trimmed global supply 12%, forcing detector makers to qualify mercury-cadmium-telluride alternatives, which may elongate Asia-Pacific delivery schedules but should not derail overall unit growth.
Europe, the Middle East, Africa, and South America together represent an increasingly diversified opportunity set that keeps the overall night vision devices market on an upward trajectory. Europe booked the single-largest order of the period when the Organisation for Joint Armament Cooperation commissioned 178,000 goggles for Germany and Belgium in December 2025, a program that locks in common image-intensifier specifications and drives scale pricing. The United Arab Emirates signed an eight-year USD 2.3 billion framework with Elbit Systems to retrofit armored fleets, and Saudi Arabia added a USD 7.8 million mobile-surveillance award, highlighting how Gulf modernization agendas favor fused sensors. Brazil’s USD 64 million Amazon rainforest surveillance fund and Argentina’s USD 6 million border-monocular program show that environmental enforcement and narcotics control can reduce Latin American demand, even under fiscal constraints. Taken together, cross-region orders diversify supplier revenue and reduce over-reliance on any single defense budget.

Competitive Landscape
Five vertically integrated primes, Teledyne FLIR, L3Harris Technologies, Elbit Systems, BAE Systems, and Thales, collectively captured about 48% of 2025 revenue, giving the field a moderately concentrated profile. L3Harris solidified its position with a USD 263 million January 2025 tranche for 13,672 ENVG-B headsets, while Elbit claimed a USD 2.3 billion UAE umbrella award that ensures a multiyear hardware and sustainment stream. Teledyne FLIR differentiates through in-house detector fabs and 14 artificial-intelligence patents filed in 2025, which reduce false alarms by 42% in urban surveillance tests.
Mid-tier challengers such as Nivisys, Tactical Night Vision Company, and AGM Global Vision focus on modular clip-on thermals and sub-USD 1,500 monoculars, using rapid e-commerce distribution to reach hunters and private security teams. Chinese suppliers like Guide Infrared undercut Western pricing by up to 40%, compelling incumbents to bundle extended warranties, training, and software updates to defend margins. DJI’s 34% enterprise-drone share creates an adjacent payload market where lightweight thermal cores priced below USD 1,000 compete fiercely for volume orders.
Export-control fragmentation is widening the supplier field as India, Turkey, and South Korea scale domestic optics lines that bypass ITAR licensing barriers, trimming the top-five revenue slice by roughly three percentage points between 2023 and 2025. BAE Systems anchors customer lock-in by integrating its Q-Warrior visor into U.K. Morpheus tactical radios, while Thales leads a European Defence Fund consortium to define common sensor standards, a move that could lower per-unit costs once volume ramps up. Start-ups such as SatVu now deliver 3.5 m-resolution thermal satellite imagery at USD 200 per square kilometer, opening a top-down monitoring tier that broadens the competitive map beyond ground devices. Overall, rivalry is shifting from pure hardware toward data analytics and ecosystem control, keeping price-based competition intense yet still allowing differentiated value propositions around software integration and lifecycle support.
Night Vision Devices Industry Leaders
Teledyne FLIR LLC
L3Harris Technologies Inc.
Elbit Systems Ltd.
BAE Systems plc
Thales Group
- *Disclaimer: Major Players sorted in no particular order

Recent Industry Developments
- February 2026: MASNA Ventures launched a USD 100 million fund for electro-optical startups in Saudi Arabia.
- December 2025: Hensoldt and Theon Sensors won a contract for 178,000 goggles for Germany and Belgium.
- December 2025: Elbit Systems signed a USD 2.3 billion eight-year framework with the United Arab Emirates.
- October 2025: India placed an INR 659.47 crore (USD 79 million) order for 30,000 weapon sights with MKU and Medbit.


Global Night Vision Devices Market Report Scope
The Night Vision Devices Market Report is Segmented by Device Type (Cameras, Goggles, Monoculars and Binoculars, Rifle Scopes, Other Device Types), Technology (Thermal Imaging, Image Intensifier, Infra-Red Illumination, Multispectral Fusion, Other Technologies), Application (Military and Defence, Surveillance and Security, Wildlife Spotting and Conservation, Navigation and Marine, Other Applications), End User (Government, Commercial, Consumer), Sales Channel (Direct Contracts, Distributors and Dealers, E-Commerce), and Geography (North America, South America, Europe, Asia-Pacific, Middle East and Africa). The Market Forecasts are Provided in Terms of Value (USD).
| Cameras |
| Goggles |
| Monoculars and Binoculars |
| Rifle Scopes |
| Other Device Types |
| Thermal Imaging |
| Image Intensifier |
| Infra-Red Illumination |
| Multispectral Fusion |
| Other Technologies |
| Military and Defence |
| Surveillance and Security |
| Wildlife Spotting and Conservation |
| Navigation and Marine |
| Other Applications |
| Government |
| Commercial |
| Consumer |
| Direct Contracts |
| Distributors and Dealers |
| E-Commerce |
| North America | United States | |
| Canada | ||
| Mexico | ||
| South America | Brazil | |
| Argentina | ||
| Rest of South America | ||
| Europe | United Kingdom | |
| Germany | ||
| France | ||
| Italy | ||
| Rest of Europe | ||
| Asia Pacific | China | |
| Japan | ||
| India | ||
| South Korea | ||
| Rest of Asia Pacific | ||
| Middle East and Africa | Middle East | United Arab Emirates |
| Saudi Arabia | ||
| Rest of Middle East | ||
| Africa | South Africa | |
| Egypt | ||
| Rest of Africa | ||
| By Device Type | Cameras | ||
| Goggles | |||
| Monoculars and Binoculars | |||
| Rifle Scopes | |||
| Other Device Types | |||
| By Technology | Thermal Imaging | ||
| Image Intensifier | |||
| Infra-Red Illumination | |||
| Multispectral Fusion | |||
| Other Technologies | |||
| By Application | Military and Defence | ||
| Surveillance and Security | |||
| Wildlife Spotting and Conservation | |||
| Navigation and Marine | |||
| Other Applications | |||
| By End User | Government | ||
| Commercial | |||
| Consumer | |||
| By Sales Channel | Direct Contracts | ||
| Distributors and Dealers | |||
| E-Commerce | |||
| By Geography | North America | United States | |
| Canada | |||
| Mexico | |||
| South America | Brazil | ||
| Argentina | |||
| Rest of South America | |||
| Europe | United Kingdom | ||
| Germany | |||
| France | |||
| Italy | |||
| Rest of Europe | |||
| Asia Pacific | China | ||
| Japan | |||
| India | |||
| South Korea | |||
| Rest of Asia Pacific | |||
| Middle East and Africa | Middle East | United Arab Emirates | |
| Saudi Arabia | |||
| Rest of Middle East | |||
| Africa | South Africa | ||
| Egypt | |||
| Rest of Africa | |||


Key Questions Answered in the Report
How large will the night vision devices market be by 2031?
It is forecast to reach USD 14.43 billion by 2031, expanding at a 7.46% CAGR from 2026.
Which device type is growing the fastest?
Cameras integrated into commercial drones and perimeter sensors are projected to grow at an 8.41% CAGR through 2031.
Why are fused-sensor goggles preferred over legacy monoculars?
Fusion headsets overlay thermal and visible images, cutting target-acquisition time by about 40% and reducing cognitive load for operators.
How do export-control regulations affect international sales?
ITAR and Wassenaar licensing can add up to 12 weeks to delivery and exclude certain countries, motivating indigenous production in India, Turkey, and South Korea.
What is driving commercial adoption outside defense?
Falling detector prices and smart-city surveillance initiatives are pushing commercial CAGR to 7.96% between 2026 and 2031.
Which region will register the highest growth?
Asia-Pacific is projected to post the strongest regional CAGR at 8.53% through 2031, led by India, Japan, and South Korea.
Page last updated on:


