Programmable Stage Lighting Market Size and Share
Market Overview
| Study Period | 2019 - 2030 |
|---|---|
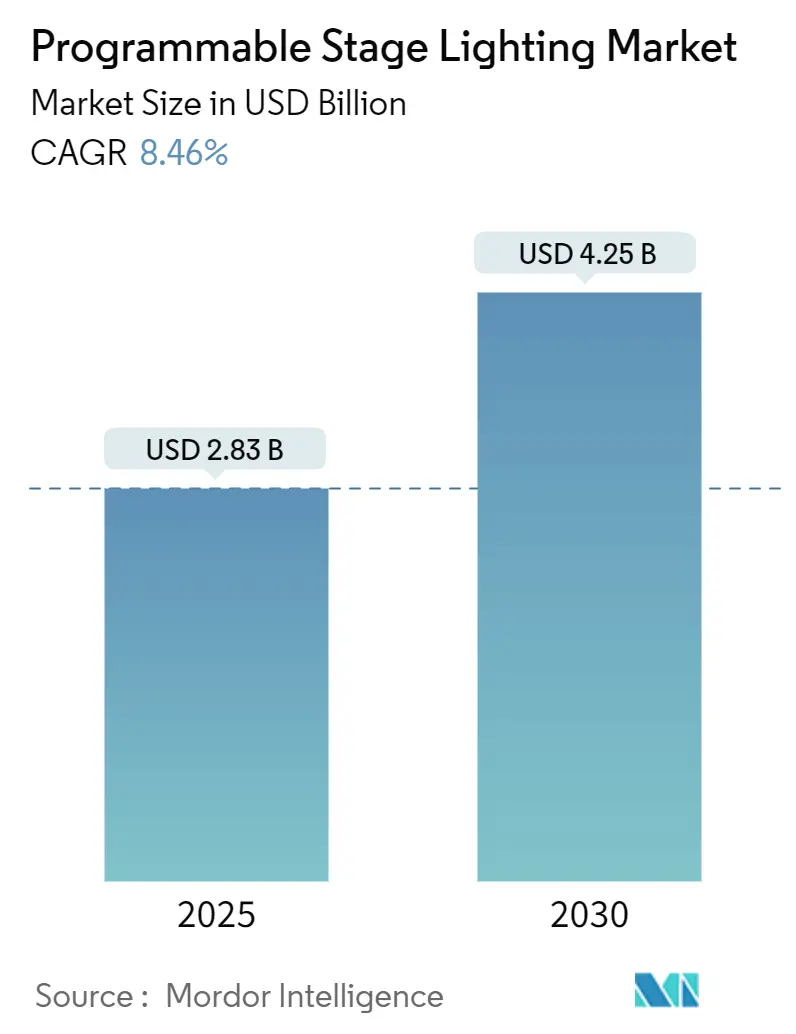
| Market Size (2025) | USD 2.83 Billion |
| Market Size (2030) | USD 4.25 Billion |
| Growth Rate (2025 - 2030) | 8.46% CAGR |
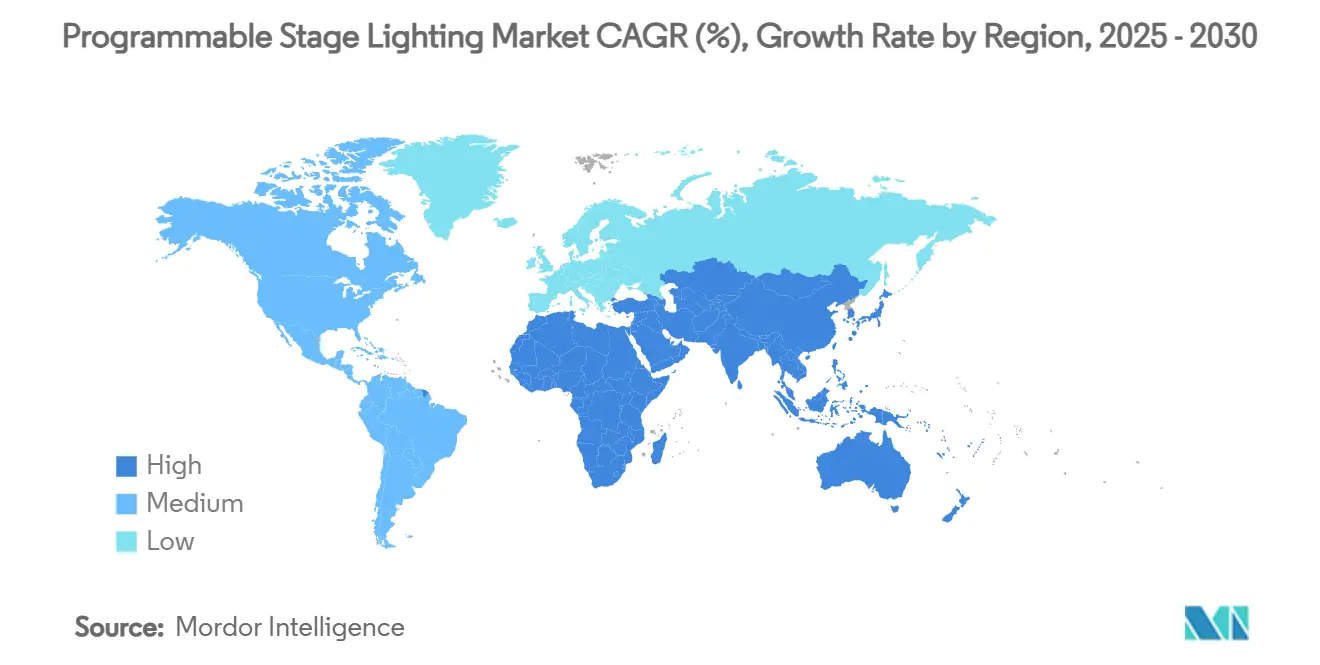
| Fastest Growing Market | Asia Pacific |
| Largest Market | Europe |
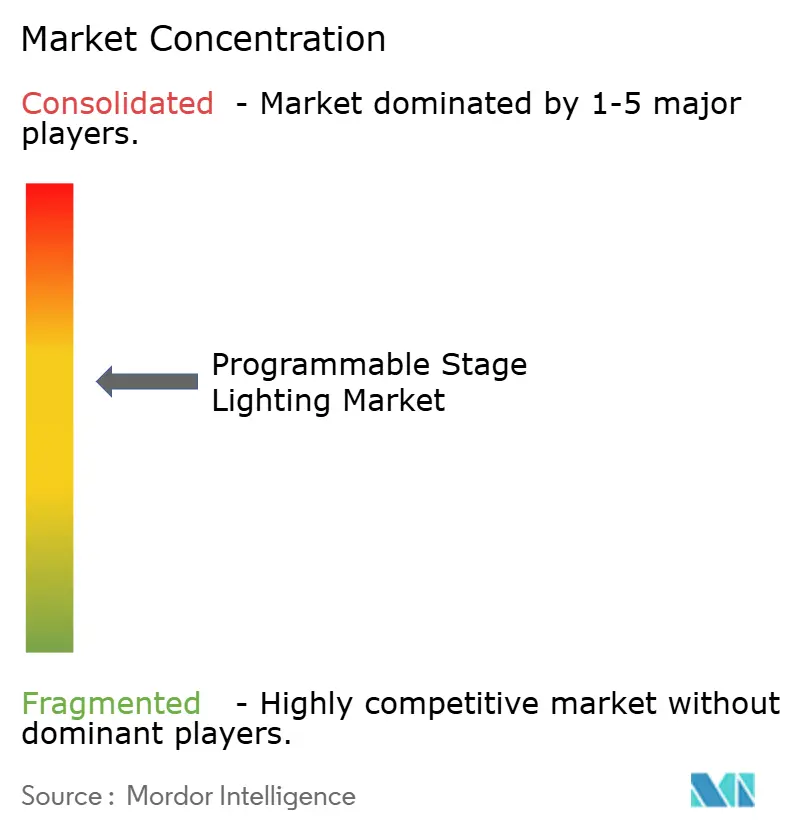
| Market Concentration | Medium |
Major Players *Disclaimer: Major Players sorted in no particular order Image © Mordor Intelligence. Reuse requires attribution under CC BY 4.0. | |
Programmable Stage Lighting Market Analysis by Mordor Intelligence
The programmable stage lighting market size stands at USD 2.83 billion in 2025 and is projected to advance to USD 4.25 billion by 2030, reflecting an 8.46% CAGR during the forecast period. Robust replacement cycles from halogen and HID to intelligent LED fixtures, growing appetite for immersive live experiences, and tighter energy-efficiency regulations collectively keep the programmable stage lighting market on a steady expansion path. Fixture makers now blend powerful RGBW LED engines with built-in wireless control, enabling smaller crews, faster setups, and richer visuals that lift venue revenue potential. Real-time data analytics inside next-generation consoles allow designers to pre-visualize scenes, shorten rehearsal hours, and align lighting with video and audio cues in a fraction of prior timelines. On the supply side, component firms have mitigated 2024 semiconductor shortages, restoring driver IC output and lowering average LED package costs by 12% from their 2024 peaks. Together these factors reinforce a virtuous cycle of higher performance, lower total cost of ownership, and broader geographic diffusion of the programmable stage lighting market.
Key Report Takeaways
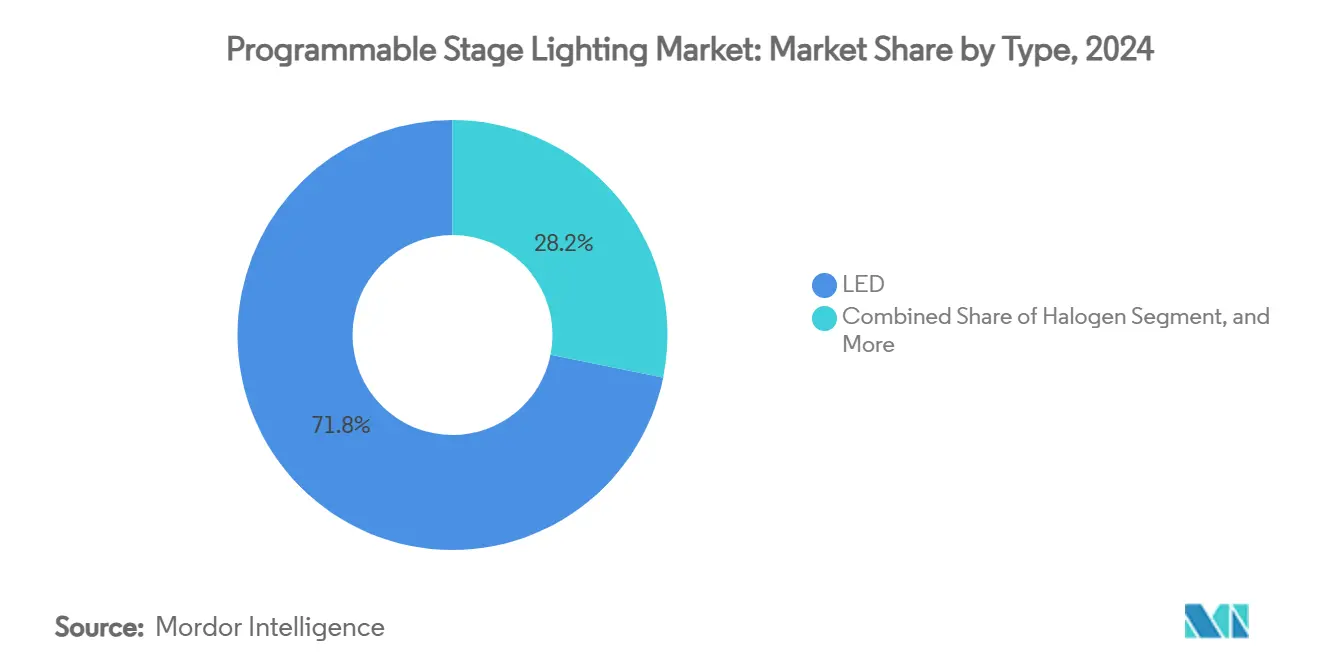
- By type, LED captured 71.83% revenue share in 2024; the same segment is forecast to expand at an 8.48% CAGR to 2030.
- By technology, wired infrastructure held 54.33% of the programmable stage lighting market share in 2024, while wireless systems are set to post the highest 8.56% CAGR through 2030.
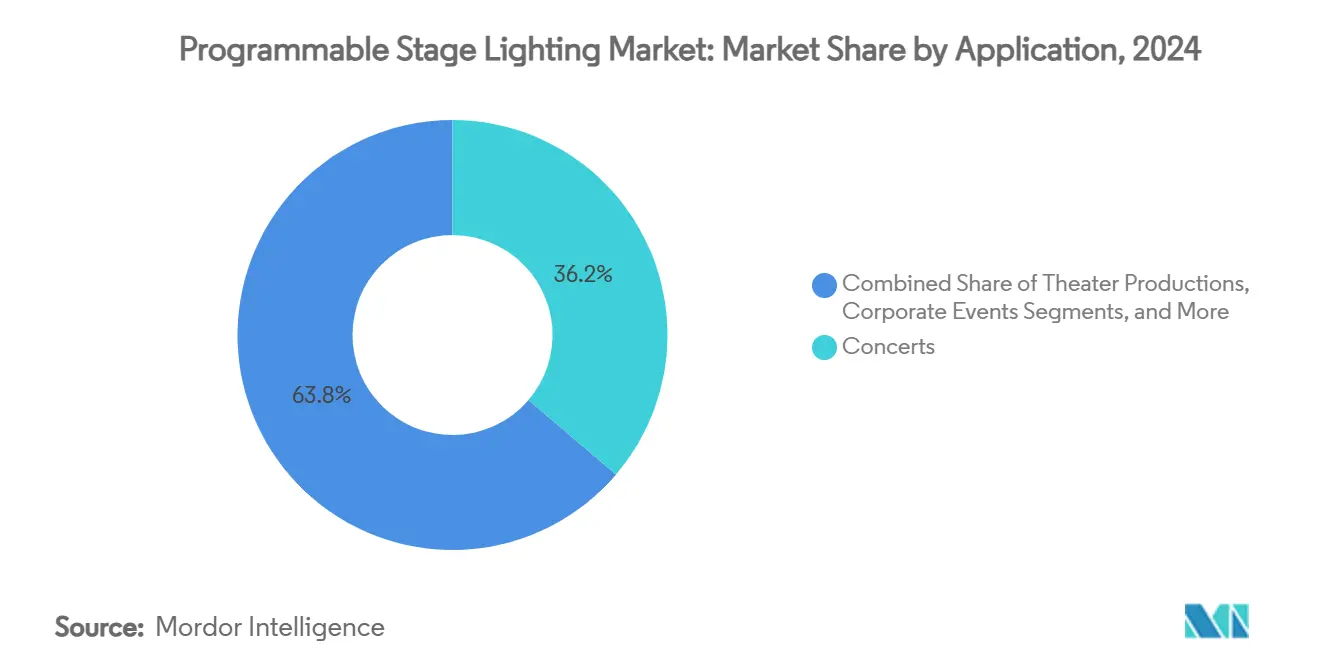
- By application, concerts accounted for 36.24% of the programmable stage lighting market size in 2024 and festivals are advancing at an 8.96% CAGR to 2030.
- By end user, event organizers commanded 29.52% share of the programmable stage lighting market size in 2024 and are projected to grow at an 8.71% CAGR during the same period.
- By geography, Europe led with 31.48% share in 2024; Asia-Pacific is slated to be the fastest mover at an 8.89% CAGR up to 2030.
Global Programmable Stage Lighting Market Trends and Insights
Drivers Impact Analysis*
| Driver | (~) % Impact on CAGR Forecast | Geographic Relevance | Impact Timeline |
|---|---|---|---|
| Rapid LED price/performance improvements | +2.1% | Global | Medium term (2-4 years) |
| Growth in live events and music festivals | +1.8% | North America and Europe, expanding to Asia-Pacific | Short term (≤ 2 years) |
| Adoption of smart and connected controls | +1.5% | Global, led by developed markets | Medium term (2-4 years) |
| Energy-efficiency rules phasing out halogen | +1.2% | Europe and North America, spreading globally | Long term (≥ 4 years) |
| Immersive XR environments need dynamic light | +0.9% | North America and Asia-Pacific core markets | Long term (≥ 4 years) |
| Demand for silent fan-less fixtures | +0.7% | Global, clustered in media hubs | Medium term (2-4 years) |
| Source: Mordor Intelligence | |||
Rapid LED price/performance improvements
Average fixture prices have fallen 40% since 2023 while color-rendering scores now exceed 95, allowing a single LED unit to take over multiple halogen roles and shrink touring truck space. Martin Professional’s MAC Encore Performance CLD outputs 11,600 lumens from a 468 W engine and integrates CMY color mixing, demonstrating how one asset delivers front-of-house key light and audience wash simultaneously. [1]Martin Professional, “MAC Encore Performance CLD,” martin.com Lifetimes surpassing 50,000 hours trim lamp change labor, making LED upgrade decisions easier for budget-conscious venues. New rare-earth-free phosphors based on zinc aluminum borate achieve 60% quantum yields and cut material volatility risk, aligning sustainability and cost curves in the programmable stage lighting market.
Growth in live events and music festivals
Ticketed gatherings rebounded hard in 2024 and 2025, with GL Events’ Live division registering 35% growth to EUR 820.6 million as organizers doubled down on spectacular visual storytelling. [2]GL Events, “GL Events H1 2024 Revenue,” gl-events.com Festivals now weave programmable light shows into marketing campaigns, monetizing social-media-ready “wow” moments that justify premium tier passes. Asia-Pacific venues—particularly in China where cultural-tourism takings topped 6 trillion RMB in 2024—order larger fixture packages to keep pace with international production houses. These factors lift rental utilization rates and accelerate depreciation cycles, sustaining fresh demand across the programmable stage lighting market.
Adoption of smart and connected controls
Wireless DMX mesh, PoE distribution, and AI-driven scene generation transform fixtures from static assets into data-rich nodes. Signify’s generative-AI assistant builds custom looks on the fly and syncs them with HVAC schedules, cutting programming hours while shaving 75% energy use via adaptive dimming.[3]Signify, “Philips Hue unveils AI-powered smart lighting and home security innovations,” signify.com Smaller theatres plug tablet-based consoles into cloud dashboards that push firmware, track driver temps, and flag pre-failure LEDs, lowering downtime and service calls. The result: venues unlock higher creative output with leaner crews, reinforcing the programmable stage lighting market’s appeal beyond top-tier productions.
Energy-efficiency regulations phasing out halogen/HID
The European Union’s halogen ban and the United States’ 45 lm/W minimum standard effectively removed most tungsten sources from shelves, forcing venues into LED retrofits ahead of show-critical failures. Broadcasters, theatres, and cruise ships have responded by over-ordering compatible fixtures to lock in rebates and ensure compliance. Canada’s harmonized code and Australia’s expected 2026 update extend these drivers worldwide, embedding steady replacement demand into the programmable stage lighting market’s long-term outlook.
Restraints Impact Analysis*
| Restraint | (~) % Impact on CAGR Forecast | Geographic Relevance | Impact Timeline |
|---|---|---|---|
| High upfront cost of advanced fixtures | -1.4% | Global, particularly emerging markets | Short term (≤ 2 years) |
| Integration complexity of network protocols | -0.8% | Global, concentrated in large projects | Medium term (2-4 years) |
| Supply-chain volatility for RGBW LEDs | -0.6% | Global, supply concentrated in Asia | Short term (≤ 2 years) |
| Sustainability concerns over rare-earth use | -0.4% | Europe and North America | Long term (≥ 4 years) |
| Source: Mordor Intelligence | |||
High upfront cost of advanced fixtures
Premium RGBW moving heads often list 200–300% above entry LED pars, stretching capital budgets for community theatres and academic stages. Payback periods still hover at 3–5 years even with 80% energy savings, prompting cash-strapped buyers to postpone upgrades until prices slide further. Semiconductor shortages in 2024 bumped LED driver IC quotes by 15-20%, adding to sticker shock, though 2025 relief has shaved some excess. Currency swings in emerging economies magnify the hurdle, as imported rigs become pricier relative to local incomes.
Integration complexity of networked control protocols
Large-scale installs juggle DMX512, Art-Net, sACN, and proprietary wireless streams, each with unique addressing and security quirks. Hybrid backbones need protocol translators and VLAN segmentation to keep lighting traffic stable, raising commissioning hours and specialized labor costs. Retrofit jobs are especially tough; legacy dimmer racks often clash with new constant-power grids, forcing custom middleware that stretches timelines. A shortage of certified lighting-network technicians in regional markets delays hand-over dates, tempering near-term growth for the programmable stage lighting market.
*Our forecasts treat driver/restraint impacts as directional, not additive. The impact forecasts reflect baseline growth, mix effects, and variable interactions.
Segment Analysis
By Type: LED dominance accelerates value creation
LED fixtures controlled 71.83% of the programmable stage lighting market share in 2024 and are on track to post an 8.48% CAGR through 2030. Confluence of 95+ CRI indices, silent fan-less cooling, and five-year driver warranties reduces ownership risk, moving LED well beyond its early novelty into staple status. The programmable stage lighting market now sees LED packages dropping below USD 0.06 per lumen for high-volume lines, narrowing the cost gap with quartz halogen while slashing power draw by 80%. Halogen persists for tungsten-exact color in heritage theatres, yet its footprint shrinks each rebate cycle as retrofit modules mimic 3,200 K warmth without thermal glass. HID remains niche in stadium-grade beam effects, but mobile truck shows increasingly opt for multiple smaller LED wash arrays that simplify rigging and dimmer patching. Advances in rare-earth-free phosphors such as Sr₂LiAlO₄ drive eco-compliant white points that remove a key sourcing risk. In turn, operators schedule fewer relamp stoppages, freeing dark days for revenue events and solidifying LED’s core position in the programmable stage lighting market.
Second-generation LED engines integrate Bluetooth-based commissioning, enabling “scan-and-assign” setups via smartphone when DMX consoles are occupied. This democratizes basic focus work to non-specialist staff, lifting throughput in busy multipurpose halls. Retrofit kits offering drop-in LED modules for existing Source Four profiles convert capital-light budgets into immediate power savings and compliance wins. Combined, these product strategies allow LED to extend ownership into small and mid-sized buyers, widening the programmable stage lighting market base.


By Technology: Wireless systems redefine rig logistics
Wired backbones still cover 54.33% of installations thanks to the robustness of shielded DMX512 and EtherCON runs, yet wireless links are clocking an 8.56% CAGR as temporary shows and heritage sites dodge cable pulls. CRMX mesh, refined to sub-5 ms latency and 99.9% packet redundancy, has convinced leading festivals to cut 2 km of copper per main stage, saving 1.5 tonnes of transport weight and gaining faster changeovers. The programmable stage lighting market benefits when technicians redeploy those labor hours to creative programming instead of physical terminations.
Radio-frequency-based node prices fell 22% year-on-year in 2025, pushing wireless into mid-market club installs where DJ booths shift layouts weekly. Bluetooth and Wi-Fi dominate small-venue or rehearsal rooms where bandwidth loads are lighter, while hybrid topologies hand mission-critical cues to fibre rings and keep wireless for roving positions. Growing acceptance of encrypted links, plus automatic frequency hopping, addresses earlier security hesitations. These factors coalesce to expand wireless appeal and set the stage for future fully IP-based lighting ecosystems within the broader programmable stage lighting market.
By Application: Festivals lead experiential escalation
Concerts retained 36.24% of 2024 revenue, reflecting entrenched touring infrastructures that demand rugged multi-purpose fixtures with rapid load-in/out features. Nevertheless, festivals are forecast to sprint ahead at an 8.96% CAGR, reshaping design briefs toward immersive 360-degree audience canvases and scenic-mapped towers. Post-pandemic crowd eagerness coupled with social media virality positions lighting as a front-line marketing lever rather than an ancillary technical cost. Organizers willingly reserve up to 12% of total production budgets for lighting effects-double 2019 levels-knowing vivid footage feeds ticket momentum for following editions. The programmable stage lighting market size attributed to festivals is therefore poised to jump from USD 1.02 billion in 2025 to USD 1.57 billion by 2030.
Theatre, corporate, and broadcast segments maintain steady demand anchored in storytelling accuracy, flicker-free operation, and precise cue recalls. Corporate adopters especially prize branding consistency, leveraging hue-locked LED rigs to align product reveals across global roadshows. As hybrid work persists, studios retrofit lighting grids to flex between on-site talent and remote feeds, cross-pollinating requirements that ripple back into live event specifications across the programmable stage lighting market.
By End User: Event organizers shape specification trends
Event organizers wielding 29.52% share in 2024 remain the market’s trendsetters, harnessing programmable scenes to monetize VIP tiers, dynamic sponsorship inserts, and extended show runtimes. Their 8.71% CAGR through 2030 will leave them holding nearly one-third of the programmable stage lighting market size by decade close. Rental houses increasingly co-invest with organizers, stocking modular IP-rated LED bars that quick-swap decals and lenses to service touring EDM, corporate expos, and broadcast specials, maximizing fleet ROI.
Theatre companies uphold strong volume in legacy venues, but upgrade cycles slow to 7-year averages due to municipal funding rhythms. Broadcast studios drive R&D for silent thermal paths and camera-safe dimming curves that later filter into touring catalogues. Nightclubs, though smaller in value, refresh fixtures every 24–36 months to stay visually distinct, offering a proving ground for compact high-pixel-density effects that eventually scale upward. This interplay keeps buyer diversity high, cementing a balanced, opportunity-rich programmable stage lighting market.
Geography Analysis
Europe, with 31.48% share in 2024, remains the reference point for regulatory-driven upgrades. Germany’s Kulturstiftung investment scheme reimburses up to 40% of LED retrofit costs, fueling quick progress in mid-sized playhouses. The United Kingdom’s 2021 halogen phase-out led regional theatre chains to allocate multi-year capex solely to sustainable lighting, with pilot sites showing 52% energy savings in their first full year. Cross-border touring standards, such as the new EN 17206 safety code, further spur fixture standardization and support volume consolidation for European suppliers. Consequently, revenue in the region is projected to climb steadily even though its programmable stage lighting market CAGR underperforms Asia-Pacific.
Asia-Pacific registers the fastest 8.89% CAGR, riding China’s cultural-tourism engine and a wave of new performing-arts centers across tier-two cities. Local fixture makers shorten lead times and undercut landed European brands by 15-20%, stimulating penetration in budget-sensitive municipal halls. Japan and South Korea set high technical bars-4K broadcast compatibility, IP65 ratings-that trickle to regional OEM designs and unlock export pipelines. India’s rapidly expanding wedding and corporate event verticals translate directly into fixture rental demand, diversifying revenue streams. Collectively, these dynamics will lift the region’s portion of the programmable stage lighting market from 27% in 2025 to nearly 30% by 2030.
North America shows mature yet resilient demand. The United States hosts the globe’s densest network of touring arenas, each scheduling 120-150 technical changeovers per season, which compels continuous equipment refresh. The Department of Energy’s 45 lm/W rule accelerates incandescent replacements across historical venues, while entertainment tax incentives in states such as Georgia keep studio build-outs active. Canada’s harmonized standards smooth cross-border rentals, expanding inventory fluidity. Although Latin American growth trails, marquee festivals in Brazil and Mexico are importing full European-spec rigs, signalling early upside for the broader Americas contribution to the programmable stage lighting market.

Competitive Landscape
Competition is moderate and tightening as component giants push deeper into finished fixtures while boutique specialists differentiate on optics, firmware agility, and artistic credibility. Signify leverages its LED engine scale to roll out AI-enhanced Hue Secure features, signaling a strategic drift toward software revenues beyond hardware margins. Ams OSRAM’s EUR 110 million savings campaign and silicon-carbide focus illustrate how upstream semiconductor investments bolster vertical control and open co-branding doors with fixture OEMs. Chauvet channels rental-house feedback into ruggedized IP65 moving heads that promise 50% lower annual maintenance cost, a hook that resonates in monsoon-exposed Asia-Pacific deployments.
Traditional theatre stalwarts such as Electronic Theatre Controls push middleware suites that knit lighting, audio, and scenic automation under a single UI, capturing consultancy fees alongside product sales. ROBE and Clay Paky emphasize spectral fidelity and native CRI>97 performance for broadcast-critical packages, winning high-profile cruise-liner contracts like Sun Princess that showcase multi-venue standardization on one ship. Mid-market disruptors integrate open-source console code into entry-level fixtures, courting developing-nation buyers with reduced proprietary lock-in. Start-ups in Europe and Silicon Valley target XR studios, embedding sub-millisecond sync with LED volumes.
Strategic alliances center on wireless IP, battery technology, and predictive analytics. Fixture makers partner with telecom OEMs for 6E Wi-Fi modules, while rental houses sign multi-year service contracts to guarantee firmware currency across global rosters. M&A activity remains selective; valuations hinge on proprietary control stacks rather than manufacturing capacity. Collectively, these moves shape an ecosystem where brand equity now rests as much on API openness as on beam sharpness, redefining success metrics inside the programmable stage lighting market.
Programmable Stage Lighting Industry Leaders
Signify N.V. (Philips Lighting)
ams OSRAM AG
Chauvet & Sons Inc.
Electronic Theatre Controls, Inc.
ROBE Lighting s.r.o.
- *Disclaimer: Major Players sorted in no particular order

Recent Industry Developments
- January 2025: Signify unveiled generative-AI lighting scenes and Hue Secure monitoring extensions, broadening its connected-lighting portfolio.
- January 2025: Eric Rondolat announced his departure as Signify CEO after steering LED sales to 90% of revenue.
- November 2024: Princess Cruises equipped the Sun Princess with FORTE FS and RoboSpot packages from ROBE, underscoring maritime demand for show-grade lighting.
- November 2024: NTGent theatre in Belgium installed 90 ETC Source Four LED Series 3 units to boost color accuracy during repertory cycles.


Global Programmable Stage Lighting Market Report Scope
| LED |
| Halogen |
| High-Intensity Discharge (HID) |
| Other Type |
| Wired |
| Wireless |
| Bluetooth |
| Wi-Fi |
| Radio Frequency |
| Other Technology |
| Concerts |
| Theater Productions |
| Corporate Events |
| Nightclubs |
| Festivals |
| Event Organizers |
| Theater Companies |
| Broadcasting Studios |
| Nightclubs |
| Corporate Sectors |
| North America | United States | |
| Canada | ||
| Mexico | ||
| South America | Brazil | |
| Argentina | ||
| Rest of South America | ||
| Europe | Germany | |
| United Kingdom | ||
| France | ||
| Russia | ||
| Rest of Europe | ||
| Asia-Pacific | China | |
| Japan | ||
| India | ||
| South Korea | ||
| Australia | ||
| Rest of Asia-Pacific | ||
| Middle East and Africa | Middle East | Saudi Arabia |
| United Arab Emirates | ||
| Rest of Middle East | ||
| Africa | South Africa | |
| Egypt | ||
| Rest of Africa | ||
| By Type | LED | ||
| Halogen | |||
| High-Intensity Discharge (HID) | |||
| Other Type | |||
| By Technology | Wired | ||
| Wireless | |||
| Bluetooth | |||
| Wi-Fi | |||
| Radio Frequency | |||
| Other Technology | |||
| By Application | Concerts | ||
| Theater Productions | |||
| Corporate Events | |||
| Nightclubs | |||
| Festivals | |||
| By End User | Event Organizers | ||
| Theater Companies | |||
| Broadcasting Studios | |||
| Nightclubs | |||
| Corporate Sectors | |||
| By Geography | North America | United States | |
| Canada | |||
| Mexico | |||
| South America | Brazil | ||
| Argentina | |||
| Rest of South America | |||
| Europe | Germany | ||
| United Kingdom | |||
| France | |||
| Russia | |||
| Rest of Europe | |||
| Asia-Pacific | China | ||
| Japan | |||
| India | |||
| South Korea | |||
| Australia | |||
| Rest of Asia-Pacific | |||
| Middle East and Africa | Middle East | Saudi Arabia | |
| United Arab Emirates | |||
| Rest of Middle East | |||
| Africa | South Africa | ||
| Egypt | |||
| Rest of Africa | |||


Key Questions Answered in the Report
What is the current value of the programmable stage lighting market?
The programmable stage lighting market size is USD 2.83 billion in 2025.
How fast will the market grow through 2030?
Revenue is forecast to climb to USD 4.25 billion by 2030, marking an 8.46% CAGR.
Which technology segment is expanding the quickest?
Wireless control systems are projected to grow at an 8.56% CAGR, outpacing wired alternatives.
Which application shows the strongest future upside?
Festivals are expected to post the highest 8.96% CAGR as organizers intensify visual production values.
Which region offers the highest growth rate?
Asia-Pacific leads with an anticipated 8.89% CAGR through 2030.
Why are LEDs replacing halogen in stage lighting?
LEDs now deliver 95+ CRI, 80% energy savings, and 50,000-hour lifetimes while satisfying regulations phasing out inefficient halogen sources.
Page last updated on:


