
3D Reconstruction Market Size and Share
Market Overview
| Study Period | 2020 - 2031 |
|---|---|
| Market Size (2026) | USD 1.86 Billion |
| Market Size (2031) | USD 3.19 Billion |
| Growth Rate (2026 - 2031) | 11.39 % |
| Fastest Growing Market | Asia Pacific |
| Largest Market | North America |
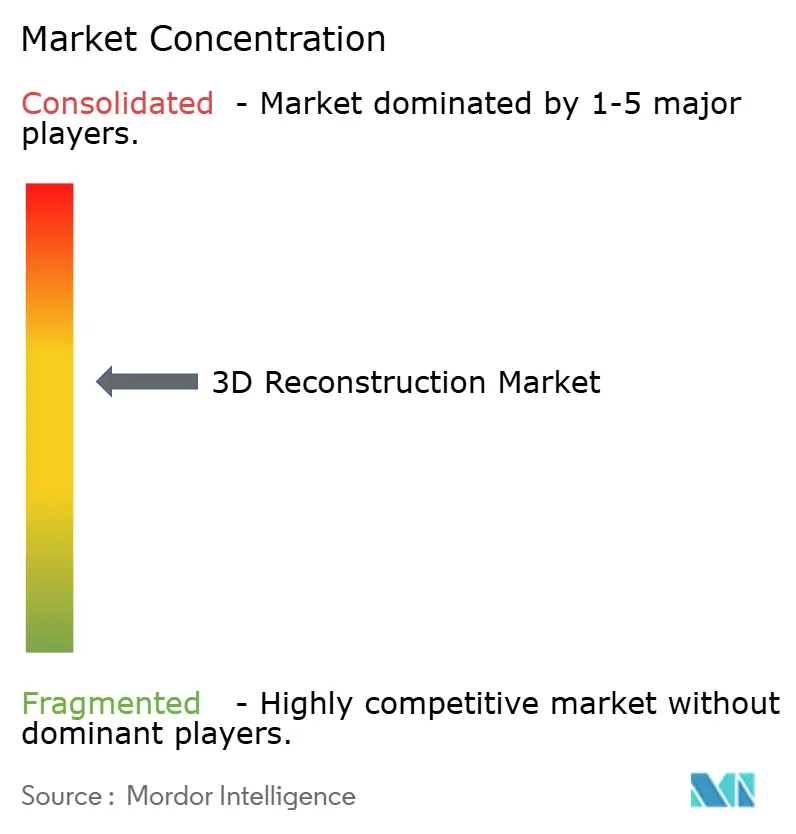
| Market Concentration | Medium |
Major Players *Disclaimer: Major Players sorted in no particular order Image © Mordor Intelligence. Reuse requires attribution under CC BY 4.0. | |
3D Reconstruction Market Analysis by Mordor Intelligence
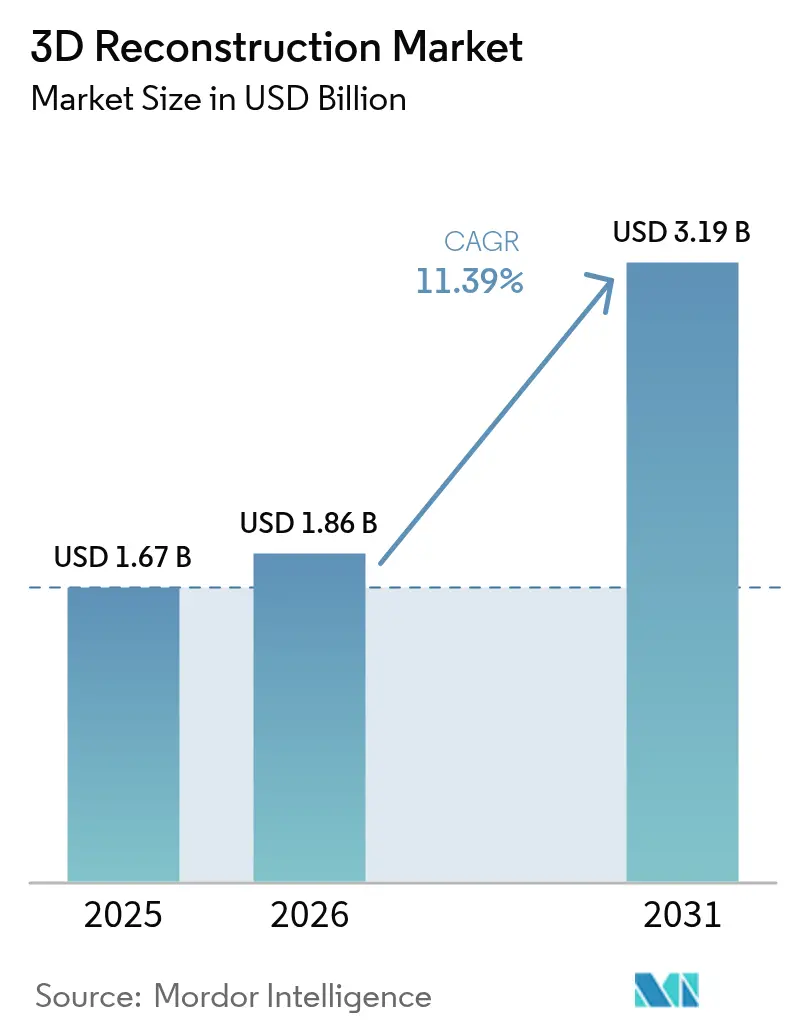
3D reconstruction market size in 2026 is estimated at USD 1.86 billion, growing from 2025 value of USD 1.67 billion with 2031 projections showing USD 3.19 billion, growing at 11.39% CAGR over 2026-2031. This growth is based on the steady migration from pilot projects to production-scale rollouts in construction, healthcare, media, and advanced manufacturing. Strong demand for digital twins in capital projects, falling LiDAR and imaging sensor prices, wider cloud-GPU availability, and the adoption of autonomous systems in logistics and mining are amplifying market expansion. Suppliers are reorganizing portfolios around vertical solution stacks that collapse capture hardware, cloud processing, and analytics into subscription bundles, a shift that is lowering time-to-value for non-specialist users. At the same time, rising scrutiny of privacy, data-residency, and carbon intensity in cloud workflows is adding compliance overhead that favors vendors with secure, regionally distributed infrastructure. Cost and skills barriers remain, but automated feature extraction, AI-assisted workflow orchestration, and pay-per-use charging models are sharpening the commercial case for enterprise adoption.
Key Report Takeaways
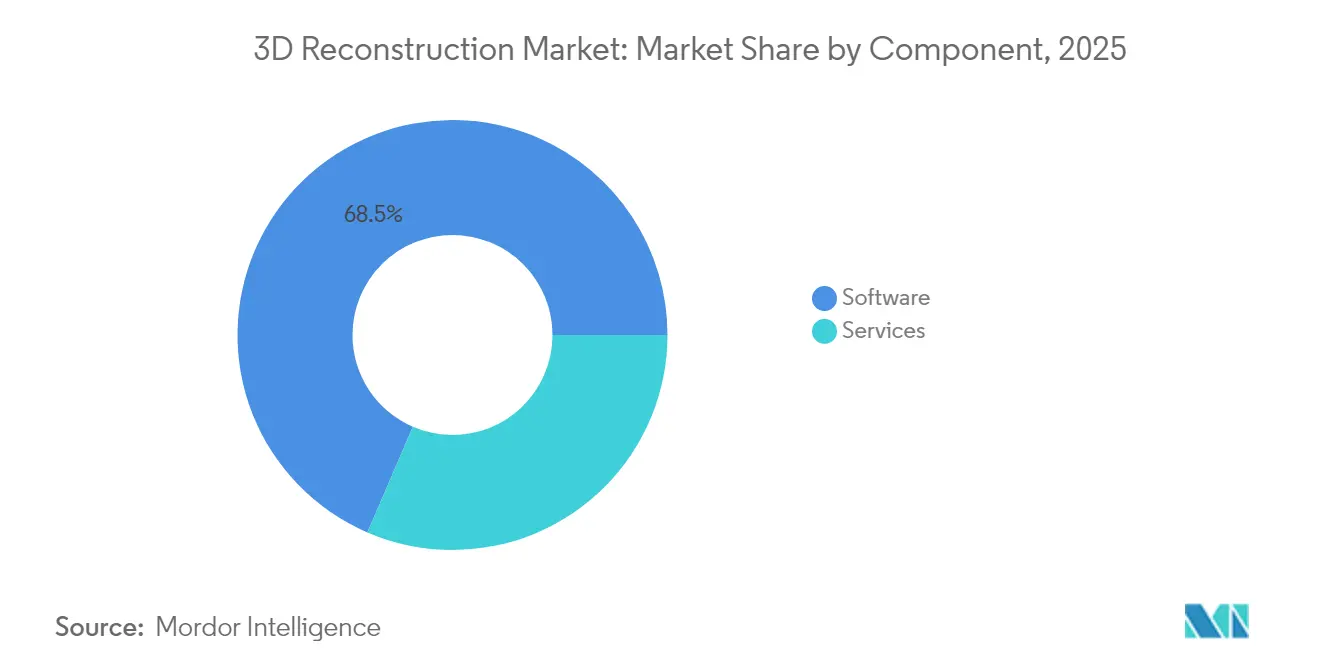
- By component, software led with a 68.52% of the 3D reconstruction market share in 2025, while services are projected to grow at an 11.67% CAGR through 2031.
- By technology type, active 3D reconstruction captured 60.85% of the 3D reconstruction market share in 2025; passive 3D reconstruction is projected to advance at a 11.75% CAGR through 2031.
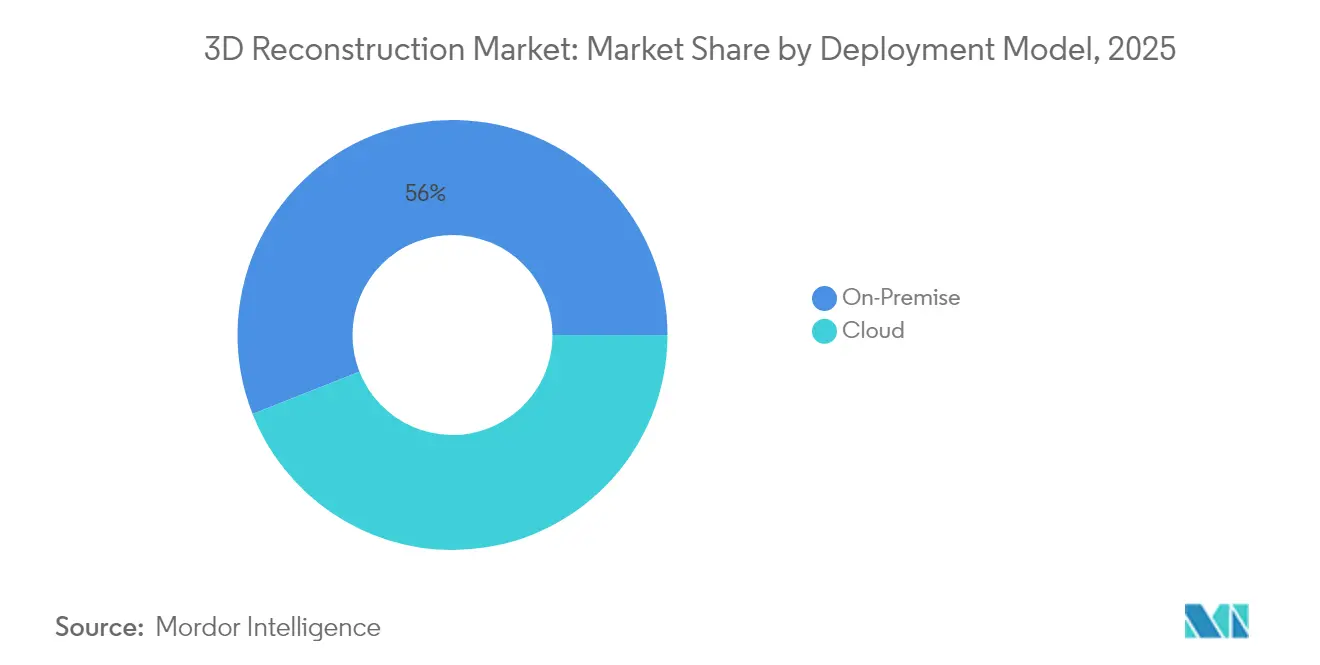
- By deployment model, on-premise installations accounted for 55.98% of the 3D reconstruction market size in 2025; however, cloud processing is projected to expand at a 11.58% CAGR through 2031.
- By application, construction and architecture commanded 40.92% of the 3D reconstruction market share in 2025, whereas robotics and drones are forecast to post a 12.98% CAGR through 2031.
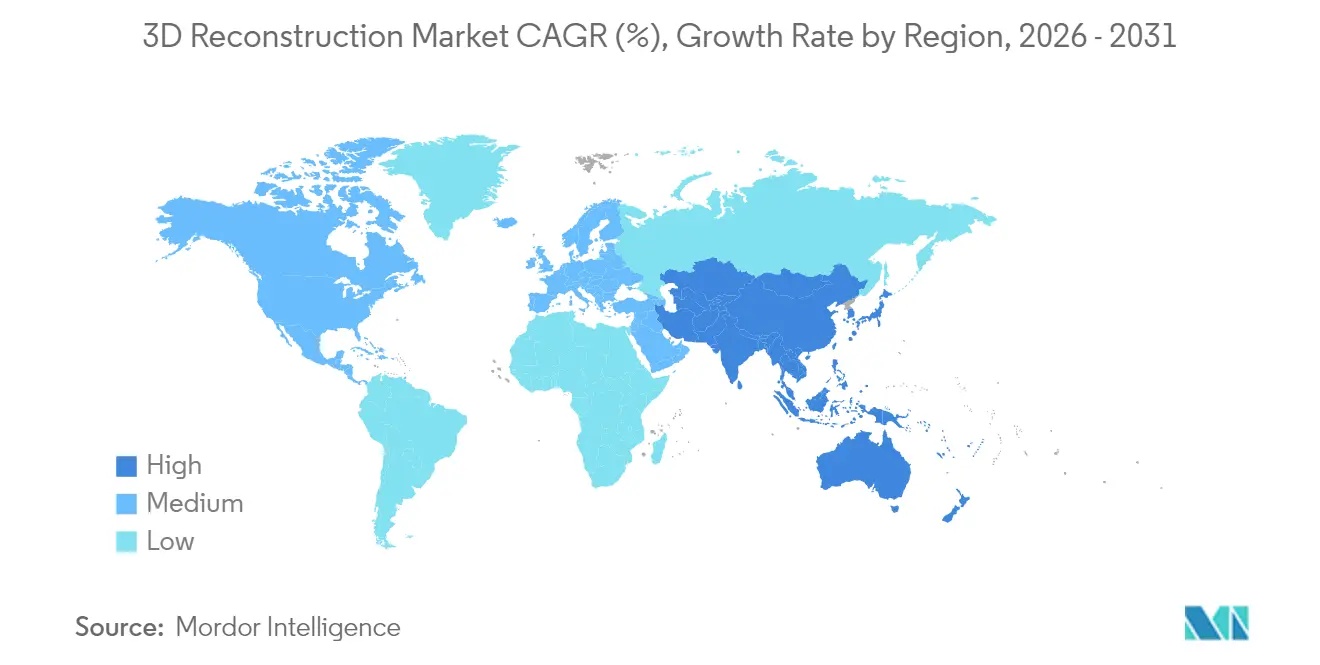
- By geography, North America accounted for 35.25% of the 3D reconstruction market share in 2025, while the Asia-Pacific region is projected to register a 12.44% CAGR from 2026 to 2031.
Note: Market size and forecast figures in this report are generated using Mordor Intelligence’s proprietary estimation framework, updated with the latest available data and insights as of 2026.
Market Trends and Insights
Drivers Impact Analysis of 3D Reconstruction Market*
| Driver | (~) % Impact on CAGR Forecast | Geographic Relevance | Impact Timeline |
|---|---|---|---|
| Rising Adoption of BIM-Driven Digital Twins in Construction | +2.8% | Global, with early gains in North America and Europe | Medium term (2-4 years) |
| Falling Sensor and LiDAR Costs Boosting Accessibility | +2.1% | Global, particularly Asia-Pacific and emerging markets | Short term (≤ 2 years) |
| Explosive VR and AR Content Demand Across Media and Entertainment | +1.9% | North America, Europe, and East Asia | Medium term (2-4 years) |
| Drone-Based Data Capture Enabling Large-Area Mapping | +1.7% | Global, with strong uptake in Asia-Pacific and South America | Short term (≤ 2 years) |
| Insurance Sector Shift to 3D Scene Documentation for Rapid Claims | +1.4% | North America and Europe | Medium term (2-4 years) |
| Patient-Specific Surgical Planning Platforms Gaining Traction | +1.7% | North America, Europe, and advanced Asia-Pacific markets | Long term (≥ 4 years) |
| Source: Mordor Intelligence | |||
BIM-Driven Digital Twins in Construction
3D reconstruction is now an always-on feedback loop that keeps BIM models synchronized with on-site reality. Mandates such as the United Kingdom's National Digital Twin Programme and Singapore's Virtual Singapore require public infrastructure contractors to deliver federated digital twins that ingest periodic scans, accelerating demand for automated point cloud capture and mesh alignment. Contractors report that accurate reconstructions reduce field rework and compress handover times, thereby boosting adoption among owners seeking to minimize lifecycle costs. Improved interoperability standards, typified by ISO 19650 extensions, are reducing data conversion friction and encouraging multi-vendor workflows.[1] As digital-twin programs extend to municipal and utility assets, the 3D reconstruction market is expanding from design teams to facilities managers and maintenance contractors.
Falling Sensor and LiDAR Costs Boosting Accessibility
Solid-state innovation and volume manufacturing have pulled LiDAR price points below USD 500 per automotive-grade unit, widening the accessible customer base beyond tier-one contractors and defense primes.[2] Handheld SLAM scanners, which once cost USD 50,000, now list for under USD 30,000, and drone-mounted LiDAR payloads have dropped below USD 10,000, making corridor mapping accessible to utility cooperatives and mid-sized survey firms. Lower hardware cost is drawing new service entrants in South America, Africa, and South Asia, where earlier projects relied on satellite imagery because terrestrial scanning was uneconomical. The skills gap, however, has shifted to data processing; vendors are responding with cloud-hosted AI toolsets that automatically classify, colorize, and thin-point clouds, thereby shortening training cycles for non-geospatial professionals.
Explosive VR and AR Content Demand Across Media and Entertainment
Film studios, game publishers, and streaming platforms are racing to stock high-fidelity asset libraries as real-time engines such as Unreal 5 deliver cinematic lighting and geometry at interactive frame rates. Photogrammetry offers the fastest route to lifelike replicas, and volume-capture stages equipped with synchronized camera arrays are now standard in major production hubs. European compliance rules requiring labeling of synthetic media have elevated the need for provenance metadata, favoring end-to-end systems that embed capture logs inside the resulting mesh files. Growth will accelerate as edge-rendered AR marketing, virtual showrooms, and immersive sports broadcasts move from pilots to commercial deployment.
Drone-Based Data Capture Enabling Large-Area Mapping
Unmanned aerial systems equipped with RTK positioning and lightweight LiDAR have become essential for infrastructure inspection, agriculture, and disaster response. DJI’s Matrice 350 RTK, equipped with the Zenmuse L2 sensor, captures 240,000 points per second up to 250 meters, effectively replacing manned aircraft for many corridor surveys. Annual drone missions logged by large construction platforms now exceed two million, indicating a shift from periodic surveys to near-continuous monitoring. Regulatory environments are stabilizing as Remote ID in the United States and harmonized BVLOS corridors in Europe establish clearer compliance pathways, enabling asset owners to plan repeatable flight operations at an industrial scale.[3]
Restraints Impact Analysis of 3D Reconstruction Market*
| Restraint | (~) % Impact on CAGR Forecast | Geographic Relevance | Impact Timeline |
|---|---|---|---|
| High Up-Front Hardware-Software Investment Outlay | -1.6% | Global, particularly acute in emerging markets | Short term (≤ 2 years) |
| Workflow Complexity Requiring Specialist Skillsets | -1.3% | Global, with skill shortages most severe in Asia-Pacific and Africa | Medium term (2-4 years) |
| Urban-Capture Privacy and Data-Sovereignty Regulations | -0.9% | Europe, North America, and advanced Asia-Pacific markets | Long term (≥ 4 years) |
| Cloud Processing's Rising Carbon-Footprint Scrutiny | -0.7% | Europe and North America | Medium term (2-4 years) |
| Source: Mordor Intelligence | |||
High Up-Front Hardware-Software Investment Outlay
A production-grade terrestrial scanner still ranges from USD 40,000 to USD 80,000, and leading photogrammetry software carries annual license and maintenance charges that can exceed USD 4,000 per seat. Cloud GPU time compounds these commitments: dense reconstruction of a 10,000-image survey can consume 200–300 GPU hours and incur USD 1,000 in processing fees. For cultural heritage bodies, small insurers, and municipal planning offices, capital intensity can slow adoption or prompt them to consider outsourcing. Vendor responses include hardware-as-a-service bundles, per-scan pricing, and short-term rentals; however, these alternatives often lock customers into proprietary ecosystems and defer, rather than eliminate, total costs.
Workflow Complexity Requiring Specialist Skillsets
Accurate reconstruction requires knowledge of photogrammetry, camera calibration, ground control, and coordinate systems; yet, globally certified practitioners remain in short supply. University geomatics cohorts are growing slowly, and graduates frequently migrate to higher-paying software roles, leaving field-survey and mapping firms understaffed. Vendors have introduced AI filters for tie-point cleaning, auto-triangulation wizards, and single-click dense-cloud generation; however, edge cases such as low-texture surfaces, reflective materials, and moving elements still require the expertise of experienced operators. Governments in India, Kenya, and Brazil have launched vocational upskilling programs in partnership with industry associations, but tangible workforce expansion is several years away.
*Our forecasts treat driver/restraint impacts as directional, not additive. The impact forecasts reflect baseline growth, mix effects, and variable interactions.
3D Reconstruction Market Segment Analysis
By Component:
Services Gain as Integration Complexity RisesSoftware captured 68.52% of 2025 revenue through perpetual-license and subscription models, monetizing core photogrammetry and point-cloud platforms. Services revenue, however, is rising at an 11.67% CAGR because enterprises increasingly favor turnkey deliverables over in-house buildouts. Managed-service firms bundle field capture, GPU processing, QA, and data management into monthly fees that better align with project budgets than capital purchases. The American Society of Civil Engineers notes that a rising share of owners demand third-party validation certificates for survey accuracy, expanding opportunity for audit and advisory engagements. Vendors are augmenting product lines with captive service teams. Autodesk, Bentley Systems, and Trimble have each acquired regional survey specialists to offer hands-on workflow configuration and compliance documentation. As regulatory oversight around geolocation precision and personal-data masking tightens, services will remain the fastest-growing component of the 3D reconstruction market.
A second factor elevating services is the episodic nature of several high-value use cases. Insurers, law enforcement units, and emergency response agencies require rapid scene capture after rare events but cannot justify maintaining permanent teams or equipment. Subscription access to pre-shot city twins, on-demand field crews, and pay-per-scan robotics lowers barriers for these intermittent customers. Over the forecast horizon, professional services lines, ranging from change-detection analytics in construction to bespoke AI segmentation models in utilities, are expected to outpace core software revenue and reshape the vendor revenue mix.

By Technology Type:
Passive Methods Close the Gap Through AI AdvancesActive imaging, dominated by LiDAR, structured light, and time-of-flight sensors, held a 60.85% market share in 3D reconstruction in 2025, owing to its unmatched sub-centimeter fidelity in controlled conditions. Industrial metrology, factory automation, and autonomous vehicles still treat active sensors as mandatory. Yet passive photogrammetry is growing at an 11.75% CAGR as neural radiance fields and Gaussian splatting yield printable accuracy from sparse photographs. Mobile-first apps now transform 30–40 handheld images into textured meshes within minutes, a capability that unlocks ecommerce, residential real estate, and insurance use cases at negligible cost. The cost advantage of passive capture is particularly decisive for outdoor and large-area projects, especially in emerging markets where LiDAR imports face tariffs and supply chain delays.
Hybrid workflows that blend dense LiDAR point clouds with photogrammetric textures occupy a rising middle ground. Cultural heritage conservators and bridge inspectors combine modalities to achieve millimeter-level geometry and photorealistic surface detail in a single model. As the 3D reconstruction market size expands, vendors are shipping integrated toolkits that co-register active and passive inputs, reducing operator effort. Component costs are converging as well: as LiDAR falls below USD 500, price differentials shrink, allowing project managers to choose technology stacks based on the deployment environment rather than solely on budget constraints.
By Deployment Model:
Cloud Gains as Processing Demands Exceed On-Premise CapacityOn-premise deployments accounted for 55.98% of installations in 2025, driven by defense, health, and critical infrastructure owners who must segregate sensitive data. National mapping agencies with continuous capture flows also favor local clusters for cost control and deterministic processing queues. However, hyperscalers have built GPU fleets optimized for photogrammetric dense matching, and SaaS platforms now allow users to spin up hundreds of cards for hours rather than purchasing servers outright. As a result, cloud processing is advancing at an 11.58% CAGR and is expected to overtake on-premise workloads before 2031.
Latency-sensitive edge tasks, such as initial imagery QC, blur detection, and coordinate tagging, often remain local, while the heavy lifting shifts to cloud nodes. Vendors have introduced region-locked processing options that keep European customer data inside EU borders, helping clients navigate Schrems II compliance. Carbon accounting dashboards that quantify GPU energy consumption are emerging, enabling sustainability teams to optimize compute allocations. Together, these features reduce buyer anxiety around data sovereignty and climate impact, two issues that historically favored on-premise builds.
By Application:
Robotics and Drones Lead Growth as Autonomy ScalesConstruction and architecture accounted for 40.92% of 2025 revenue, as contractors validated as-built conditions against BIM designs and facility managers scheduled maintenance based on deformation trends. Healthcare usage is growing as hospitals employ patient-specific anatomical models for pre-surgical rehearsals, reducing operating time and complications. Media and entertainment studios are pushing photorealistic capture for virtual production sets and immersive streaming. Cultural heritage digitization projects continue worldwide, supported by ministries of culture and nonprofits such as CyArk, which preserves at-risk monuments in sub-millimeter detail.
Industrial inspection leverages robotic arms and mobile scanners on automotive and aerospace lines to detect surface defects that camera-only solutions miss. Public safety agencies document crime scenes for courtroom presentation with handheld scanners or LiDAR-equipped drones, while forensic reconstruction tools calculate trajectories and impact zones. Robotics and drones, advancing at a 12.98% CAGR, now combine visual SLAM with dense 3D meshes to localize in GPS-denied environments such as warehouses and underground mines. Universities, museums, and laboratories use 3D reconstruction to virtualize specimens and exhibits, enabling remote collaboration and online learning. Gaming and virtual reality creators utilize photogrammetry libraries, such as Quixel Megascans, to accelerate the process of building environments. Free asset access on major engines lowers the entry barriers for indie developers and educators.
Geography Analysis
North America 3D Reconstruction Market
North America held 35.25% of 2025 demand, buoyed by early BIM mandates, a robust defense-industrial base, and an insurance sector that widely documents claims in 3D. U.S. federal programs, such as Every Day Counts, promote LiDAR bridge inspections, while Canadian mining and forestry firms deploy drones for environmental monitoring. Data-residency differences among U.S. states and Canadian provinces can complicate cross-border projects; however, local cloud regions help mitigate this issue. Mexico’s rail and airport modernizations have led to corridor-mapping projects, although limited domestic expertise has slowed the field execution.
Europe 3D Reconstruction Market
Europe maintains a strong position through nationwide BIM requirements in the United Kingdom, Germany, and France, as well as through extensive cultural heritage preservation across the Mediterranean. Horizon Europe allocated USD 107.35 billion in research funding toward digital twin and geospatial technologies, stimulating university-industry consortia. Privacy rules under GDPR and the forthcoming AI Act increase compliance costs but also drive demand for automated masking, redaction, and on-shore processing. Russian construction firms, facing import constraints, have turned to domestic software, which has encouraged the growth of the local ecosystem despite capability gaps.
APAC 3D Reconstruction Market
The Asia-Pacific region is the fastest-growing, with a projected 12.44% CAGR. China’s mandate that public projects above CNY 200 million deploy BIM is feeding large-scale scan-to-BIM workflows. Japan’s transport ministry utilizes LiDAR-equipped drones to monitor tunnels and bridges in seismic zones, thereby protecting supply chains and ensuring public safety. India’s Survey of India is mapping cities in 3D to modernize land records and disaster-response planning. South Korea’s shipyards and fabs require sub-millimeter inspection, while Australia’s mining sector leverages aerial LiDAR for pit optimization. Broadband gaps and limited photogrammetry training restrict expansion in Indonesia, the Philippines, and Pacific Island states.
MEA 3D Reconstruction Market
Middle East and Africa sales accelerate as Saudi Arabia’s NEOM and the United Arab Emirates’ Dubai 2040 initiatives demand city-scale digital twins. South Africa’s deep mines scan underground workings for safety, and Egypt’s Ministry of Tourism digitizes antiquities for virtual tourism. Political instability and currency volatility hinder capital acquisitions in several sub-Saharan countries, resulting in uneven market penetration. Gulf Cooperation Council growth, however, drags regional averages upward through mega-project spending.
South America 3D Reconstruction Market
South America experiences renewed momentum as Brazil’s construction sector rebounds, and Argentina expands its lithium mining operations. Brazilian land-reform programs now mandate drone surveys for land-tenure clarification, spurring demand for cloud photogrammetry. Chile’s public-works ministry relies on LiDAR to map landslide zones on the Pan-American Highway, but import tariffs on laser scanners and GPUs inflate project budgets. A Mercosur digital infrastructure working group is drafting shared technical standards to harmonize cross-border data exchange; yet, tangible adoption remains incremental.
Regulatory Landscape
Regulation affecting 3D reconstruction is tightening around two themes: privacy and AI governance, and interoperability of 3D content. In Europe, GDPR continues to shape urban-scale capture practices, including personal-data masking, consent workflows, and data residency, while the EU AI Act (Regulation (EU) 2024/1689) increases documentation and transparency obligations for AI used in reconstruction pipelines, particularly when general-purpose AI components are embedded in commercial products used across multiple domains.
Standards bodies are also setting de facto compliance targets for how reconstructed assets are packaged and exchanged across engines and platforms. ETSI advanced AR authoring and scene-management requirements through ETSI GR ARF 012 V2.1.1 (February 2026), and Khronos expanded work around glTF-based volumetric media via a liaison with the Volumetric Format Association (May 2026) and a new Volumetric Media Subgroup inside its 3D Formats working group (June 2026). In Asia, China signaled continued standardization for multi-view reconstruction at scale through a SAMR plan (April 2024) to develop technical specifications for large-scale multi-view 3D reconstruction systems, reinforcing a trend toward formal technical baselines for public-sector and infrastructure deployments.
Value Chain Analysis
The 3D reconstruction value chain starts with capture inputs (cameras, LiDAR/SLAM scanners, drones, RTK/GNSS, and calibration targets), then moves to data ingestion and preprocessing (registration, noise filtering, and georeferencing), followed by core reconstruction (photogrammetry, NeRF/Gaussian splatting, meshing, and texturing) and post-processing (classification/segmentation, measurement, and QA). Delivery and monetization typically occur through CAD/BIM and digital-twin connectors (for construction and infrastructure), GIS publishing workflows (for mapping), and real-time engines or web viewers (for media, ecommerce, and training), with storage and compute delivered via on-premise GPU workstations or cloud GPU environments depending on data-sensitivity requirements.
Services and distribution partners play a larger role as buyers seek turnkey outcomes and repeatable operations. The ecosystem includes survey and inspection service bureaus, drone capture networks, and platform providers that expose APIs for downstream integration. A visible example is the May 2026 Niantic and Spexi Geospatial partnership that combined Spexi's aerial capture network with Niantic's 3D reconstruction stack, returning commissioned drone captures as geometrically accurate 3D Gaussian splats via API within the Spexi World platform. This workflow links capture capacity, reconstruction compute, and standardized asset delivery, and it elevates integration layers (connectors, metadata, and asset management) as key points of value creation alongside core algorithms.
Competitive Landscape
The 3D reconstruction market is moderately concentrated. The top five suppliers, Autodesk, Bentley Systems, Trimble, Hexagon, and Matterport, collectively account for most of revenue. Each is folding reality capture deeper into flagship CAD and PLM suites to cement account control. Autodesk integrated neural-radiance-field reconstruction into ReCap Pro 2025, and Bentley extended its iTwin cloud environment through the USD 1.2 billion Seequent acquisition to seamlessly couple subsurface and surface models. Trimble’s USD 2.124 billion purchase of Transporeon expanded its mapping stack into logistics, signaling a strategy of integrating spatial data with supply-chain execution.
Specialists respond by sharpening vertical focus. Pix4D tailors products for agriculture and mining, Agisoft emphasizes forensic photogrammetry, and GeoSLAM dominates handheld SLAM scanners in mining and underground construction. AI is now a decisive differentiator: Hexagon’s partnership with NVIDIA embeds GPU-accelerated semantic segmentation, halving reconstruction times for large industrial sites. Siemens and Dassault Systèmes link capture engines with manufacturing simulation to shorten design-to-production cycles, defending industrial domains against pure-play entrants.
Price competition is intensifying as the costs of LiDAR and cameras fall and consumer-grade devices achieve sufficient accuracy for many tasks. Turnkey service bureaus must differentiate themselves via domain expertise, rapid turnaround, and integrated analytics, rather than relying solely on equipment access. Compliance credentials, including ISO 19650, SOC 2, and GDPR, as well as national cybersecurity certifications, also influence public-sector tenders, reinforcing the edge held by well-capitalized incumbents with global data center footprints.
3D Reconstruction Industry Leaders
-
Autodesk Inc.
-
Pix4D SA
-
Agisoft LLC
-
Bentley Systems Incorporated
-
Matterport Inc.
- *Disclaimer: Major Players sorted in no particular order
3D Reconstruction Market Companies Covered in this Report
- Autodesk Inc.
- Pix4D SA
- Agisoft LLC
- Bentley Systems Incorporated
- Capturing Reality s.r.o.
- Matterport Inc.
- Paracosm Inc.
- PhotoModeler Technologies
- Trimble Inc.
- Hexagon AB
- FARO Technologies Inc.
- Siemens AG
- Dassault Systèmes SE
- 3Dflow SRL
- Skyline Software Systems Inc.
- NavVis GmbH
- GeoSLAM Ltd.
- DroneDeploy Inc.
- SimActive Inc.
- Artec Europe S.à r.l. (Artec 3D)
- SZ DJI Technology Co. Ltd.
Market Opportunities and Future Outlook
Interoperable volumetric content is a clear whitespace as Gaussian splatting and volumetric media move from experimentation to operational pipelines. In 2026, UHD World Association published a spatial imaging standard for 3D Gaussian Splatting content using glTF as the storage format (introducing the EGSC codec), while Khronos started formal work to extend glTF for volumetric media via a dedicated subgroup and a liaison with the Volumetric Format Association. This standards momentum creates room for vendors that provide end-to-end toolchains for capture logging, provenance metadata, compression, and cross-platform playback, especially for media and entertainment teams that need reusable assets across real-time engines and web delivery.
A second opportunity is packaging industrial scan-to-BIM workflows as repeatable solutions that unify mobile SLAM and high-accuracy laser scanning into a single operational dataset for digital twins, retrofit clash detection, and site documentation. Evidence of productization is also appearing in adjacent buyers: Sony Electronics launched its XYN Spatial Capture Solution in April 2026 to generate high-quality 3DCG assets from real-world spaces for virtual production, with broader applications referenced for manufacturing and digital twins. Telecom and enterprise marketing teams also show pull for lighter-weight 3D creation and distribution, illustrated by CenturyLink using Tripo Studio AI 3D tools (June 2026) to build interactive 3D product animations and network visualizations. Together, these signals point to solution stacks that combine fast capture, mesh/splat generation, and enterprise-ready delivery (APIs, access control, and data residency options) rather than standalone reconstruction engines.
Recent Industry Developments in 3D Reconstruction Market
- May 2026: Pix4D added Gaussian splatting capabilities to PIX4Dmatic, expanding professional photogrammetry workflows toward splat-based reconstruction outputs. The development supports higher-fidelity, faster-to-render models for surveying and inspection deliverables while aligning Pix4D with emerging volumetric content pipelines.
- February 2026: Esri and Pix4D launched a real-time terrestrial mapping workflow that publishes PIX4Dcatch outputs into ArcGIS Online as 3D models and point clouds. This tightens integration between reconstruction tools and GIS distribution, simplifying how enterprise users operationalize captured reality inside geospatial systems of record.
- April 2025: Autodesk released ReCap Pro 2026 with updated scan-to-mesh capabilities and a Revit plugin designed to manage segmented mesh datasets. The release strengthens Autodesk's scan-to-BIM workflow by reducing friction between field capture, reconstruction outputs, and downstream model coordination in design and construction teams.
3D Reconstruction Market Report Scope and Research Methodology
Market Definition and Coverage
This market is the revenue earned from 3D reconstruction software and related services that convert images, video, or sensor scans into measurable 3D models used for visualization, inspection, and digital-twin workflows across industries.
Scope exclusions: Hardware devices used to capture data (such as cameras, scanners, drones, and sensors) are excluded from this market sizing.
Segments Covered in This Report
- By Component
- Software
- Services
- By Technology Type
- Active 3D Reconstruction
- Passive 3D Reconstruction
- By Deployment Model
- On-Premise
- Cloud
- By Application
- Construction and Architecture
- Healthcare and Medical Imaging
- Media and Entertainment
- Cultural Heritage and Museum
- Industrial Manufacturing and Inspection
- Public Safety and Forensics
- Robotics and Drones
- Education and Research
- Gaming and Virtual Reality
- By Geography
- North America
- United States
- Canada
- Mexico
- Europe
- Germany
- United Kingdom
- France
- Italy
- Rest of Europe
- Asia-Pacific
- China
- Japan
- India
- South Korea
- Australia
- Rest of Asia-Pacific
- Middle East and Africa
- Middle East
- Saudi Arabia
- United Arab Emirates
- Rest of Middle East
- Africa
- South Africa
- Egypt
- Rest of Africa
- Middle East
- South America
- Brazil
- Argentina
- Rest of South America
- North America
Data Sources, Market Sizing, and Validation
Desk Research
Desk work was used to set market boundaries, build the first demand indicators, and check whether the direction of growth looked realistic for 3D reconstruction software. We referred to public sources such as the US Bureau of Labor Statistics, the US Census Bureau, Eurostat, the World Bank, and ISO documentation where relevant (for example, on metrology and digital data handling), along with accessible peer reviewed articles on photogrammetry and point cloud processing.
To tie the market to real spending pools, we also used company annual reports, investor presentations, product documentation, and reputable tech and construction press coverage that tracks deployments in AEC, manufacturing inspection, and healthcare imaging. In a few places, paid subscriptions for company financials and patent databases helped confirm product focus and commercialization intensity without over relying on one source. These examples are illustrative only, and many other references were used for collection, cross checks, and clarification.
Primary Interviews and Surveys
Primary conversations were run with solution providers, system integrators, and enterprise users across AEC, industrial inspection, and medical imaging, so assumptions could be pressure tested in plain language. We asked about deployment mix (cloud versus on premise), typical contract structure (subscription, usage based, and services), and the practical triggers behind upgrades. The input then helped close gaps left by public data.
Distribution of primary research fieldwork respondents
| Company type | Respondent position | Region |
|---|---|---|
| Top tier: 32% | CXOs: 16% | APAC: 47% |
| Mid tier: 49% | Functional/Unit leaders: 31% | EMEA: 29% |
| Smaller Players: 19% | Managers: 53% | Americas: 24% |
Market-Sizing & Forecasting
Sizing started with a top-down demand pool build where software and services spend was reconstructed from adoption across core use cases like construction progress capture, industrial metrology and inspection, and healthcare visualization, and then split by region and deployment. To keep the model grounded, results were corroborated with selective bottom-up approximations, including sampled price points for subscriptions, typical services attach rates, and channel checks on project volumes, which were then used to adjust totals when the two views did not line up.
Inputs that mattered in this market included the share of projects moving to digital-twin workflows, cloud processing penetration for heavy point-cloud workloads, usage intensity measured by scans or projects per account, average contract length, and services intensity for setup, training, and model cleanup. Where public data did not provide clean splits between software and services, we used interview-led ratios by application and then rechecked them against observed packaging on product pages and public case studies.
For forecasting, scenario analysis was used because adoption can swing based on construction cycles, capex timing in manufacturing, and GPU and cloud cost trends. Assumptions were carried forward using a blend of macro indicators and expert consensus, and where a variable showed stable historical behavior, exponential smoothing was applied to avoid sharp step changes.
Data Validation & Update Cycle
Validation was done through several cross checks so the outputs stayed consistent with real market signals tied to 3D reconstruction adoption. We compared growth rates and regional shares against independent indicators like construction activity, industrial production, and imaging procedure volumes, and then flagged outliers for a second review before sign off.
When a large variance appeared, the model was reopened and respondents were re contacted to confirm whether the issue came from pricing, deployment mix, or a one time project spike. Reports are refreshed annually, and interim updates are made when material events happen, such as major regulation changes, technology shifts, or a visible change in enterprise buying behavior. Before delivery, an analyst runs a fresh pass on key assumptions so clients receive the latest updated view.
Mordor Intelligence's 3d Reconstruction Market Size Compared With Other Published Estimates
Published market sizes for 3D reconstruction can look far apart, even when they talk about similar end uses. The gap usually comes from what is counted as revenue, what year is treated as the starting point, and how pricing and cloud usage are projected forward.
Hardware capture devices are excluded here and that single exclusion explains part of the spread, because some publications blend scanners, drones, and sensors into the same revenue bucket that sits outside Mordor Intelligence's scope for this report. Differences also show up when one estimate assumes rapid cloud migration and bundles services more heavily, or when currency conversion timing and update cadence are not aligned to the same base year.
Benchmark comparison
| Source | Market Size | Gaps in Research Methodology |
|---|---|---|
| Mordor Intelligence | USD 1.86 B (2026) | |
| Industry Publisher A | USD 0.93 B (2024) | Uses an earlier base year and a slower growth path, which can understate later adoption in cloud processing and inspection workflows. The scope description is less clear on how services attach and pricing ramps are handled across regions. |
| Industry Publisher B | USD 1.38 B (2024) | Combines a broader technology narrative with limited detail on component boundaries, which can shift totals depending on whether related capture and imaging items are blended in. Longer horizon forecasting also widens outcomes when scenario assumptions are not tied back to near term deployment evidence. |
Looking across the figures, the differences mostly trace back to component coverage, base year choice, and how cloud usage and services revenue are scaled over time. Our approach keeps the total traceable to adoption and pricing variables that can be checked, and it avoids mixing adjacent hardware revenue that would inflate the addressable market.
Key Questions Answered in the Report
What is the projected value of the 3D reconstruction market in 2031?
The market is forecast to reach USD 3.19 billion by 2031, reflecting an 11.39% CAGR over 2026-2031.
Which component is growing fastest within 3D reconstruction solutions?
Services, including managed capture, cloud processing, and workflow consulting, are expanding at an 11.67% CAGR through 2031.
Why are passive photogrammetry methods gaining ground on active LiDAR solutions?
Neural radiance fields and other AI techniques have narrowed the accuracy gap while keeping hardware costs low, driving an 11.75% CAGR for passive systems.
Which application area is expected to record the highest growth rate?
Robotics and drones lead with a projected 12.98% CAGR as autonomous navigation and warehouse automation demand real-time spatial mapping.
How are privacy regulations affecting urban-scale 3D scanning projects?
GDPR and proposed AI-governance rules require explicit consent and regional data processing, increasing compliance costs but favoring vendors with in-region cloud infrastructure.