Market Overview
| Study Period | 2020 - 2031 |
|---|---|
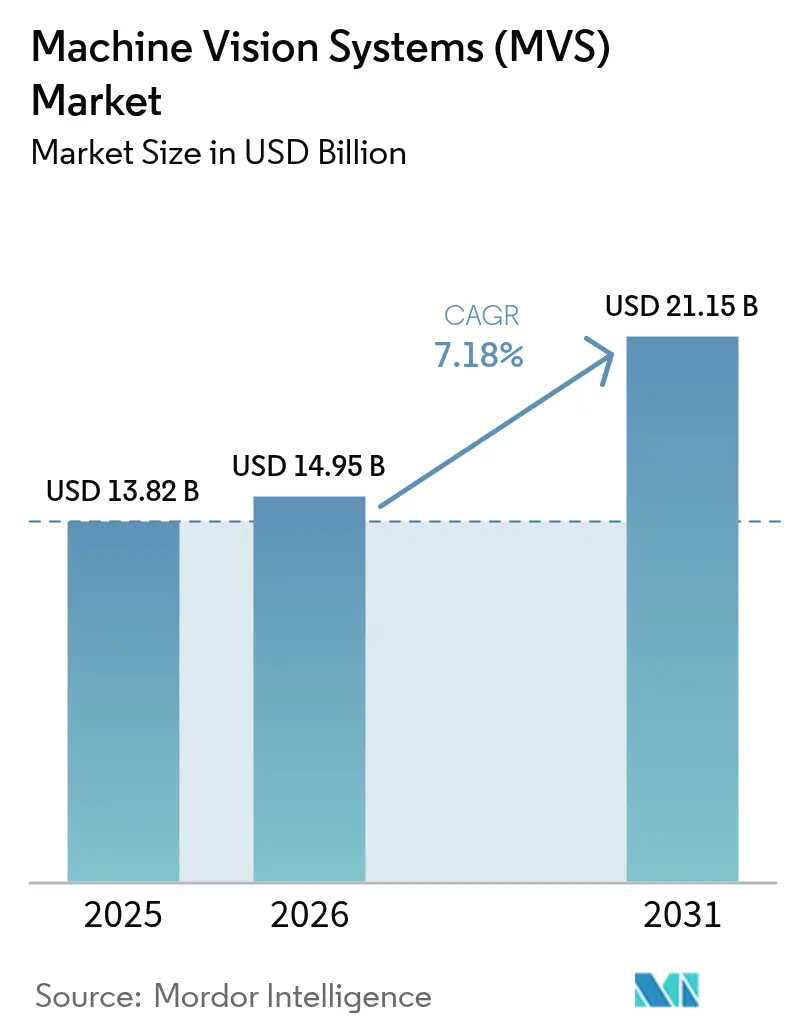
| Market Size (2026) | USD 14.95 Billion |
| Market Size (2031) | USD 21.15 Billion |
| Growth Rate (2026 - 2031) | 7.18% CAGR |
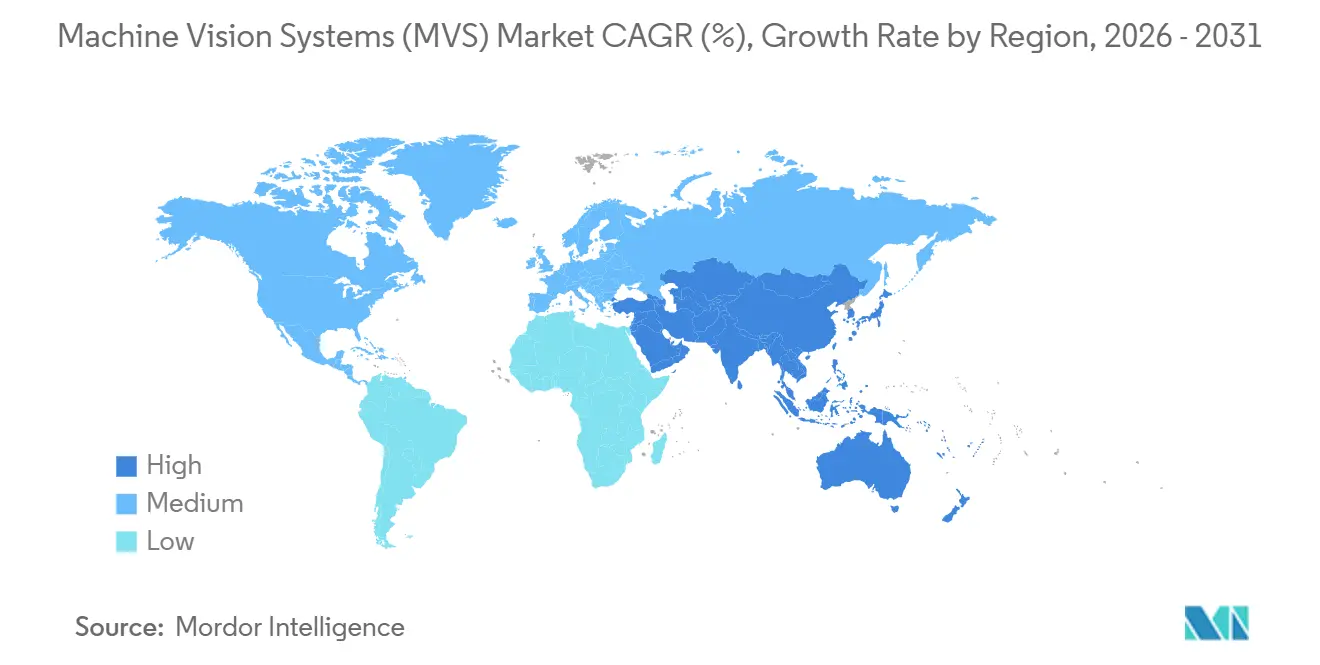
| Fastest Growing Market | Middle East |
| Largest Market | Asia Pacific |
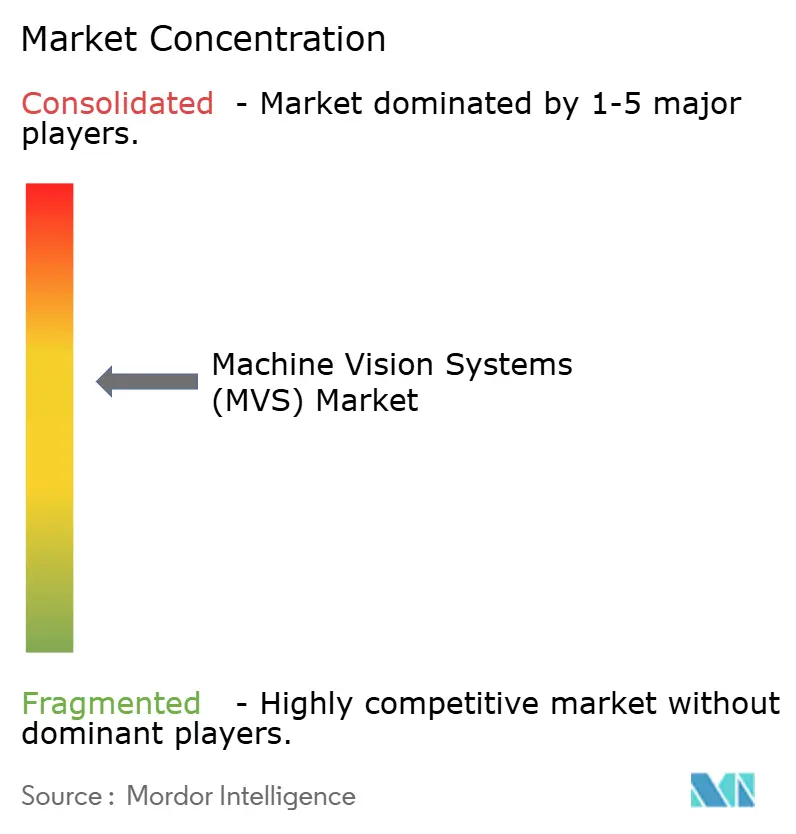
| Market Concentration | Medium |
Major Players *Disclaimer: Major Players sorted in no particular order Image © Mordor Intelligence. Reuse requires attribution under CC BY 4.0. | |
Machine Vision Systems (MVS) Market Analysis by Mordor Intelligence
The machine vision systems market size is projected to expand from USD 13.82 billion in 2025 and USD 14.95 billion in 2026 to USD 21.15 billion by 2031, registering a CAGR of 7.18% between 2026 to 2031. Tightening zero-defect mandates in automotive and electronics manufacturing, combined with sovereign industrial-automation policies, are accelerating the pivot from manual inspection to optical automation. On-device AI inference chips now deliver sub-millisecond classification at the edge, allowing semiconductor fabs and battery plants to sustain yields above 95% without cloud latency. Asia-Pacific remains the largest revenue contributor, while the Middle East registers the fastest growth thanks to industrial-diversification agendas. Software subscriptions, smart cameras, and 3D imaging collectively reshape procurement criteria, pushing vendors to bundle analytics, hardware, and support in subscription packages. Competitive intensity stays moderate, with the top three suppliers holding roughly one-third of revenue and niche specialists scaling rapidly through differentiated 3D metrology and AI accelerators.
Key Report Takeaways
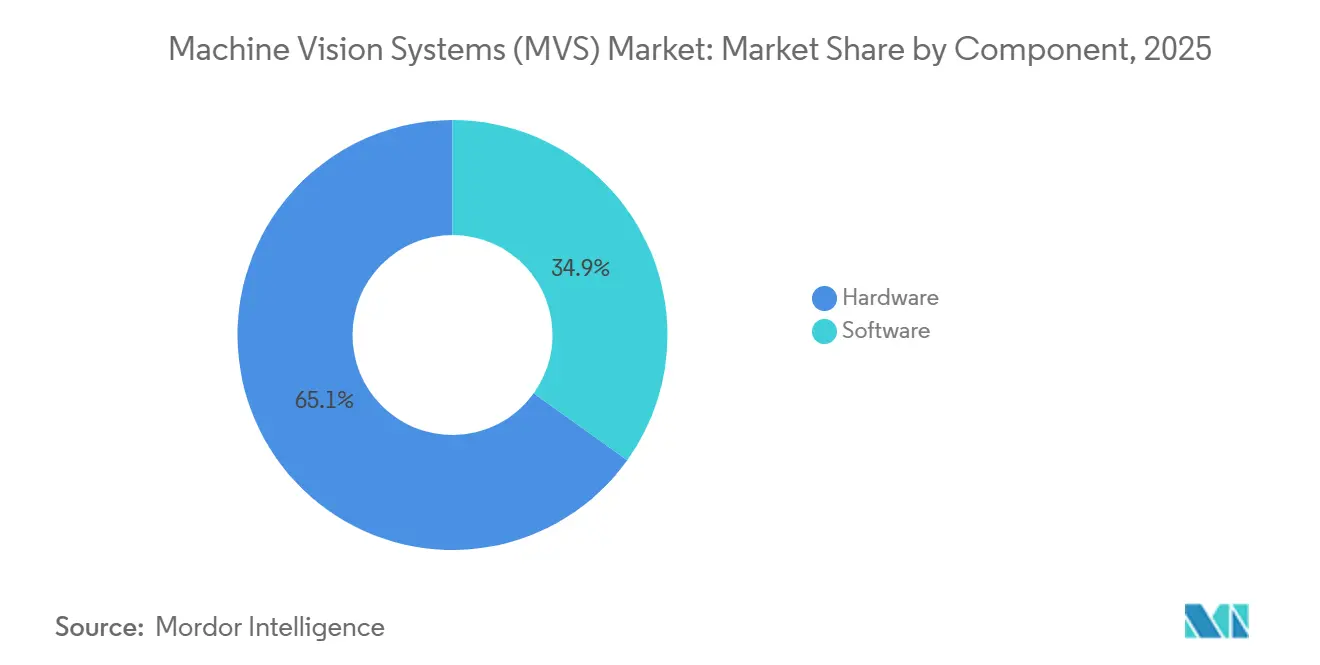
- By component, hardware led with 65.11% of the machine vision systems market share in 2025, whereas software is advancing at a 7.21% CAGR through 2031.
- By product type, PC-based led with 58.02% of the machine vision systems market share in 2025, whereas smart cameras are advancing at a 7.92% CAGR through 2031.
- By imaging type, 2D Imaging led with 71.03% of the machine vision systems market share in 2025, whereas 3D Imaging is the fastest growing, expanding at a 7.21% CAGR to 2031.
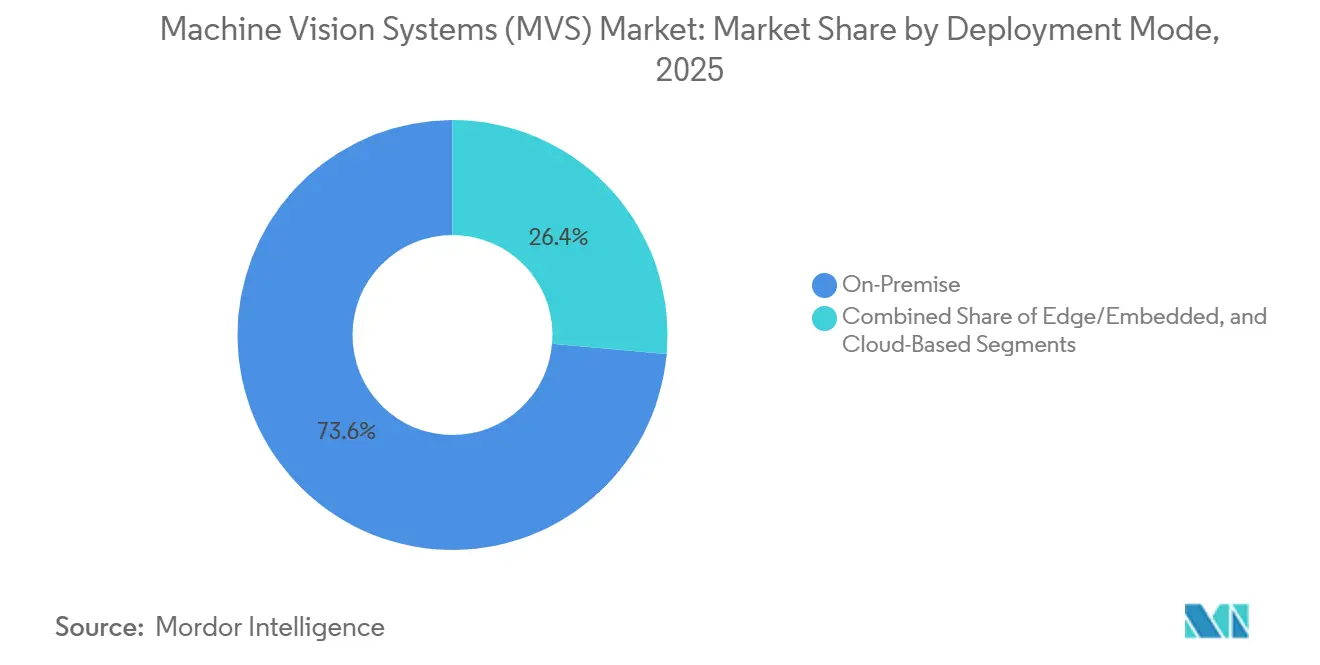
- By deployment mode, on-premises led with 73.60% of the machine vision systems market share in 2025, whereas cloud-based platforms accelerated at a 7.32% CAGR over 2026-2031.
- By end user, automotive led with a 23.85% of the machine vision systems market share in 2025, whereas healthcare and pharmaceutical applications are posting the highest growth at a 9.16% CAGR to 2031.
- By geography, Asia-Pacific led with 40.25% of the machine vision systems market share in 2025, whereas the Middle East is the fastest growing, expanding at an 8.43% CAGR over 2026-2031.
Note: Market size and forecast figures in this report are generated using Mordor Intelligence’s proprietary estimation framework, updated with the latest available data and insights as of 2026.
Global Machine Vision Systems (MVS) Market Trends and Insights
Drivers Impact Analysis*
| Driver | (~) % Impact on CAGR Forecast | Geographic Relevance | Impact Timeline |
|---|---|---|---|
| Rising Need for Zero-Defect Manufacturing | +1.2% | Germany, Japan, South Korea, United States | Medium term (2-4 years) |
| Increasing Adoption of Vision-Guided Robotics | +1.0% | China, Japan, North America, Europe | Medium term (2-4 years) |
| Growing Demand for 3D Vision in Miniaturization | +0.9% | China, Taiwan, South Korea, Vietnam | Short term (≤2 years) |
| Surge in On-Device AI Inference Chips | +1.3% | North America and Asia-Pacific | Short term (≤2 years) |
| Stringent Quality Rules for Food and Pharma | +0.8% | North America and European Union, expanding Middle East | Long term (≥4 years) |
| Emergence of Vision-as-a-Service Models | +0.7% | North America and Europe, gradual Asia-Pacific uptake | Medium term (2-4 years) |
| Source: Mordor Intelligence | |||
Rising Need for Zero-Defect Manufacturing
Automotive and aerospace suppliers now halt production within 200 milliseconds of detecting weld-bead misalignment, underscoring how near-zero defect targets redefine throughput expectations. Electric-vehicle battery recalls triggered multi-million-dollar liabilities in 2025, prompting tier-1 suppliers to install high-speed line-scan cameras capable of inspecting 10 meters of continuous material each second. GigE Vision and CoaXPress interfaces secure the necessary 10 gigabit-per-second bandwidth, while integrated vision-robot cells feed alerts directly to programmable logic controllers that stop assembly lines before scrap propagates. The pivot bolsters demand for ruggedized optics rated for 24-hour operation in harsh, vibration-prone environments. Regulatory pressure and warranty-cost containment ensure the driver maintains medium-term momentum.
Increasing Adoption of Vision-Guided Robotics
Collaborative robots equipped with 3D perception now replace fixed jigs where product-mix changes weekly, trimming changeover time from hours to minutes and supporting lot-size-one manufacturing. Subsidies under China’s smart-manufacturing programs offset capital expenses, catalyzing deployments in electronics assembly and logistics sorting. Japan’s aging workforce further accelerates uptake, as factories compensate for labor shortages with robot density already exceeding 399 units per 10,000 workers.[1]“Robot Density Nearly Doubled Globally,” International Federation of Robotics, ifr.org Integration of vision with force-torque sensing permits delicate handling, enabling inspection of fragile pharmaceutical vials for 50-micron cracks without breakage. Momentum spreads to North American suppliers that retrofit legacy lines to fulfill reshoring contracts calling for flexible automation.
Growing Demand for 3D Vision in Electronics Miniaturization
Smartphone and wearable makers down-scaled to 0201 and 01005 surface-mount components, rendering 2D inspection insufficient for solder quality. Structured-light scanners measure solder-joint coplanarity with 1-micron accuracy, detecting tombstoning and bridging defects invisible to conventional cameras. Advanced-packaging lines now integrate inline 3D metrology to verify die-attach flatness within 5 microns, a tolerance critical to thermal conductivity in multi-chip modules. Semiconductor foundries expanding advanced-packaging capacity by 40% in 2025 drove bulk orders for 3D systems capable of imaging through transparent encapsulants.[2]“TSMC to Expand Advanced Packaging Capacity by 40% in 2025,” Nikkei Asia, asia.nikkei.com Rapid deployment cycles favor modular 3D cameras that clip into existing GigE Vision networks without rewiring plant infrastructure.
Surge in On-Device AI Inference Chips
Edge-AI accelerators decouple classification accuracy from cloud connectivity, delivering 30 TOPS within a 5-watt envelope appropriate for battery-operated drones and handheld testers. Millisecond-level inference enables continuous inspection even in network dead zones or sovereign-data environments. Sensor makers now embed neural-processing units on the image-sensor die, collapsing hardware footprints and cutting bill-of-materials costs by up to 40%. Logistics operators testing sparse-computation architectures project 10× energy efficiency, allowing thousands of parcel-sorting units to operate within legacy power budgets.[3]“Drug Supply Chain Security Act: Law and Policies,” U.S. Food and Drug Administration, fda.gov As inference shifts to silicon, software vendors pivot to subscription-priced analytics to preserve recurring revenue.
Restraints Impact Analysis*
| Restraint | (~) % Impact on CAGR Forecast | Geographic Relevance | Impact Timeline |
|---|---|---|---|
| Lack of Skilled Machine Vision Integrators | -0.6% | North America and Europe, emerging Asia-Pacific | Medium term (2-4 years) |
| High Cost of High-Resolution and Hyperspectral Cameras | -0.5% | Global, acute in cost-sensitive segments | Short term (≤2 years) |
| Cybersecurity Risks in Cloud Vision Systems | -0.4% | Global, heightened in pharma and defense | Long term (≥4 years) |
| Supply-Chain Volatility of Image Sensors | -0.5% | Global, concentrated impact on automotive and industrial OEMs | Medium term (2-4 years) |
| Source: Mordor Intelligence | |||
Lack of Skilled Machine Vision Integrators
Retirements among engineers versed in legacy PC-based platforms widen the skills gap, with 68% of North American manufacturers citing talent shortages as the prime deployment hurdle. Hourly rates for senior integrators exceed USD 200, putting sophisticated calibrations out of reach for small enterprises. Vendors respond with drag-and-drop training suites and remote commissioning, yet regulated sectors balk at off-site access due to data-residency rules. Community-college programs lag behind fast-evolving AI inference techniques, leaving an immediate deficit unlikely to close in the medium term.
High Cost of High-Resolution and Hyperspectral Cameras
Cameras exceeding 20 megapixels or capturing 100+ spectral bands list between USD 10,000 and USD 100,000, limiting deployment to aerospace composites, display inspection, and premium food lines. Custom optics and scarce large-format CMOS wafers inflate bill-of-materials costs, while fabrication yields constrain supply. Logistics operators deploying hundreds of low-cost scanners trade resolution for affordability, reinforcing a bifurcated market where premium units serve niche, high-value inspections and volume applications adopt commodity sensors. Price erosion remains slow given persistent sensor-supply constraints.
*Our forecasts treat driver/restraint impacts as directional, not additive. The impact forecasts reflect baseline growth, mix effects, and variable interactions.
Segment Analysis
By Component: Software Gains as AI Algorithms Commoditize
Hardware commanded 65.11% of the machine vision systems market share in 2025 as cameras, lenses, and lighting constitute the indispensable physical layer. Software revenue, advancing at a 7.21% CAGR, reflects the shift from perpetual licenses to subscription bundles that supply continuous algorithm updates. Edge-embedded neural logic further blurs the distinction between silicon and code, consolidating value in turnkey solutions.
Manufacturers adopting vision-as-a-service reduce upfront spending, paying monthly fees that include cloud storage and model retraining. Vendors preload defect classifiers for solder joints, weld beads, or pharmaceutical barcodes, enabling rapid deployment without in-house data science. As generic convolutional networks saturate the field, suppliers differentiate through vertical-specific workflows, integrating process-control signals and enterprise resource-planning hooks to retain customers.


By Product Type: Smart Cameras Displace PC Architectures
PC-based platforms still account for 58.02% of the machine vision systems market size, favored where multi-camera synchronization or hyperspectral processing exceeds embedded compute limits. Yet smart-camera units grow at a 7.92% CAGR, integrating ARM processors and AI accelerators inside housings smaller than a deck of cards.
Compact form factors reduce cabling and panel-space requirements, crucial for logistics hubs deploying hundreds of parcel-sorting stations. Embedded inference eliminates external computers, slashing power consumption and heat dissipation. Hybrid topologies appear where edge units screen routine defects and escalate anomalies to centralized servers for deeper analysis, balancing cost and throughput in high-mix lines.
By Imaging Type: 3D Systems Capture Electronics and Packaging
Two-dimensional cameras retain 71.03% of revenue, adequate for barcode reading and label verification. However, 3D platforms expand at a 7.21% CAGR as electronics miniaturization and advanced packaging demand sub-micron depth measurement. The machine vision systems market size for 3D solutions accelerates as semiconductor fabs invest in structured-light scanners that verify die coplanarity within 5 microns.
Hyperspectral sensors remain niche due to five-figure price tags and high computational loads, but early adopters in food safety and aerospace composites justify spend where contamination or delamination carries outsized risk. Research prototypes targeting sub-USD 1,000-per-megapixel price points could democratize 3D imaging in warehouse robotics by the decade’s end.
By Deployment Mode: Edge Gains Despite Cloud Economics
On-premise installations held 73.60% share in 2025 as manufacturers prioritized deterministic latency and data sovereignty. Yet cloud platforms progress at a 7.32% CAGR, appealing where centralized model retraining outweighs cybersecurity concerns. Hybrid edge architectures synchronize selective data to the cloud, enabling real-time inference locally while benefiting from periodic algorithm refreshes.
Automotive and aerospace plants demand sub-200-millisecond response times unattainable via public clouds, so they deploy inference at the edge and reserve cloud resources for historical analytics. Private 5G networks trim latency further, edging cloud resources physically closer to production lines. Compliance with IEC 62443 emerges as a baseline requirement, ensuring segment-network isolation and zero-trust authentication.

By End-User Industry: Healthcare Outpaces Automotive
Automotive retained 23.85% share in 2025, anchored in long-standing zero-defect mandates. Healthcare and pharmaceutical users, propelled by serialization requirements, expand at a 9.16% CAGR, making them the fastest-growing adopters. The machine vision systems market size for healthcare applications rises as packaging lines retrofit high-dynamic-range sensors to read barcodes at 600 units each minute.
Electronics and semiconductors remain a volume driver for 3D systems, while food and beverage processors pilot hyperspectral cameras to detect chemical residues and verify ingredient ratios. Logistics and retail favor smart cameras for shelf monitoring and parcel sorting, valuing low unit cost over maximum resolution. Aerospace, textiles, and printing form a long-tail of specialized niches adopting vision for safety and quality assurance.
Geography Analysis
Asia-Pacific captured 40.25% of 2025 revenue as China’s USD 1.4 billion subsidy program and Japan’s robot density underpin high adoption. South Korea invested heavily in semiconductor inspection to keep yields competitive with leading foundries, further enlarging regional demand. Diverse manufacturing bases, from consumer electronics to automotive powertrains, concentrate procurement of smart cameras and 3D scanners.
The Middle East records the highest regional CAGR at 8.43% through 2031. Saudi Arabia’s Vision 2030 funds smart factories in Riyadh and Jeddah, mandating inline vision tools for automotive components and consumer-electronics assembly. The United Arab Emirates equips pharmaceutical and food-processing plants with serialization-compliant inspection to satisfy European export rules, while Turkey integrates vision-guided robots to serve Western OEMs with zero-defect parts.
North America and Europe collectively absorb the remaining demand, catalyzed by reshoring incentives and Industry 4.0 tax credits. U.S. automotive and aerospace lines prioritize high-resolution and hyperspectral units to mitigate liability exposure. Germany embeds vision in digital-factory blueprints, and France funds SME automation grants that include optical inspection. South America and Africa remain emergent markets, with sporadic deployments in Brazilian automotive hubs and South African mining operations.

Competitive Landscape
Cognex, Keyence, and Omron command about 35% of market revenue, bundling cameras, software, and integration services that shorten deployment cycles. Cognex leverages its ViDi deep-learning suite within North American automotive plants, while Keyence dominates Japanese and South Korean facilities through robust technical support. Omron strengthens its position via partnerships that embed vision data into enterprise automation stacks.
Challenger firms target niches to erode incumbent share. Coherix addresses sub-micron electronics inspection with structured-light systems, and Moffett Antoum supplies sparse-compute AI chips promising 10× energy efficiency for logistics hubs. Vision-as-a-service vendors raise venture funding to convert one-time hardware sales into recurring subscriptions, compressing hardware margins and shifting competition to analytics ecosystems.
Strategic moves include Teledyne’s acquisition of coordinate-measurement capabilities for dimensional inspection synergies and Sony’s silicon-embedded AI logic that captures downstream software value. Patent filings cluster around edge inference and multi-sensor fusion, signaling future differentiation in software rather than optics alone. Vendors cultivate partner programs with system integrators and robotics OEMs to mitigate the talent gap and accelerate installation lead times.
Machine Vision Systems (MVS) Industry Leaders
Cognex Corporation
Keyence Corporation
Omron Corporation
IDS Imaging Development Systems GmbH
Atlas Copco AB (ISRA Vision)
- *Disclaimer: Major Players sorted in no particular order

Recent Industry Developments
- September 2025: Exotec and E80 Group formed a partnership to deliver integrated warehouse automation that combines Skypod AMRs with pallet-handling systems.
- July 2025: Hailo launched the Hailo-10H edge AI accelerator, the first discrete chip marketed for on-device generative AI workloads in vision endpoints.
- July 2025: Amazon Industrial Innovation Fund invested in Cambridge Terahertz, backing compact 3D terahertz imaging for return-fraud detection.
- June 2025: LuminX raised USD 5.5 million to commercialize vision-language models for distribution-center automation.


Global Machine Vision Systems (MVS) Market Report Scope
Machine vision systems indicate the substitution of human visual sense and judgment capabilities with a video camera and computer while performing an inspection task. It is the automatic acquisition and analysis of images to obtain the desired data for controlling or evaluating a specific part or activity.
The Machine Vision Systems Market Report is Segmented by Component (Hardware, and Software), Product Type (PC-Based, and Smart Camera-Based), Imaging Type (2D, 3D, and Hyperspectral), Deployment Mode (On-Premise, Edge, and Cloud), End-User Industry (Automotive, Electronics, Food and Beverage, Healthcare, Logistics, and More), and Geography. The Market Forecasts are Provided in Terms of Value (USD).
By Component
| Hardware |
| Software |
By Product Type
| PC-Based |
| Smart Camera-Based |
By Imaging Type
| 2D Imaging |
| 3D Imaging |
| Hyperspectral and Multispectral Imaging |
By Deployment Mode
| On-Premise |
| Edge/Embedded |
| Cloud-Based |
By End-User Industry
| Automotive |
| Electronics and Semiconductors |
| Food and Beverage |
| Healthcare and Pharmaceutical |
| Logistics and Retail |
| Other End-User Industries |
By Geography
| North America | United States |
| Canada | |
| Mexico | |
| South America | Brazil |
| Argentina | |
| Rest of South America | |
| Europe | Germany |
| United Kingdom | |
| France | |
| Italy | |
| Spain | |
| Rest of Europe | |
| Asia-Pacific | China |
| India | |
| Japan | |
| South Korea | |
| Australia and New Zealand | |
| Rest of Asia-Pacific | |
| Middle East | Saudi Arabia |
| United Arab Emirates | |
| Turkey | |
| Rest of Middle East | |
| Africa | South Africa |
| Nigeria | |
| Egypt | |
| Rest of Africa |
| By Component | Hardware | |
| Software | ||
| By Product Type | PC-Based | |
| Smart Camera-Based | ||
| By Imaging Type | 2D Imaging | |
| 3D Imaging | ||
| Hyperspectral and Multispectral Imaging | ||
| By Deployment Mode | On-Premise | |
| Edge/Embedded | ||
| Cloud-Based | ||
| By End-User Industry | Automotive | |
| Electronics and Semiconductors | ||
| Food and Beverage | ||
| Healthcare and Pharmaceutical | ||
| Logistics and Retail | ||
| Other End-User Industries | ||
| By Geography | North America | United States |
| Canada | ||
| Mexico | ||
| South America | Brazil | |
| Argentina | ||
| Rest of South America | ||
| Europe | Germany | |
| United Kingdom | ||
| France | ||
| Italy | ||
| Spain | ||
| Rest of Europe | ||
| Asia-Pacific | China | |
| India | ||
| Japan | ||
| South Korea | ||
| Australia and New Zealand | ||
| Rest of Asia-Pacific | ||
| Middle East | Saudi Arabia | |
| United Arab Emirates | ||
| Turkey | ||
| Rest of Middle East | ||
| Africa | South Africa | |
| Nigeria | ||
| Egypt | ||
| Rest of Africa | ||


Key Questions Answered in the Report
How large will the machine vision systems market be by 2031?
It is forecast to reach USD 21.15 billion by 2031, growing at a 7.18% CAGR from 2026.
Which segment is expanding fastest within machine vision adoption?
Healthcare and pharmaceutical applications lead with a 9.16% CAGR through 2031 as serialization deadlines tighten.
Why are smart cameras gaining share over PC-based systems?
Embedded AI processors reduce cabling, power draw, and capital cost, enabling real-time inference inside compact housings.
What is driving regional growth in the Middle East?
Saudi Arabia’s Vision 2030 and UAE investments in pharma and food plants fuel an 8.43% CAGR, the highest worldwide.
How are vendors addressing the skills gap in vision integration?
They ship no-code configuration tools and offer remote commissioning services, lowering specialist head-count requirements.
Which imaging modality is displacing 2D cameras in electronics assembly?
Three-dimensional structured-light systems that measure solder-joint coplanarity within 1 micron are rapidly replacing 2D units.
Page last updated on:


