Video Advertising Market Size and Share
Market Overview
| Study Period | 2020 - 2031 |
|---|---|
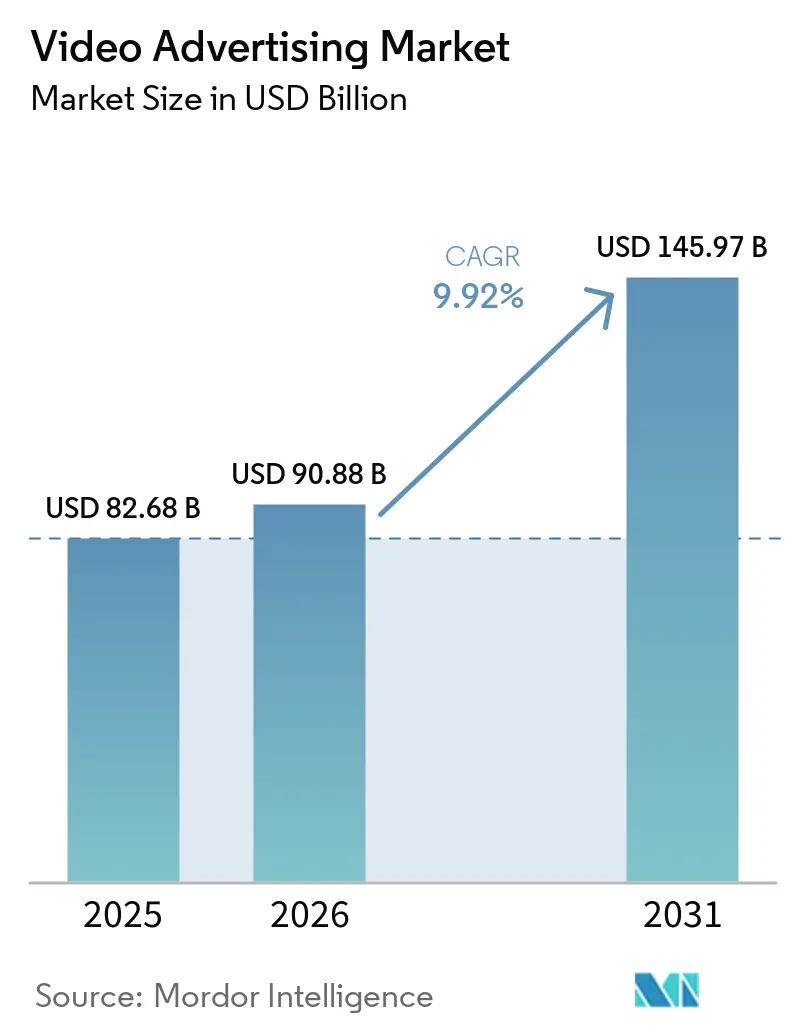
| Market Size (2026) | USD 90.88 Billion |
| Market Size (2031) | USD 145.97 Billion |
| Growth Rate (2026 - 2031) | 9.92% CAGR |
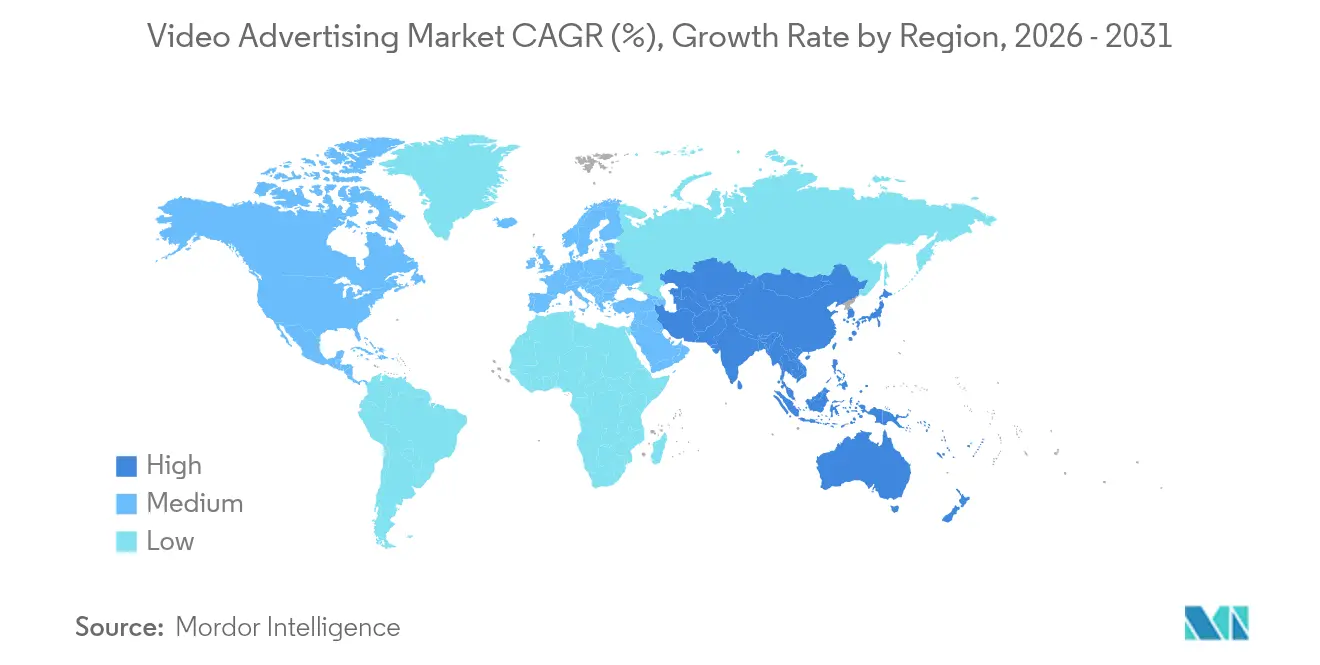
| Fastest Growing Market | Asia Pacific |
| Largest Market | North America |
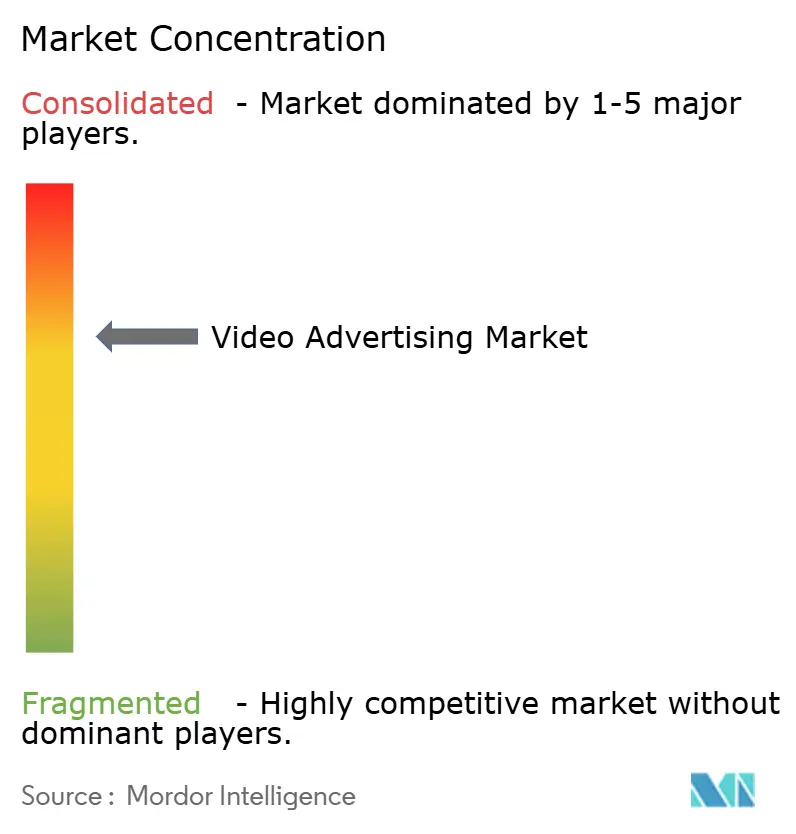
| Market Concentration | Medium |
Major Players *Disclaimer: Major Players sorted in no particular order Image © Mordor Intelligence. Reuse requires attribution under CC BY 4.0. | |
Video Advertising Market Analysis by Mordor Intelligence
The video advertising market size is expected to grow from USD 82.68 billion in 2025 to USD 90.88 billion in 2026 and is forecast to reach USD 145.97 billion by 2031 at 9.92% CAGR over 2026-2031. Advertisers are moving budgets away from linear television toward streaming and mobile environments as audiences embrace on-demand viewing. Connected-TV (CTV) inventory is scaling rapidly because ad-supported tiers already account for more than 50% of new streaming subscribers, giving brands a direct path to high-engagement households. Mobile remains the largest reach vehicle, yet CTV drives the most incremental spend as programmatic platforms offer unified buying across devices. Retail and e-commerce brands dominate investment in shoppable formats that embed instant checkout, while programmatic bidding efficiencies and AI-driven creative optimization lower campaign set-up costs. Rising CPMs linked to premium inventory scarcity and tightening data-privacy rules continue to challenge return-on-ad-spend calculations, but performance-based buying models are mitigating some of that pressure as advertisers pivot toward measurable outcomes.
Key Report Takeaways
- By device, mobile commanded 67.58% of the video advertising market share in 2025, while connected TV is projected to accelerate at a 10.56% CAGR through 2031.
- By ad format, in-stream video accounted for 43.92% of the revenue share in the video advertising market in 2025; shoppable and interactive formats are projected to grow at a 13.44% CAGR through 2031.
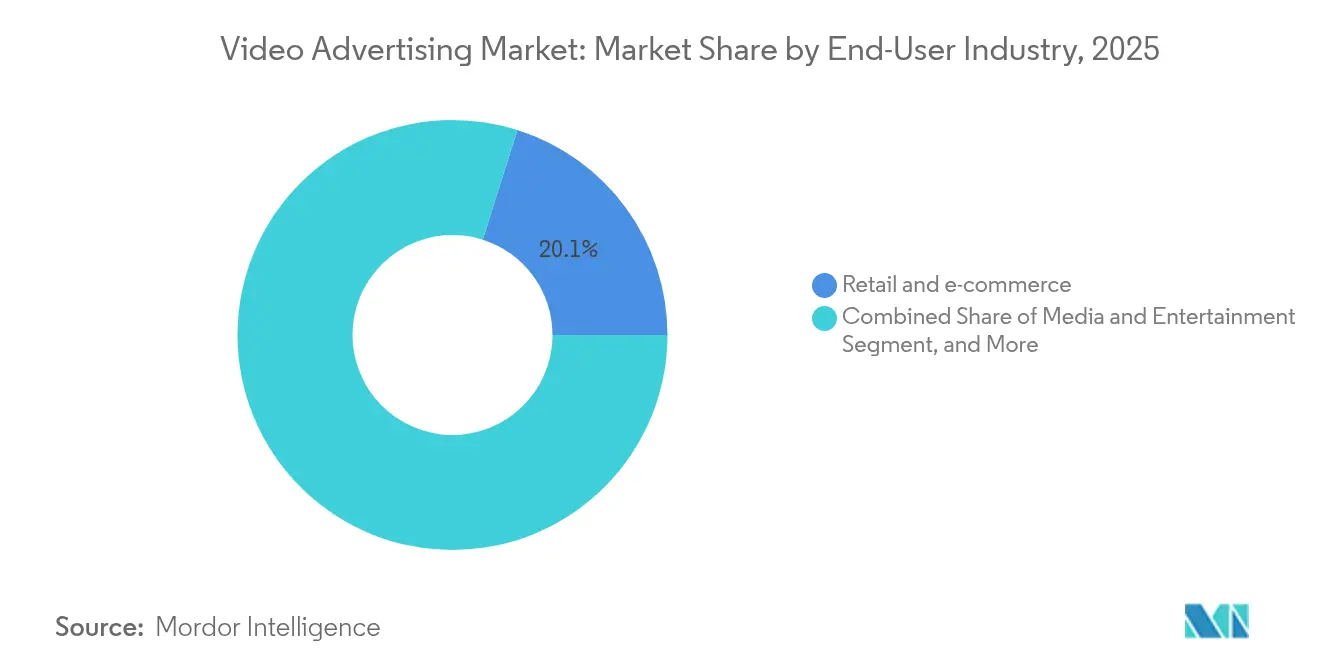
- By end-user industry, retail and e-commerce captured 20.12% share of the video advertising market size in 2025 and is expanding at a 13.17% CAGR.
- By pricing model, CPM-based buying retained 61.35% share of the video advertising market in 2025, whereas cost-per-action is advancing at a 10.41% CAGR.
- By geography, North America led the video advertising market in 2025 with a 36.12% share, while the Asia-Pacific region is the fastest-growing at a 7.42% CAGR.
Note: Market size and forecast figures in this report are generated using Mordor Intelligence’s proprietary estimation framework, updated with the latest available data and insights as of 2026.
Global Video Advertising Market Trends and Insights
Drivers Impact Analysis*
| Driver | (~) % Impact on CAGR Forecast | Geographic Relevance | Impact Timeline |
|---|---|---|---|
| Surging connected-TV household penetration | +6.2% | Global, with North America and Europe leading adoption | Medium term (2-4 years) |
| Programmatic and AI-driven audience targeting efficiency | +5.8% | Global, concentrated in developed markets | Short term (≤ 2 years) |
| 5G-enabled high-quality mobile video deliverability | +4.1% | Asia-Pacific core, expanding to global markets | Medium term (2-4 years) |
| Shoppable video ads integrating instant checkout | +3.7% | North America and Europe, expanding to Asia-Pacific | Short term (≤ 2 years) |
| Gen-Z demand for short-form vertical video | +2.9% | Global, with strongest impact in urban markets | Short term (≤ 2 years) |
| Privacy-friendly contextual ad engines | +1.6% | Europe and North America, driven by regulatory compliance | Long term (≥ 4 years) |
| Source: Mordor Intelligence | |||
Surging Connected-TV Household Penetration
CTV has reached a mainstream scale, with US households averaging 7.5 hours of connected-device viewing per day. Netflix alone has crossed 40 million monthly active ad-supported users within 18 months of launching its lower-priced tier, and ad-tier sign-ups now account for more than 55% of new customers in enabled markets.[2]Netflix, “Advertising tier reaches 40 million monthly actives,” about.netflix.com Automotive brands see tangible influence; 61% of prospective car buyers say CTV ads shaped their vehicle choice. Live sports streaming is further raising CPMs because real-time events sustain viewer attention and create appointment viewing that advertisers value.
Programmatic and AI-Driven Audience Targeting Efficiency
Machine-learning platforms ingest real-time signals to personalise creative, producing up to 6X click-through rates versus traditional targeting. Amazon’s generative-AI video suite lets brands auto-create product demos with dynamic text, music, and voice overlays, cutting production costs and turnaround times.[1]Amazon, “Advertisers gain new generative-AI video tools,” aboutamazon.com As third-party cookies fade, contextual engines that rely on page semantics rather than personal identifiers are expected to capture USD 250 billion in global spend.
5G-Enabled High-Quality Mobile Video Deliverability
Rapid 5G rollouts across Asia-Pacific allow HD and 4K streams to load with minimal buffering, converting commute time into premium ad inventory. Consumers in India and Indonesia cite high-definition mobile video as the top reason for upgrading data plans, and operators bundle zero-rating for select streaming services, extending session length and ad opportunities.
Shoppable Video Ads Integrating Instant Checkout
Interactive commerce is no longer experimental: 84% of viewers purchase after watching branded video, and 41% complete the buy within the ad itself. Retailers embed one-click checkout in TikTok, Instagram and Amazon placements, shortening the path to purchase and yielding conversion rates up to 80% higher than static creative. Luxury labels such as Hermès use WeChat pop-up stores for limited-edition drops that sell out in minutes, proving video’s role as both awareness and transaction channel.
Restraint Impact Analysis*
| Restraint | (~) % Impact on CAGR Forecast | Geographic Relevance | Impact Timeline |
|---|---|---|---|
| Escalating CPMs amid premium inventory scarcity | -4.3% | Global, most acute in mature markets | Short term (≤ 2 years) |
| Ad-blocking and data-privacy regulations shrinking reach | -3.1% | Europe and North America, expanding globally | Medium term (2-4 years) |
| Fragmented CTV measurement hindering attribution | -2.7% | Global, particularly impacting programmatic buying | Medium term (2-4 years) |
| Growing scrutiny of digital-ad carbon footprints | -1.2% | Europe leading, expanding to North America | Long term (≥ 4 years) |
| Source: Mordor Intelligence | |||
Escalating CPMs Amid Premium Inventory Scarcity
Meta disclosed near-40% CPM inflation year-over-year, and YouTube rates climbed 36% as brand dollars chase finite high-attention slots. Technology advertisers now pay USD 6.40 per thousand impressions, double the travel category’s USD 3.20. Brands deploy AI supply-path optimisation to bypass duplicated auctions, yet scarcity persists as streaming services limit ad loads to preserve user experience, keeping demand ahead of supply.
Ad-Blocking and Data-Privacy Regulations Shrinking Reach
The EU Digital Services Act restricts personal-data-based targeting, compelling platforms to rely on contextual signals. Browser-level blockers reduce measurable reach, forcing advertisers to adopt less intrusive formats and invest in first-party data. Financial-services marketers face the heaviest compliance burden, balancing stringent consent rules with customer-acquisition targets.
*Our forecasts treat driver/restraint impacts as directional, not additive. The impact forecasts reflect baseline growth, mix effects, and variable interactions.
Segment Analysis
By Device: Mobile Dominance Drives Cross-Screen Strategies
Mobile generated the largest slice of the video advertising market size at USD 55.87 billion in 2025, equal to 67.58% share, and is tracking a 10.18% CAGR through 2031. Fifth-generation networks allow full-HD playback without buffering, and 57% of consumers state that 5G availability boosts their willingness to stream ads on smartphones big3media. Connected-TV follows as the prime incremental channel since large-screen environments boast 97% ad-completion rates.
Advertisers now weave sequential storytelling across phone, CTV and digital-out-of-home touchpoints, with auto dealers observing uplift when CTV awareness flights are retargeted on mobile within 48 hours. Programmatic advertisement buying hubs are bundling identity graphs so impressions delivered on any screen are frequency-capped at the household level. Laptop and desktop inventory declines annually yet remains vital for B2B demand-generation campaigns and long-form demos that perform better on larger monitors.


By Ad Format: Interactive Content Transforms Engagement
In-stream spots retained 43.92% revenue share in 2025 because viewers are primed to watch during mid-roll breaks in professionally produced content. Shoppable and interactive formats, however, are scaling at a 13.44% CAGR as brands exploit overlays, QR codes and instant-checkout widgets to shorten the purchase funnel. Videos under 90 seconds sustain 50% viewer retention, essential for social-feed environments where audiences swipe within seconds.
Out-stream placements integrated into news feeds trade at lower CPMs but contribute incremental unduplicated reach. Live-stream commerce campaigns are emerging as premium units: Paramount+ inserted real-time polls and product carousels during its Super Bowl broadcast, lifting engagement by 73 seconds on average compared with standard pre-roll. Rich-media signals enhance measurement because viewer taps, swipes and cart adds create deterministic intent data that feeds performance-based bidding loops.
By End-User Industry: Retail Leads Digital Commerce Integration
Retail and e-commerce brands captured 20.12% of video advertising market share in 2025 and are expanding at a 13.17% CAGR through 2031. Consumer-packaged-goods (CPG) advertisers remain the largest absolute spenders, earmarking USD 14.3 billion for video in 2025 as they transition sampling budgets into high-reach digital storytelling. Media and entertainment companies double down on promo trailers to drive subscription sign-ups for ad-light tiers, while telecom carriers use explainer videos to convey complex 5G bundles.
Healthcare spend topped USD 19.66 billion in 2024, with pharmaceutical campaigns using HIPAA-compliant geo-fencing to reach physician audiences. Financial services adopt humanised short-form stories; Bank of China’s vertical-video series drew over 200 million views and elevated brand favorability in Gen-Z cohorts. Automotive marketers align CTV with dealer CRM data to target households nearing purchase windows, supporting longer consideration cycles.
By Pricing Model: Performance-Based Models Gain Momentum
CPM still dominates buying, with a 61.35% share in 2025, because planners need predictable reach guarantees. Yet cost-per-action pricing posts the fastest 10.41% CAGR as retail media networks plug closed-loop attribution directly into ecommerce checkouts.
Cost-per-view provides a middle-ground validation for brand-awareness campaigns that require completed views. Cost-per-click retains a niche among direct-response advertisers, despite higher CPCs, while hybrid programmatic-guaranteed deals reserve premium slots on CTV apps at fixed CPMs, allowing buyers to layer first-party data without auction volatility. As machine-learning attribution improves, auction engines dynamically shift bids across CPA, CPC, and CPM floors to maximise return.
Geography Analysis
North America accounted for 36.12% of 2025 revenue, underpinned by mature streaming ecosystems and ad-tech infrastructure. Growth is moderating as inventory supply reaches a plateau; however, higher CPMs and premium formats sustain dollar expansion. US-based retail media networks, such as Amazon, Walmart, and Kroger, are funneling first-party shopping data into programmatic pipes, thereby tightening the loop between exposure and sale while insulating the video advertising market from cookie deprecation.
Asia-Pacific is the clear growth engine, advancing at a 7.42% CAGR through 2031. China commands more than 50% of Asia-Pacific spend, fuelled by Alibaba’s and Tencent’s commerce-plus-content ecosystems. India is the fastest climber: national digital video revenue is on track to surpass broadcast TV by 2027 as smartphone penetration surpasses 80%. Southeast Asian markets benefit from cross-border ecommerce and cheap mobile data, spawning new inventory inside super-apps.
Europe is contending with strict GDPR and Digital Services Act rules that limit behavioral targeting, which pushes spend toward contextual and publisher-first-party solutions. Latin America shows accelerating potential; Mercado Libre’s ad unit enjoys 70-80% EBIT margins, and total regional digital ad revenue could triple by 2028. The Middle East and Africa remain nascent but attractive on a long-horizon basis, as governments fund 5G rollouts and local content studios scale, opening up fresh supply for global brands.

Competitive Landscape
The video advertising industry features moderately concentrated control among universal platforms while leaving space for specialized challengers. Google, Meta, and Amazon unite data, content, and commerce to capture a significant share of programmatic spending. Netflix, Disney+, and Peacock diversified into advertising, injecting premium CTV inventory that competes directly with linear TV budgets. Roku and Samsung aggregate smart-TV home screens, turning device operating systems into high-margin ad storefronts.
Independent ad-tech firms pursue privacy-first differentiation; The Trade Desk, PubMatic, and Magnite build transparent auction frameworks that appeal to brand-safety-conscious buyers. The 2024 merger of Equative and Share through produced an independent supply-side platform with USD 200 million in recurring revenue and more than 720 staff focused on cookieless IDs.[3]Equativ, “Equativ and Sharethrough complete merger,” equativ.com White-space solutions concentrate on cross-device attribution, carbon-aware bidding, and healthcare-compliant DSPs niches where big tech lacks specialist expertise.
Strategic moves center on vertical integration and ownership of identity. Amazon struck a partnership with InfoSum for clean-room collaboration, allowing CPG advertisers to blend retail purchase data with media exposure without exposing raw customer records. YouTube’s 20-year milestone signals a shift toward full-stack commerce, livestream events, and generative-AI editing that reduce production barriers for small businesses. Acquirers target content personalization engines and measurement start-ups to strengthen value-chain control before third-party identifiers are phased out.
Video Advertising Industry Leaders
Meta Platforms, Inc.
Google LLC
Amazon.com, Inc.
Roku, Inc.
ByteDance Ltd.
- *Disclaimer: Major Players sorted in no particular order

Recent Industry Developments
- June 2025: Equativ and Sharethrough closed their merger, forming one of the largest independent ad marketplaces.
- May 2025: Amazon partnered with InfoSum and Magnite to expand programmatic collaboration capabilities.
- April 2025: YouTube marked its 20th anniversary and is projected to overtake Disney in revenue by year-end.
- January 2025: Amazon has enhanced its generative AI video suite, rolling out advanced editing tools to all US advertisers.


Research Methodology Framework and Report Scope
Market Definitions and Key Coverage
Mordor Intelligence defines the video advertising market as all fee-based placements of linear or on-demand video creative that are delivered through internet-connected devices, including mobile apps, browsers, connected-TV/OTT environments, and DOOH screens, and for which revenue accrues to publishers or intermediaries on CPM, CPV, CPC, CPA, or hybrid models. Our calculus excludes in-house brand production costs, influencer barter deals, and unpaid social shares.
(Scope exclusion: formats such as cinema pre-roll, in-game rewarded clips confined to console titles, and peer-to-peer livestream tipping are outside this study.)
Segmentation Overview
- By Device
- Mobile
- Desktop and Laptop
- Connected TV / OTT
- Digital-Out-of-Home (DOOH) Screens
- By Ad Format
- In-stream
- Out-stream / In-feed
- Short-form Vertical / Stories / Reels
- Shoppable and Interactive Video
- Rich-media Live-stream
- By End-User Industry
- Retail and E-commerce
- Media and Entertainment
- IT and Telecom
- Automotive
- Financial Services
- Consumer Goods and Electronics
- Healthcare and Pharma
- Other Industries
- By Pricing Model
- Cost per Mille (CPM)
- Cost per View (CPV)
- Cost per Click (CPC)
- Cost per Action (CPA)
- Hybrid / Programmatic Guaranteed
- By Geography
- North America
- United States
- Canada
- Mexico
- South America
- Brazil
- Argentina
- Chile
- Peru
- Rest of South America
- Europe
- Germany
- United Kingdom
- France
- Italy
- Spain
- Rest of Europe
- Asia-Pacific
- China
- Japan
- South Korea
- India
- Australia
- New Zealand
- Rest of Asia-Pacific
- Middle East and Africa
- Middle East
- United Arab Emirates
- Saudi Arabia
- Turkey
- Rest of Middle East
- Africa
- South Africa
- Nigeria
- Egypt
- Rest of Africa
- Middle East
- North America
Detailed Research Methodology and Data Validation
Primary Research
To refine assumptions, we conduct structured interviews with ad-tech platform product leads, agency trading-desk strategists, and brand-side media buyers across North America, Europe, Asia-Pacific, and the Middle East. Follow-up surveys validate average campaign duration, view-through benchmarks, and emerging CTV supply constraints, letting us reconcile desk signals with ground realities.
Desk Research
Our analysts first compile supply-side revenue indicators from open sources such as IAB Tech Lab ad-spend dashboards, eMarketer ad-load studies, US FCC quarterly CTV filings, Eurostat household broadband data, and WARC creative effectiveness meta-reviews. Company 10-Ks, investor decks, and ad-server log disclosures augment publisher-level splits. Where publisher splits are limited, paid databases, including D&B Hoovers for financials and Dow Jones Factiva for volume-weighted CPM news, bridge coverage gaps. This secondary sweep sets the outer bounds for spend by format, device, and region. The sources listed illustrate input breadth; many additional outlets inform model fine-tuning.
Market-Sizing & Forecasting
A top-down spend-reconstruction model begins with total digital ad outlays from national statistics, which are then filtered by video share inferred from publisher disclosures and IAB splits before device-level allocation via penetration-rate demand pools. Parallel bottom-up checks, sampled SSP billings x realized CPM, and selective channel checks cross-verify totals. Key market fingerprints driving the forecast include: 5G smartphone penetration, CTV household adoption, average programmatic CPM inflation, ad-blocker prevalence, and regulatory privacy shifts. A multivariate regression with lagged broadband speed and household SVOD count as predictors produces the 2025-2030 CAGR, while scenario analysis captures shifts in cookie-less targeting. Gaps in granular DOOH data are bridged using shipment proxies and occupancy sensors provided by signage vendors.
Data Validation & Update Cycle
Outputs pass three-layer variance checks, peer review, and anomaly flags triggered when any input diverges +/-7%. Reports refresh annually; material events such as privacy framework roll-outs trigger interim revisions, ensuring clients always receive an up-to-date view.
Why Mordor's Video Advertising Baseline Commands Reliability
Published estimates often diverge because firms anchor on dissimilar spend buckets, forecasting windows, and update cadences. One frequently cited figure places 2024 digital video outlays at around USD 221.25 billion, nearly triple our 2025 baseline. Another publication quotes USD 179.63 billion for 2024 yet folds social-commerce live streams into its tally.
Key gap drivers include: inclusion of self-promoted influencer content, aggressive extrapolation from panel spend, currency conversions fixed at survey date rather than rolling averages, and refresh cycles exceeding two years; factors our model avoids through annual recuts and dual-sourced CPM audits.
Benchmark comparison
| Market Size | Anonymized source | Primary gap driver |
|---|---|---|
| USD 82.68 B (2025) | Mordor Intelligence | - |
| USD 221.25 B (2024) | Global Consultancy A | Broad digital video scope, limited device-level normalization |
| USD 179.63 B (2024) | Industry Association B | Survey intent data; lacks billing reconciliation & currency smoothing |
In short, Mordor's disciplined scope selection, dual-path modeling, and yearly refresh give decision-makers a balanced, transparent baseline that traces directly to verifiable variables, offering confidence when allocating media budgets or sizing platform opportunities.


Key Questions Answered in the Report
What is the current size of the video advertising market?
The video advertising market size stands at USD 90.88 billion in 2026.
How fast is the video advertising market expected to grow?
The market is forecast to expand at a 9.92% CAGR, reaching USD 145.97 billion by 2031.
Which device segment leads spending?
Mobile devices hold 67.58% share and continue to grow thanks to 5G-enabled HD streaming.
Why is Asia-Pacific considered the growth engine?
APAC benefits from rapid 5G rollouts, expanding ecommerce and rising internet penetration, producing a 7.42% regional CAGR.
Which pricing model is gaining the most traction?
Cost-per-action is the fastest-growing model at 10.41% CAGR as brands focus on measurable outcomes.
How are privacy regulations affecting video advertising?
Stricter laws push advertisers toward contextual targeting and first-party data strategies, reducing reliance on third-party cookies.
Page last updated on:


