
Audience Analytics Market Size and Share
Market Overview
| Study Period | 2020 - 2031 |
|---|---|
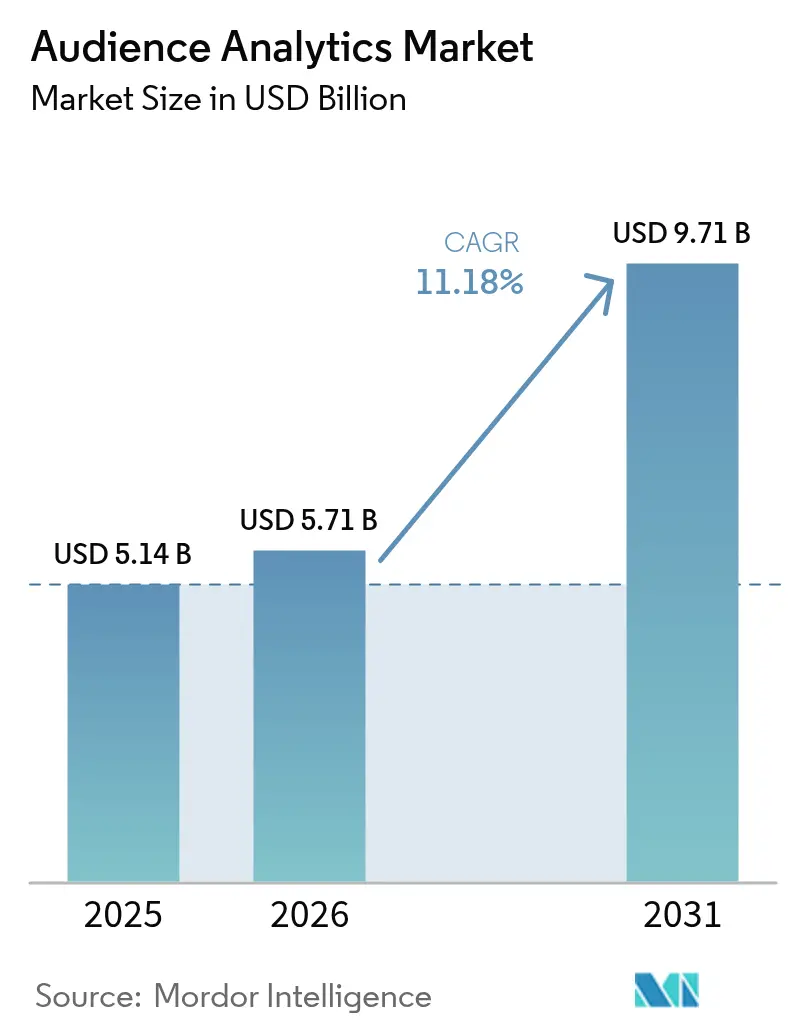
| Market Size (2026) | USD 5.71 Billion |
| Market Size (2031) | USD 9.71 Billion |
| Growth Rate (2026 - 2031) | 11.18 % |
| Fastest Growing Market | Asia Pacific |
| Largest Market | North America |
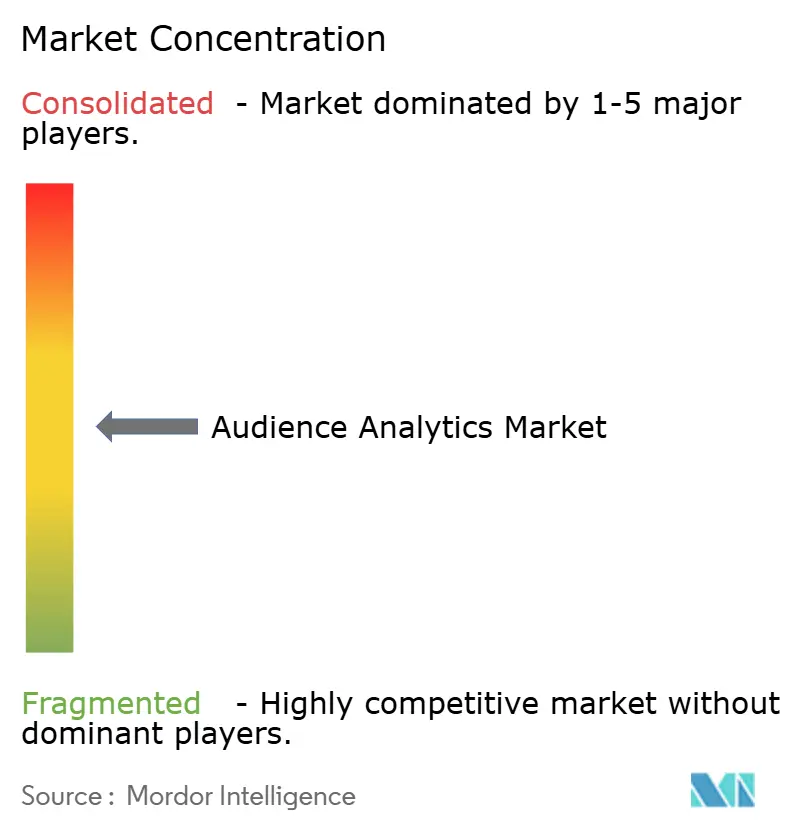
| Market Concentration | Medium |
Major Players *Disclaimer: Major Players sorted in no particular order Image © Mordor Intelligence. Reuse requires attribution under CC BY 4.0. | |
Audience Analytics Market Analysis by Mordor Intelligence
The audience analytics market size was valued at USD 5.14 billion in 2025 and estimated to grow from USD 5.71 billion in 2026 to reach USD 9.71 billion by 2031, at a CAGR of 11.18% during the forecast period (2026-2031). Heightened demand for consent-based identity resolution, powerful AI toolkits, and the rapid monetisation of first-party data in retail media networks underpin this expansion. Organisations increasingly deploy real-time, edge-based analytics that protect privacy while generating actionable insights at the point of engagement. Solutions remain the largest revenue contributor, yet cloud-native services record the quickest growth as firms seek scalability and cost optimisation. Meanwhile, large enterprises dominate spending, but small and medium enterprises accelerate adoption thanks to no-code interfaces and consumption-based pricing models that lower entry barriers to sophisticated analytics.
Key Report Takeaways
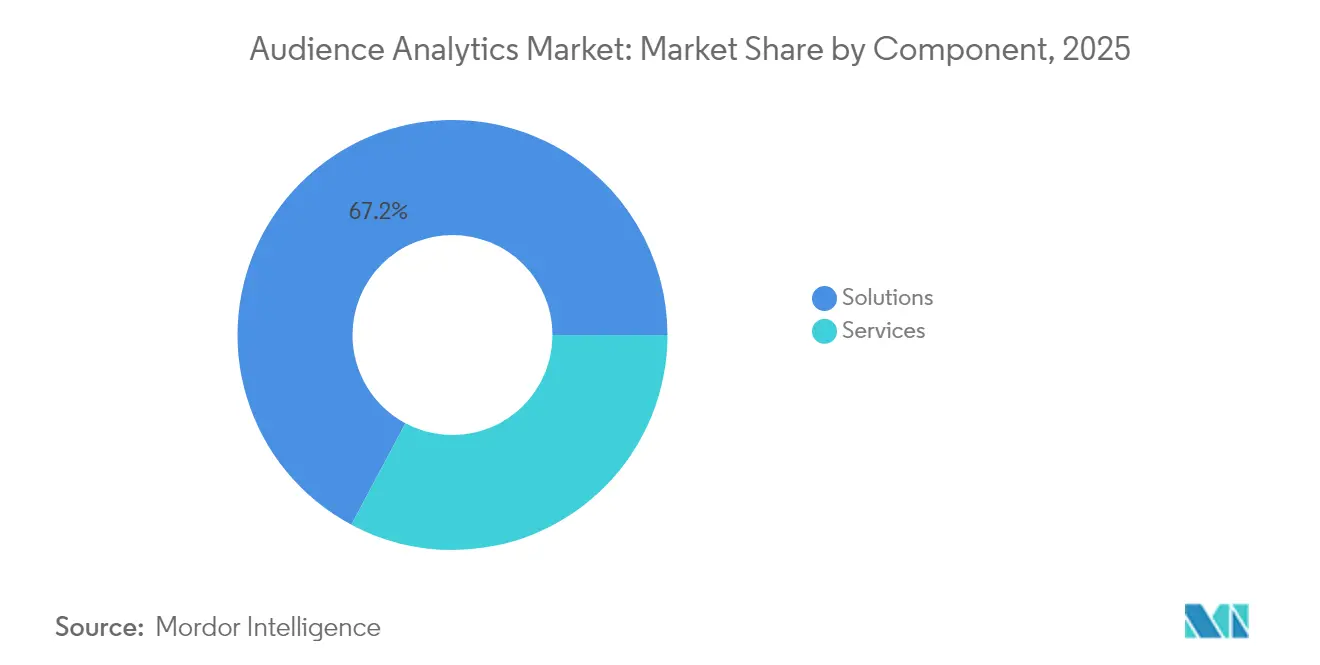
- By component, solutions retained 67.20% revenue share in 2025, while services are projected to grow at a 12.45% CAGR through 2031.
- By deployment mode, on-premises installations held 65.10% of the audience analytics market share in 2025; cloud deployments are forecast to expand at a 12.84% CAGR to 2031.
- By organisation size, large enterprises accounted for 70.50% of the audience analytics market size in 2025; SMEs record the highest projected CAGR at 12.32% to 2031.
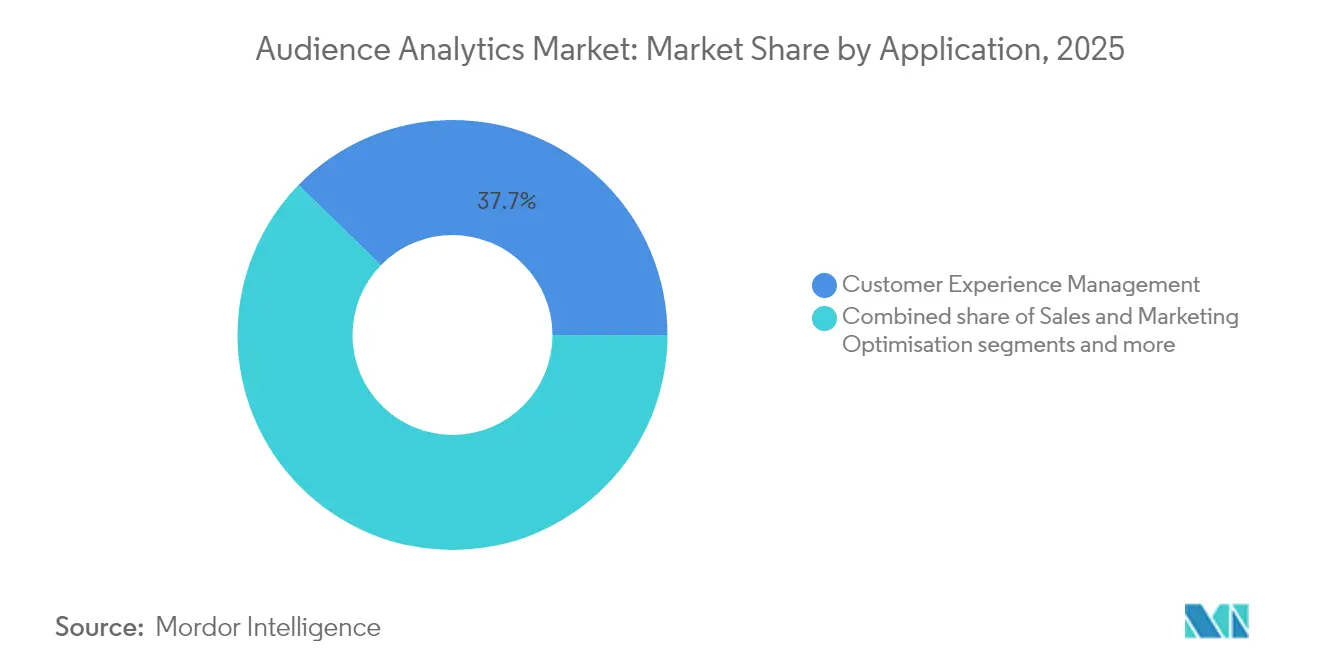
- By application, customer experience management led with 37.70% of the audience analytics market share in 2025, while fraud and risk analytics is advancing at an 11.62% CAGR to 2031.
- By end-user industry, media and entertainment contributed 35.60% of 2025 revenue; retail and e-commerce is forecast to grow at an 11.38% CAGR through 2031.
- By geography, North America commanded 39.90% of 2025 revenue; Asia-Pacific is progressing at a 11.96% CAGR to 2031.
Note: Market size and forecast figures in this report are generated using Mordor Intelligence’s proprietary estimation framework, updated with the latest available data and insights as of 2026.
Global Audience Analytics Market Trends and Insights
Drivers Impact Analysis*
| Driver | (~) % Impact on CAGR Forecast | Geographic Relevance | Impact Timeline |
|---|---|---|---|
| Rapid growth in omnichannel first-party data collection | +2.1% | Global, with North America and Europe leading adoption | Medium term (2-4 years) |
| Surging adoption of AI/ML-powered predictive analytics | +1.8% | Global, with Asia-Pacific showing fastest implementation | Short term (≤ 2 years) |
| Media and entertainment shift to real-time audience monetisation | +1.4% | North America and Europe core, expanding to APAC | Medium term (2-4 years) |
| Cookieless marketing pushes demand for consent-based identity graphs | +1.6% | Global, with GDPR and CPRA regions driving urgency | Short term (≤ 2 years) |
| Retail media networks scaling first-party shopper insights | +1.3% | North America leading, with Europe and APAC following | Medium term (2-4 years) |
| Edge analytics on devices enabling privacy-preserving insights | +1.2% | Global, with mobile-first markets in APAC accelerating | Long term (≥ 4 years) |
| Source: Mordor Intelligence | |||
Rapid Growth in Omnichannel First-Party Data Collection
Brands are rebuilding data architectures around owned interaction points, integrating in-store behaviour, mobile engagement, and connected-device signals. Retailers now operate sophisticated media networks that align physical and digital journeys, opening USD-level revenue channels once dominated by third-party data brokers. The ability to merge offline and online insights improves lifetime value modelling and elevates segmentation precision.
Surging Adoption of AI/ML-Powered Predictive Analytics
Machine-learning algorithms now underpin behavioural modelling, conversion prediction, and automated cohort creation across mainstream platforms. Google Analytics 4 and Adobe Experience Cloud showcase AI engines that slash insight latency from weeks to minutes while improving forecast accuracy by more than 30%[1]Adobe, “Introducing GenStudio Content Analytics,” business.adobe.com. Cloud delivery makes these functions accessible to mid-market firms previously constrained by infrastructure costs and talent shortages.
Media and Entertainment Shift to Real-Time Audience Monetisation
Streaming services and broadcasters combine panel and big-data streams to optimise content placement and dynamically price ads. Nielsen’s Big Data + Panel system fuses linear and streaming consumption metrics, enabling monetisation tactics that adapt instantly to engagement patterns. Audience feedback now informs production choices, merchandising, and interactive experiences across traditional and emerging channels.
Cookieless Marketing Pushes Demand for Consent-Based Identity Graphs
Marketers respond to cookie deprecation by investing in hashed-email IDs, contextual analysis, and location signals that respect privacy. Nielsen reports that three-quarters of marketers still depend on cookies, fuelling rapid migration to alternative identifiers and robust consent mechanisms. Vendors able to marry privacy compliance with insight depth gain competitive advantage.
Restraints Impact Analysis*
| Restraint | (~) % Impact on CAGR Forecast | Geographic Relevance | Impact Timeline |
|---|---|---|---|
| Increasing privacy-first regulation (GDPR, CPRA, DMA) | -1.4% | Europe and California leading, expanding globally | Short term (≤ 2 years) |
| Data-engineering skill shortages among SME users | -1.1% | Global, with North America and Europe most affected | Medium term (2-4 years) |
| Rising cloud-compute costs for petabyte-scale analytics workloads | -0.8% | Global, with cloud-heavy regions experiencing higher impact | Medium term (2-4 years) |
| Fragmentation of identity solutions hinders interoperability | -0.9% | Global, with mature digital advertising markets most affected | Long term (≥ 4 years) |
| Source: Mordor Intelligence | |||
Increasing Privacy-First Regulation
GDPR, CPRA, and the Digital Markets Act compel firms to re-engineer data flows, often diverting 15-20% of analytics budgets to compliance efforts. Privacy-preserving solutions, such as cookieless web analytics, reduce dependence on personal identifiers while sustaining behavioural insight quality. Vendors tout contextual targeting and edge processing to balance regulatory demands with commercial goals.
Data-Engineering Skill Shortages Among SME Users
A persistent talent gap hampers smaller enterprises that wish to operationalise advanced analytics pipelines. Industry surveys show businesses struggling to hire professionals who can deploy machine-learning models and manage privacy-centric data architecture. As a result, demand grows for managed services, no-code platforms, and packaged analytics that minimise technical overhead.
*Our forecasts treat driver/restraint impacts as directional, not additive. The impact forecasts reflect baseline growth, mix effects, and variable interactions.
Segment Analysis
By Component: Solutions Maintain Scale While Services Accelerate
Solutions generated 67.20% of 2025 revenue and remain the backbone of the audience analytics market. They comprise data-integration hubs, customer data platforms, and AI inference engines that enable cross-channel insight generation. Organisations invest heavily at the outset in scalable infrastructures, creating high switching costs and entrenched vendor relationships. Services, however, achieve a 12.45% CAGR as firms outsource expertise in identity resolution, model governance, and compliance auditing. Managed offerings deliver continuous optimisation and bridge the data-engineering talent gap, elevating overall project success rates.
The rise of analytics-as-a-service signals a strategic shift from perpetual licences to consumption-based engagements. Consultancies and system integrators package technology stacks with advisory support, ensuring business objectives drive implementation choices. As privacy regulation tightens, specialised services in consent management and edge deployment command premium pricing, accelerating the revenue mix transition toward recurring professional support.



By Deployment Mode: Cloud Gains Momentum Despite On-Premises Leadership
On-premises systems held 65.10% of the audience analytics market share in 2025, reflecting enduring concerns over data sovereignty and latency for high-volume streaming analyses. Sectors such as banking and government rely on self-hosted platforms to retain sensitive personally identifiable information. Nevertheless, cloud instances grow at a 12.84% CAGR as vendors implement region-specific encryption, sovereign-cloud options, and advanced compliance certifications. Adobe’s joint offering with AWS exemplifies tailored cloud solutions for real-time customer profiling.
Hybrid architectures surface as the prevailing model, retaining golden customer profiles on-premises while bursting compute-intensive workloads to the cloud. This arrangement curbs infrastructure capital expenditure and unlocks elastic processing for seasonal campaigns and sudden surges in data ingestion. The audience analytics market size represented by cloud deployments is forecast to overtake on-premises revenue in the post-2030 horizon as confidence in public-cloud security matures.
By Organisation Size: Democratised Analytics Fuels SME Uptake
Large enterprises spent the most in 2024, but SMEs register the highest growth rate at 12.32%. Cloud-native platforms and flexible subscription tiers remove historical capital barriers, enabling smaller brands to adopt product-analytics suites and basic AI forecasting. Vendors such as Amplitude embed step-by-step wizards and templated dashboards that condense deployment cycles into days, not months.
SME adoption is also driven by the imperative to personalise digital storefronts amid intensifying competition. Pay-as-you-go pricing aligns analytics investment with revenue, encouraging iterative experimentation instead of multi-year, fixed-fee contracts. Meanwhile, large enterprises continue to dominate the audience analytics market size for complex omnichannel orchestration initiatives that demand extensive data-cleansing and integration effort.
By Application: Customer Experience Leads; Fraud Analytics Surges
Customer experience management tools controlled 37.70% of 2025 revenue as every sector aligns growth objectives with end-to-end journey insight. Real-time personalisation engines amplify conversion rates and upsell potential, embedding analytics directly into engagement workflows. Fraud and risk analytics, advancing at 11.62% CAGR, responds to deepfake-enabled scams and synthetic-identity attacks that bypass rule-based detection. Behavioural biometrics and anomaly-detection models analyse velocity, device, and usage patterns to identify malicious activity without user friction.
Sales and marketing optimisation remains a mature yet evolving use case, integrating next-best-action logic powered by predictive intent signals. Competitive intelligence platforms sift public data and media consumption to benchmark brand performance. Finally, product and content development teams use engagement heatmaps and cohort analyses to guide feature roadmaps and storyline investment, tightening feedback loops between audience preference and creation.
By End-User Industry: Media and Entertainment Leads as Retail Accelerates
Media and entertainment organisations contributed 35.60% of 2025 revenue, leveraging cross-platform measurement to justify rising content budgets. Streaming providers refine release schedules and ad inventory pricing with real-time viewing analytics, while video-game studios track in-game behaviour to balance difficulty and monetisation elements. Retail and e-commerce, growing at an 11.38% CAGR, capitalise on first-party shopper data harvested from loyalty apps, click-and-collect services, and connected point-of-sale sensors.
Telecom carriers combine geospatial analytics and churn-propensity scoring to prioritise retention outreach. BFSI institutions monitor transaction fingerprints for fraud and personalise credit offers using audience analytics market insights. Healthcare entities apply privacy-preserving analytics to improve patient adherence and outreach, albeit under strict regulatory oversight. Government agencies employ usability analytics to streamline digital services and enhance citizen engagement.
Geography Analysis
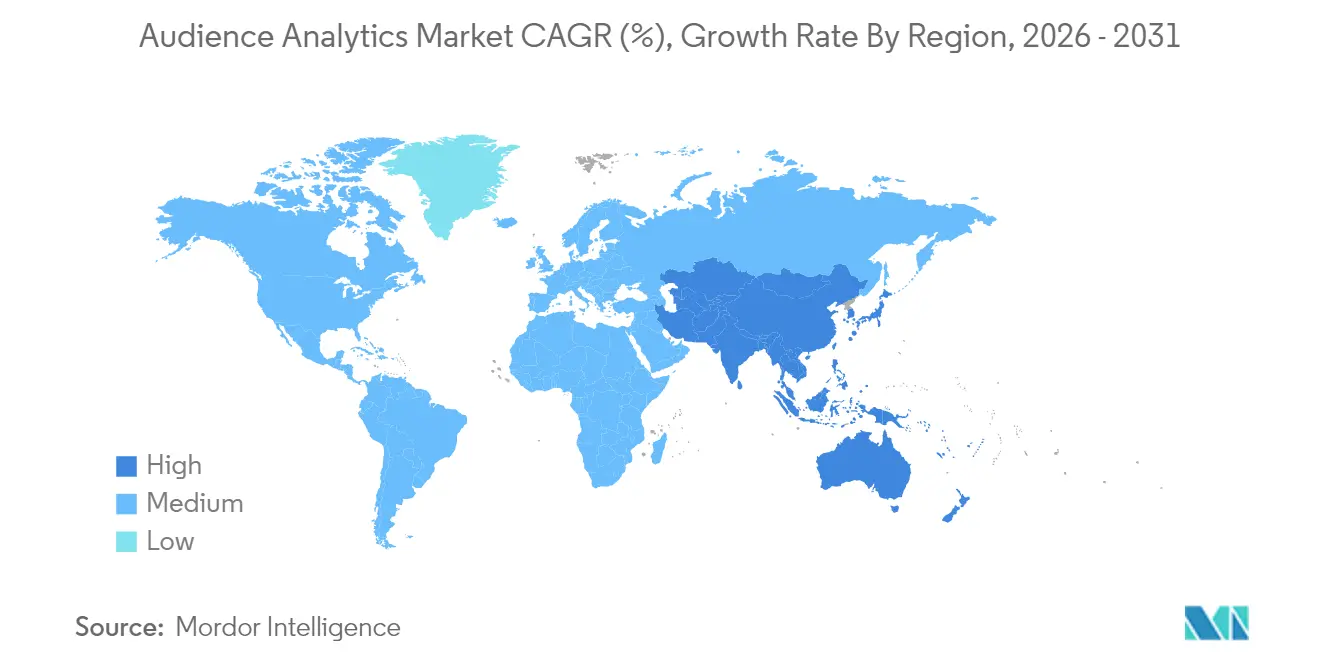
North America held 39.90% revenue in 2025, anchored by a sophisticated advertising ecosystem, heavy technology investment, and early adoption of privacy-first tools. United States retailers such as Walmart and Target lead in retail media revenue generation, while Canada benefits from progressive privacy laws that nudge firms toward compliant analytics architectures. Mexico’s accelerating e-commerce adoption widens the regional user base for scalable, cloud-delivered insight engines.
Europe sits in a steady growth phase shaped by GDPR and the Digital Markets Act, which elevate demand for consent-based solutions that minimise personal data dependence. Germany and the United Kingdom endorse edge-processing pilots that keep data resident, reducing cross-border transfer complexity. France and Italy explore contextual targeting to maintain advertising efficiency. Independent vendors that can interoperate across multiple identity frameworks attract mid-market adopters seeking flexible compliance.
Asia-Pacific is the fastest-growing region at a 11.96% CAGR, supported by a USD 880 billion mobile economy and 1.8 billion mobile subscribers. China pioneers social commerce analytics that blend video, messaging, and payments, creating granular, real-time insight streams. India’s fintech boom expands transactional datasets, while Japan and South Korea integrate audience analytics into gaming ecosystems to optimise retention. Australia and New Zealand embrace enterprise analytics to support omnichannel retail and public-service modernisation. Rising smartphone penetration and government digital initiatives propel additional demand across Southeast Asia, reinforcing long-term momentum for the audience analytics market.

Regulatory Landscape
Audience analytics vendors operate under expanding privacy and data-governance regimes that shape consent capture, identity resolution, and cross-channel measurement. In California, updated CCPA regulations took effect on January 1, 2026 under the California Privacy Protection Agency (CPPA), reinforcing transparency and consumer-control expectations for data sharing with third parties and service providers involved in analytics workflows. In Europe, GDPR enforcement continues alongside adjacent frameworks that influence how platforms, publishers, and advertisers handle audience data, including the Digital Markets Act (DMA) and evolving cybersecurity obligations affecting analytics stacks processing personal and pseudonymous identifiers.
Regulatory bodies are also tightening expectations around online tracking and emerging AI governance that underpins predictive audience modeling. The UK Information Commissioner's Office (ICO) has continued to publish guidance on storage and access technologies and has scheduled advice to government on potential PECR changes for online advertising in 2026, keeping cookie alternatives and consent tooling under scrutiny. At the EU level, the EDPB and EDPS issued Joint Opinion 2/2026 on the Digital Omnibus proposal, signaling ongoing efforts to streamline compliance across GDPR, NIS2, and related digital rules, while the EU AI Act adds further controls for AI-driven systems used in analytics and decisioning.
Value Chain Analysis
The audience analytics value chain begins with data generation and collection across owned and partner touchpoints, including websites and apps, connected TV and streaming platforms, retail and loyalty ecosystems, and offline interactions that are later digitized. Data is ingested through SDKs, tags, server-side collection, and identity or consent layers, then unified and governed within customer data platforms, data warehouses, and clean rooms. Analytics and activation layers convert these inputs into segments, propensity models, and measurement outputs that feed ad platforms, marketing automation, experience orchestration suites, and enterprise reporting.
Downstream, integrators and measurement intermediaries are increasingly central as buyers push for interoperable, privacy-preserving workflows across walled gardens and traditional media. Clean room infrastructure and partner marketplaces have become a common mechanism to match first-party audience signals without exposing raw identifiers, as seen in the use of Permutive infrastructure to link publisher behavioral data with retailer segments. Measurement providers are also moving upstream into ecosystem integration, for example Nielsen's Outcomes Marketplace and its June 2026 integration work with Mediaocean for advanced audience measurement in linear TV, which connect planning, buying, and reporting systems and reduce fragmentation across vendors.
Competitive Landscape
The competitive field is moderately fragmented. Technology conglomerates such as Adobe, Google, and Microsoft offer integrated stacks that embed data collection, identity resolution, and AI orchestration within broader cloud suites. Specialist providers—including Nielsen, Amplitude, and Mixpanel—focus on media measurement, product analytics, and experimentation workflows, respectively, capturing share through domain depth and product-led uptake.
Strategic activity centres on three themes. First, AI-native capabilities accelerate insight generation; Adobe’s autonomous agents orchestrate experiences across channels without manual segmentation. Second, cross-platform measurement alliances, such as the Nielsen-LiveRamp collaboration, extend reach from linear TV to connected devices, providing unified attribution. Third, privacy-preserving innovation drives differentiation, with edge analytics firms promising compliance and cost savings by processing data on device.
Convergence and partnership remain common as vendors fill capability gaps. Cloud providers embed analytics functions directly into data-warehouse offerings, while systems integrators package vertical solutions for healthcare, retail, and public sector. Emerging challengers target ease of use, launching low-code orchestration and transparent pricing models that appeal to resource-constrained teams. The result is an ecosystem where no single player commands outsized dominance, yet brand scale and continuous innovation dictate competitive positioning.
Audience Analytics Industry Leaders
Oracle Corporation
Adobe Inc.
IBM Corporation
Google LLC
JCDecaux Group
- *Disclaimer: Major Players sorted in no particular order

Market Opportunities and Future Outlook
A key whitespace is cross-media measurement that unifies linear TV, CTV, and digital outcomes while remaining compatible with consent-based identity and clean room constraints. June 2026 activity illustrates this shift: Nielsen announced an integration with Mediaocean to support advanced audience segment reporting for data-driven linear national TV campaigns (timed for the fall 2026 TV season), and AudienceProject introduced the Elevate measurement environment to help broadcasters document reach, frequency, and incremental reach for their inventory. These moves create room for vendors that connect planning and currency workflows with privacy-preserving audience graphs and transparent validation across publishers, agencies, and advertisers.
Another opportunity is operationalizing predictive and attention-based analytics inside buying and content workflows. Acquisitions and product launches in 2026 show buyers funding capability consolidation, including Publicis Groupe acquiring AdgeAI (March 2026) to embed measurement and content intelligence into production, and Viant completing the acquisition of TVision Insights (May 2026) to bring second-by-second eyes-on-screen attention data into measurement for linear and CTV. Industry infrastructure initiatives also point to new product space for server-side audience signaling and analytics governance, as the IAB Tech Lab 2026 roadmap prioritizes the Trusted Server initiative to move ad stack operations to publisher server-side environments, supporting addressability and measurement under tighter tracking constraints.
Recent Industry Developments
- July 2026: Oracle introduced an AI-Native Builder experience for creating and running agentic applications within Oracle Fusion Applications. The release pushes agentic workflow automation deeper into enterprise application stacks, which increases demand for audience and customer analytics that can drive next-best actions across marketing, commerce, and service.
- March 2026: Publicis Groupe completed its acquisition of AdgeAI, an AI-powered measurement and content intelligence company. The deal reinforces agency-led consolidation of predictive measurement capabilities and supports the integration of performance analytics into content production and optimization workflows.
- December 2024: Adobe and Amazon Web Services extended their partnership to bring Adobe Experience Platform to AWS for unified data management and AI-driven insights. The move expanded deployment flexibility for enterprises running audience data platforms and analytics workloads in AWS environments while supporting tighter data-governance requirements.


Research Methodology Framework and Report Scope
Market Definition and Coverage
The audience analytics market covers software and related services that collect, connect, and interpret audience data so teams can understand who their audiences are, how they behave, and how they respond across digital and offline touchpoints.
Scope exclusions: stand-alone web traffic measurement tools, generic business intelligence dashboards, and non-consented data scraping are excluded from the market totals.
Segmentation Overview
- By Component
- Solutions
- Services
- By Deployment Mode
- On-premises
- Cloud
- By Organisation Size
- Large Enterprises
- Small and Medium Enterprises (SMEs)
- By Application
- Sales and Marketing Optimisation
- Customer Experience Management
- Competitive/Media Intelligence
- Product and Content Development
- Fraud and Risk Analytics
- By End-user Industry
- Media and Entertainment
- Retail and eCommerce
- BFSI
- Telecom and IT
- Healthcare and Life Sciences
- Government and Public Sector
- Others
- By Geography
- North America
- United States
- Canada
- Mexico
- Europe
- Germany
- United Kingdom
- France
- Italy
- Spain
- Russia
- Rest of Europe
- Asia-Pacific
- China
- Japan
- India
- South Korea
- Australia and New Zealand
- Rest of Asia-Pacific
- South America
- Brazil
- Argentina
- Rest of South America
- Middle East and Africa
- Middle East
- Saudi Arabia
- United Arab Emirates
- Turkey
- Rest of Middle East
- Africa
- South Africa
- Nigeria
- Rest of Africa
- Middle East
- North America
Data Sources, Market Sizing, and Validation
Desk Research
Desk work starts with public facts that explain how digital media, advertising, and privacy practices are changing, since these shifts influence demand for audience analytics. For connectivity baselines we reference the International Telecommunication Union, for digital usage indicators we use the US Census Bureau and Eurostat, and for digital economy and privacy context we rely on OECD publications.
To connect demand with adoption and budget signals, we also review sources such as US SEC filings, annual reports, and investor presentations from active suppliers and large buyers. We then cross-check with reputable press coverage and industry association updates that describe product direction. Patent databases are selectively checked to see where identity resolution, segmentation, and measurement capabilities are being developed. This source list is not exhaustive, and other references are used for data collection, validation, and clarifying remaining open questions.
Primary Interviews and Surveys
Primary discussions are used to confirm what is counted as audience analytics versus adjacent analytics tools, and then to test assumptions on pricing, renewals, and deployment scope. We speak with supplier-side leaders, implementation partners, and buyer-side analytics owners across APAC, EMEA, and the Americas, so adoption timing and feature mix are not inferred only from published materials.
Distribution of primary research fieldwork respondents
| Company type | Respondent position | Region |
|---|---|---|
| Top tier: 28% | CXOs: 20% | APAC: 42% |
| Mid tier: 52% | Functional/Unit leaders: 37% | EMEA: 33% |
| Smaller Players: 20% | Managers: 43% | Americas: 25% |
Market-Sizing & Forecasting
Market sizing is built using top-down demand reconstruction, where digital advertising activity, growth in measurable digital audiences, and privacy-led shifts toward first-party data are translated into an addressable spending pool for audience analytics tools and services. Selective bottom-up approximations are used as a cross-check, using sampled revenue disclosures, partner inputs, and simple volume times average selling price logic for common contract types.
Inputs used in the model include indicators such as direction in digital ad spend, connected device and internet user growth, enterprise cloud adoption for analytics workloads, the pace of cookie deprecation and consent enforcement, and the mix shift toward identity resolution and cross-channel measurement. When disclosures do not split audience analytics cleanly, gaps are handled using conservative allocation keys that are reviewed in interviews and checked against product packaging and typical deployment scope.
For forecasting, scenario analysis is used so the base case reflects what most practitioners expect for adoption and pricing, and then sensitivity is tested for stronger privacy restrictions or faster retail media and data collaboration uptake. Since short-term swings can happen, assumptions remain traceable to visible indicators and are adjusted only when multiple signals move in the same direction.
Data Validation & Update Cycle
Outputs are validated through consistency checks against independent signals such as digital ad market growth, shifts in measurement tooling, and reported analytics budgets, before the totals are approved. If unusual jumps appear by year or region, the drivers are rechecked, and targeted follow-ups are triggered to confirm whether the change is real or a modeling artifact.
A multi-step review is followed so definitions, unit economics, and growth logic are examined by another analyst before sign-off. Reports are refreshed annually, with interim updates for material events such as policy changes, major platform shifts, or demand shocks, and a fresh pre-release pass is completed so clients receive the latest updated view.
Mordor Intelligence's Audience Analytics Market Size Compared With Other Published Estimates
Published market sizes for audience analytics often do not match because the space can be stretched into nearby areas like general marketing analytics, ad measurement, or broad BI tooling. Differences also come from which year is treated as the base, how services are counted, and whether forecasts assume steady pricing or a faster shift to usage-based models.
Some external estimates appear to include wider analytics and measurement buckets with limited detail on what is excluded, which can lift or distort the totals. For Mordor Intelligence, stand-alone web analytics and generic BI are excluded unless they are sold as part of an audience analytics offering that supports identity resolution and advanced segmentation, and the outputs are cross-checked against demand signals and interview-confirmed packaging.
Benchmark comparison
| Source | Market Size | Gaps in Research Methodology |
|---|---|---|
| Mordor Intelligence | USD 5.71 B (2026) | |
| Global Research Publisher A | USD 5.00 B (2024) | Uses an earlier base year and provides limited clarity on what parts of measurement and marketing analytics are included, which can shift totals when later-year adoption and pricing are extrapolated. |
| Research Publisher B | USD 4.21 B (2024) | Starts from a lower 2024 base and does not clearly separate software-only definitions from bundled services tied to identity and cross-channel activation, which can compress the market when services are minimized. |
The spread across the three figures mainly comes from base-year choice and how strictly the definition is kept to audience profiling, segmentation, and identity-led measurement. With explicit inclusions, practical exclusions, and repeatable checks against adoption and spend indicators, our numbers are easier to reconcile year to year and simpler to defend in planning discussions.


Key Questions Answered in the Report
What is the current size of the audience analytics market?
The market is valued at USD 5.71 billion in 2026 and is forecast to reach USD 9.71 billion by 2031.
Which segment is growing fastest within the audience analytics market?
Cloud deployments exhibit the quickest expansion at a 12.84% CAGR as organisations shift workloads for scalability and cost efficiency.
Why are retail media networks important to audience analytics?
Retailers leverage first-party shopper data to create high-margin advertising channels, making audience analytics core to monetising these insights.
How do privacy regulations impact audience analytics adoption?
GDPR and CPRA drive investment in consent-based identity graphs and edge processing, adding compliance costs yet encouraging privacy-preserving innovation.
Which region offers the greatest growth potential?
Asia-Pacific leads with a projected 11.96% CAGR, propelled by a USD 880 billion mobile economy and expanding digital-first consumer base.
What role does AI play in modern audience analytics?
AI accelerates behavioural modelling and automated segmentation, reducing time-to-insight from weeks to minutes and improving predictive accuracy by 30% or more.
Page last updated on:


 Your data is secure and never sold or shared.


