LNG Vehicle Market Size and Share
Market Overview
| Study Period | 2019 - 2030 |
|---|---|
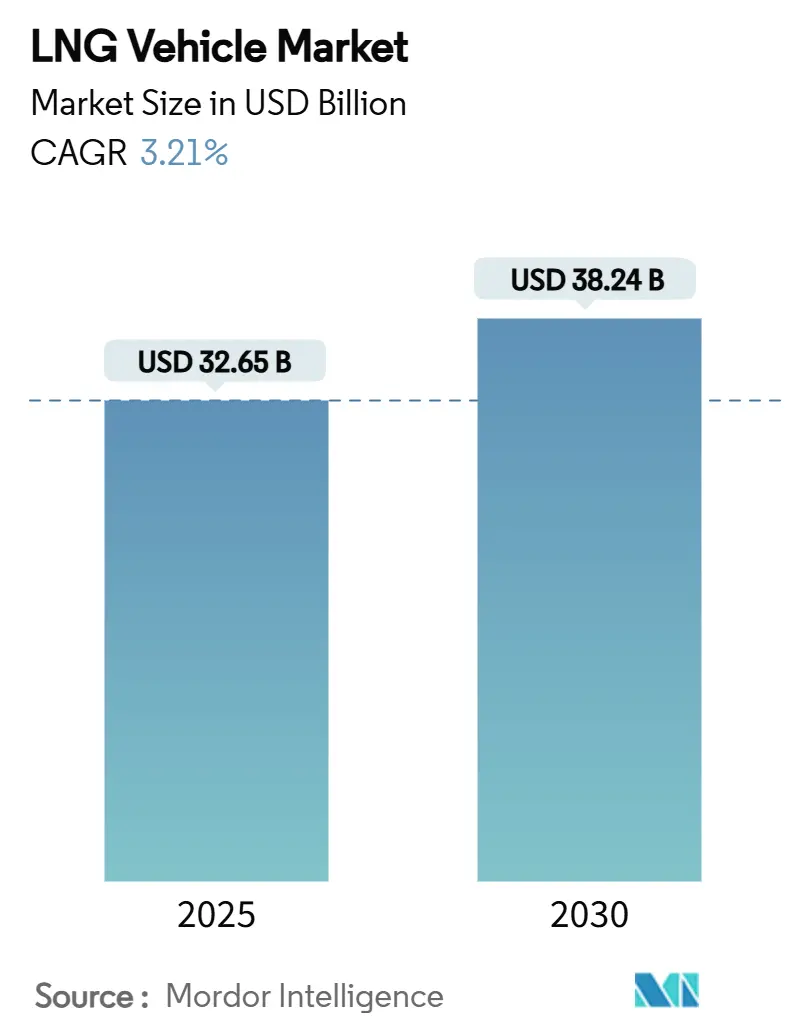
| Market Size (2025) | USD 32.65 Billion |
| Market Size (2030) | USD 38.24 Billion |
| Growth Rate (2025 - 2030) | 3.21% CAGR |
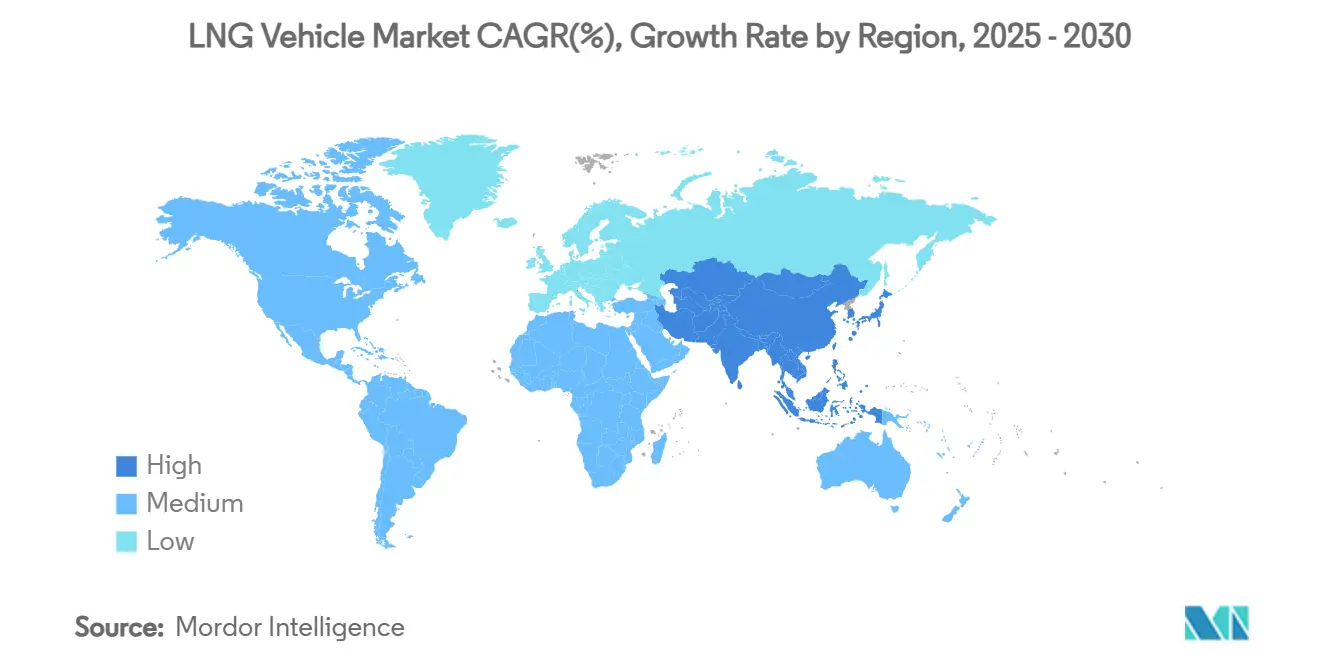
| Fastest Growing Market | Asia Pacific |
| Largest Market | Asia Pacific |
| Market Concentration | Medium |
Major Players *Disclaimer: Major Players sorted in no particular order Image © Mordor Intelligence. Reuse requires attribution under CC BY 4.0. | |
LNG Vehicle Market Analysis by Mordor Intelligence
The LNG Vehicle market reached a market size of USD 32.65 billion in 2025 and is forecast to reach USD 38.24 billion by 2030, advancing at a 3.21% CAGR. Current expansion stems from enforceable emissions mandates, active corridor build-outs, and measurable fleet economics rather than speculative demand. Long-haul freight operators continue to anchor volumes, yet growth momentum is shifting toward medium-duty and urban distribution use cases as range-extending cylinder technology matures. Supply-side competition centers on repurposed diesel platforms, while value migrates to fuel-system specialists and infrastructure owners who secure recurring revenue streams. Regional adoption remains uneven: Asia-Pacific accounts for nearly half of global deliveries, North America leverages abundant gas supply and incentives, and Europe balances bio-LNG pathways with stringent zero-emission targets.
Key Report Takeaways
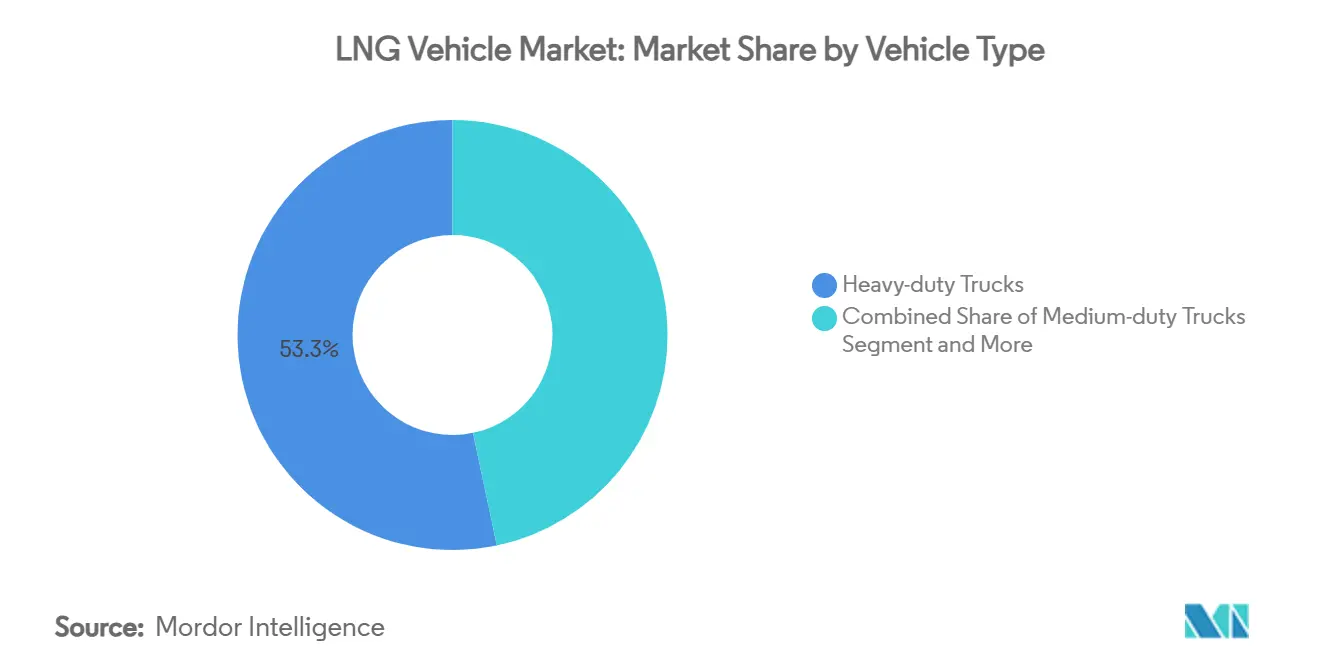
- By vehicle type, heavy-duty trucks led with 53.29% of LNG Vehicle market share in 2024. Medium-duty trucks recorded the quickest expansion at a 6.89% CAGR through 2030.
- By application, freight transport held a 49.47% share of the LNG Vehicle market size in 2024, while personal vehicles posted the fastest growth at 6.72% CAGR.
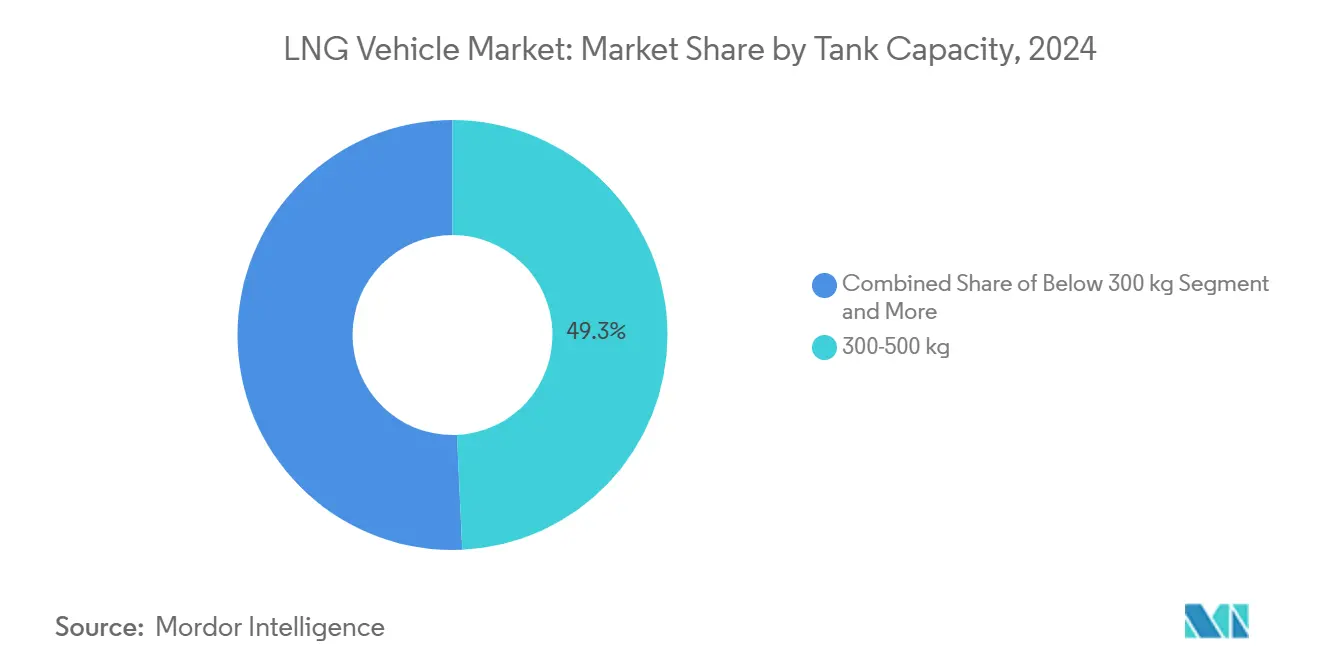
- By tank capacity, 300-500 kg systems commanded 49.27% of the LNG Vehicle market size in 2024; tanks above 500 kg are projected to grow at a 7.19% CAGR to 2030.
- By drive system, conventional engines accounted for 85.38% of 2024 revenue, whereas hybrid powertrains are advancing at a 7.29% CAGR.
- By geography, Asia-Pacific captured 48.49% of global revenue in 2024 and is set to climb at a 7.42% CAGR through 2030.
Global LNG Vehicle Market Trends and Insights
Drivers Impact Analysis*
| Driver | (~) % Impact on CAGR Forecast | Geographic Relevance | Impact Timeline |
|---|---|---|---|
| Global HDV CO₂/NOx Rules | +0.8% | Europe, North America, China | Medium term (2-4 years) |
| Expanding LNG Corridor Network | +0.6% | Europe, China, United States | Long term (≥ 4 years) |
| Diesel-to-LNG Fuel Cost Edge | +0.5% | Asia-Pacific core, spill-over global | Short term (≤ 2 years) |
| Incentives and Toll Relief | +0.4% | Europe, California, select Asia-Pacific regions | Medium term (2-4 years) |
| China 3,500 km Dual-Cylinder Tech | +0.3% | China dominant, expanding across Asia-Pacific | Long term (≥ 4 years) |
| Europe Bio-LNG Blend Mandates | +0.2% | Europe core, limited North America | Long term (≥ 4 years |
| Source: Mordor Intelligence | |||
Stringent HDV CO₂ and NOx Regulations Worldwide
Global emissions laws are reshaping truck purchasing. EPA Phase 3 rules in the United States begin with model-year 2027 vehicles and target steep greenhouse-gas cuts [1]“Greenhouse Gas Phase 3 Standards,” U.S. Environmental Protection Agency, epa.gov. Parallel EU targets seek a 43% reduction by 2030, while China’s GB VI standard triggered a jump in LNG truck sales during early 2024. Because LNG engines can reduce CO₂ versus diesel and meet tight NOx limits using mature after-treatment, fleets view them as a compliance pathway that remains technology-neutral and immediately viable.
Rapid Build-Out of LNG Fueling Corridors
Infrastructure is catching up to vehicle demand. Europe’s TEN-T-Core mandate requires adequate LNG refueling by 2025 and has spurred since 2022 [2]“TEN-T and Alternative Fuels Infrastructure,” European Commission, europa.eu. China’s dense corridor network supports the world’s largest LNG truck fleet, while the United States now has 1,600 natural-gas stations, including 60 dedicated LNG sites. Each station expands viable route options, creating a network effect that attracts additional fleet conversions.
Government Purchase Incentives and Toll Exemptions
Policy carrots add near-term economics. California couples purchase grants, fuel tax relief, and its Truck Replacement Program to lower adoption barriers. The updated Eurovignette directive will gradually penalize higher-emission trucks, favoring LNG in the medium term. Pairing monetary incentives with corridor development delivers compounding benefits that accelerate fleet decisions.
Dual-1,500 L Cylinder Tech Enabling 3,500 Km Range
CIMC Enric’s dual 1,500-liter design ships with booster pumps to reach 3,500 km on one fill, erasing range anxiety for cross-country hauls in China. ISO 11439-compliant tanks and improved cryogenic hold times cut boil-off losses. Long-haul fleets now view LNG trucks as diesel peers in uptime and productivity while retaining fuel and emissions gains.
Restraints Impact Analysis*
| Restraint | (~) % Impact on CAGR Forecast | Geographic Relevance | Impact Timeline |
|---|---|---|---|
| Faster BEV and FCEV Cost Drop | -0.6% | North America and Europe first, Asia-Pacific catching up | Medium term (2-4 years) |
| Gas Price Volatility vs Diesel | -0.4% | Global; acute in price-sensitive markets | Short term (≤ 2 years) |
| Methane-Slip Scrutiny | -0.3% | Europe focus, broadening worldwide | Long term (≥ 4 years) |
| Non-standard Tank Sizes | -0.2% | Global, especially cross-border fleets | Medium term (2-4 years) |
| Source: Mordor Intelligence | |||
Volatile Natural-Gas Pricing Vs. Diesel Parity
Excess global LNG export capacity of 193 MMt-per-year through 2028 creates price swings that complicate fleet planning[3] “Global LNG Outlook 2024-2028,” Institute for Energy Economics & Financial Analysis, ieefa.org. European imports fell 19% during 2024, pushing utilization below 42%, a setup that can spark spot-price spikes. Smaller fleets often lack the scale to lock fixed-price contracts, dulling the value proposition of switching.
Lack of Tank-Size Standardization Inflating Fleet TCO
Unlike CNG, LNG truck tanks lack a universally adopted ISO standard. Diverse dimensions inflate inventory, maintenance, and training costs for operators running mixed brands. Infrastructure owners must invest in multiple dispenser interfaces, delaying network efficiency gains. Without alignment, multi-regional fleets hesitate to scale LNG beyond pilot allocations.
*Our forecasts treat driver/restraint impacts as directional, not additive. The impact forecasts reflect baseline growth, mix effects, and variable interactions.
Segment Analysis
By Vehicle Type: Heavy-duty Trucks Dominates the Market
Heavy-duty units held 53.29% of the LNG Truck market share in 2024, underscoring the platform’s affinity for long-haul payload requirements. Medium-duty rigs, however, post the highest 6.89% CAGR as urban and regional distribution fleets seek cost-effective emissions compliance without sacrificing route flexibility. The category shift suggests fleet managers no longer view the fuel solely as a niche long-distance solution.
Adoption breadth widens as infrastructure spreads into metro depots and intermediate hubs. OEMs such as Volvo recorded a 25% global rise in gas-powered deliveries during 2024, aided by diversified chassis offerings. Buses continue a steady uptake in city fleets, where electric charging constraints surface beyond 200 km per shift. Every expansion in cylinder technology and fueling availability chips away at perception barriers, positioning LNG as a mainstream alternative rather than a specialized option


By Application: Freight Core Faces Consumer Tailwinds
Freight operations accounted for 49.47% of 2024 deliveries, leveraging LNG’s fuel-cost edge on high-mileage corridors. Yet the personal-vehicle slice, while small in absolute units, logged the leading 6.72% CAGR. This jump speaks to mature filling-station density in select markets, enabling private motorists to benefit from lower per-mile costs.
Commercial‐fleet dominance persists because range, payload, and quick refills align with logistics economics. Nevertheless, personal uptake signals station networks have reached a utility threshold whereby consumer demand becomes additive rather than cannibalizing. Municipal bus purchases and specialty vehicles such as cement mixers round out the portfolio, underscoring the fuel’s widening operational canvas.
By Tank Capacity: Mid-Range Sweet Spot Gives Way to Extended Range
The 300–500 kg bracket controlled 49.27% of the LNG Truck market size in 2024 thanks to its balance between cargo weight and fueling frequency. Above-500 kg systems now lead growth at 7.19% CAGR as long-haul carriers push for single-shift autonomy and dispatch flexibility. Sub-300 kg tanks retain a niche among light-duty urban fleets that need payload preservation.
CIMC Enric’s 1,500 L twin-cylinder module exemplifies where the segment is heading: diesel-like range with no operational compromise. ISO 1496-3 frameworks for containerized tanks streamline cross-border compliance, but an equivalent road-vehicle specification would unify economics further.
By Drive System: Conventional Dominance, Hybrid Upswing
Conventional spark-ignition and dual-fuel platforms commanded 85.38% of unit sales in 2024, a testament to proven reliability, service familiarity, and straightforward fueling. Hybrid setups, integrating regenerative braking and short electric boosts, expand quickest at 7.29% CAGR as OEMs blend combustion efficiency with urban-zone silent running. Cummins’ X15N illustrates steady evolutionary gains, showing 10% better fuel economy than its predecessor while complying with 2027 regulations.
Hybrid acceleration is most visible in drayage and regional distribution, where stop-start patterns suit battery assist. Over time, hybridization may serve as a stepping stone for fleets contemplating eventual zero-emission transitions.
Geography Analysis
Asia-Pacific held 48.49% of global revenue in 2024, advancing at a 7.42% CAGR through 2030. China’s early mover policies, bulked-up corridor assets, and favorable pump prices catalyzed a sales spike in 2024. India’s Hazira LNG truck-loading hub and domestic OEM offerings position the country as the region’s next-wave growth engine. Mature adopters Japan and South Korea continue incremental fleet renewals, while Indonesia eyes natural-gas mobility to monetize new upstream projects.
North America commands a robust installed base of gas stations and California’s layered incentive framework. U.S. natural-gas abundance underpins long-term fuel-cost spreads, yet aggressive federal credits for battery-electric trucks inject competitive tension along key freight corridors. Canada bets on multi-fuel strategies, piloting hydrogen where corridor electricity is ample, whereas Mexico’s planned Salina Cruz terminal may seed cross-border LNG freight lanes.
Europe pursues a two-track policy: immediate emissions relief via bio-LNG blends and an eventual pivot to zero-tailpipe powertrains. Germany’s new toll matrix weighs 1 EUR-per-ton-km CO₂ surcharges from December 2025, narrowing LNG’s cost buffer, yet bio-LNG credits can offset tariffs on compliant lanes. Scandinavian countries still procure LNG buses for cold-climate resilience, and Italy retains corridor build programs tied to EU grants. The Middle East and Africa, rich in gas reserves, explore LNG freight for domestic logistics, but power-generation priorities and sparse stations temper near-term volumes

Competitive Landscape
The LNG Truck market remains moderately fragmented. Top OEMs—Volvo, Daimler, Scania, FAW Jiefang, and Sinotruk—collectively accounted for a significant share of 2024 shipments. Their strategies hinge on re-engineering existing diesel chassis, thus preserving manufacturing economics. Fuel-system specialists such as Westport Fuel Systems, Hexagon Agility, and Chart Industries capture differentiated margin via cryogenic tank, pump, and injector technology.
Vertical integration is emerging. Shell and Clean Energy Fuels expand station footprints and secure upstream gas supply, ensuring price stability that feeds vehicle sales. Meanwhile, Daimler teamed with Linde on liquid-hydrogen supply, hedging against future shifts. As exemplified by Volvo and Westport’s HPDI venture, intellectual—property partnerships accelerate cycle times while spreading risk.
Rivalry increasingly centers on lifecycle GHG performance and TCO rather than sticker price. OEMs advertise bio-LNG readiness and methane-slip metrics, while suppliers tout boil-off suppression and range gains. Barrier to entry remains moderate: truck platforms require capital, but component supply chains are open, and regulatory homologation is routine in major markets.
LNG Vehicle Industry Leaders
FAW TRUCKS CO., LTD.
Sinotruk (CNHTC)
Volvo Group
Daimler Truck (Mercedes-Benz)
TRATON SE
- *Disclaimer: Major Players sorted in no particular order


Recent Industry Developments
- May 2025: Volvo Trucks reported a 25% jump in 2024 gas-powered sales to 8,000 units, with biogas-ready models cutting CO₂ up to 100% and LNG variants delivering 20% reductions.
- May 2025: Daimler Truck North America scheduled summer-2025 production of the Freightliner Cascadia fitted with the 15-liter Cummins X15N engine.
- September 2024: Mitsubishi Corporation extended its PETRONAS LNG partnership via new offtake contracts, maintaining a 10% stake in Malaysia’s 29.3 MTPA facilities.


Global LNG Vehicle Market Report Scope
| Medium-duty Trucks |
| Heavy-duty Trucks |
| Buses |
| Freight Transport |
| Public Transport |
| Personal Vehicles |
| Other Applications |
| Below 300 kg |
| 300-500 kg |
| Above 500 kg |
| Conventional Engine |
| Hybrid Engine |
| North America | United States |
| Canada | |
| Rest of North America | |
| South America | Brazil |
| Argentina | |
| Rest of South America | |
| Europe | Germany |
| United Kingdom | |
| Spain | |
| Italy | |
| France | |
| Netherlands | |
| Rest of Europe | |
| Asia-Pacific | India |
| China | |
| Japan | |
| South Korea | |
| Indonesia | |
| Rest of Asia-Pacific | |
| Middle East and Africa | United Arab Emirates |
| Saudi Arabia | |
| Turkey | |
| Egypt | |
| South Africa | |
| Rest of Middle East and Africa |
| By Vehicle Type | Medium-duty Trucks | |
| Heavy-duty Trucks | ||
| Buses | ||
| By Application | Freight Transport | |
| Public Transport | ||
| Personal Vehicles | ||
| Other Applications | ||
| By Tank Capacity | Below 300 kg | |
| 300-500 kg | ||
| Above 500 kg | ||
| By Drive System | Conventional Engine | |
| Hybrid Engine | ||
| Geography | North America | United States |
| Canada | ||
| Rest of North America | ||
| South America | Brazil | |
| Argentina | ||
| Rest of South America | ||
| Europe | Germany | |
| United Kingdom | ||
| Spain | ||
| Italy | ||
| France | ||
| Netherlands | ||
| Rest of Europe | ||
| Asia-Pacific | India | |
| China | ||
| Japan | ||
| South Korea | ||
| Indonesia | ||
| Rest of Asia-Pacific | ||
| Middle East and Africa | United Arab Emirates | |
| Saudi Arabia | ||
| Turkey | ||
| Egypt | ||
| South Africa | ||
| Rest of Middle East and Africa | ||


Key Questions Answered in the Report
What is the projected value of the LNG vehicle market by 2030?
It is expected to reach USD 38.24 billion by 2030 based on the current 3.21% CAGR forecast.
Which region leads current LNG vehicle adoption?
Asia-Pacific holds 48.49% of 2024 global revenue and maintains the fastest 7.42% CAGR through 2030.
Which vehicle class is growing fastest within this sector?
Medium-duty trucks are expanding at a 6.89% CAGR as fleets deploy LNG beyond traditional long-haul roles.
What technology mitigates range anxiety for LNG trucks?
Dual 1,500-liter cryogenic cylinders enable about 3,500 km per fill, matching diesel range for inter-city freight.
What factor most restrains future LNG truck growth in Europe?
Rapid cost declines and policy support for zero-emission battery-electric trucks are expected to erode LNG’s competitiveness over the medium term.
Page last updated on:


