New Zealand Data Center Market Size and Share
Market Overview
| Study Period | 2020 - 2031 |
|---|---|
| Forecast Data Period | 2026 - 2031 |
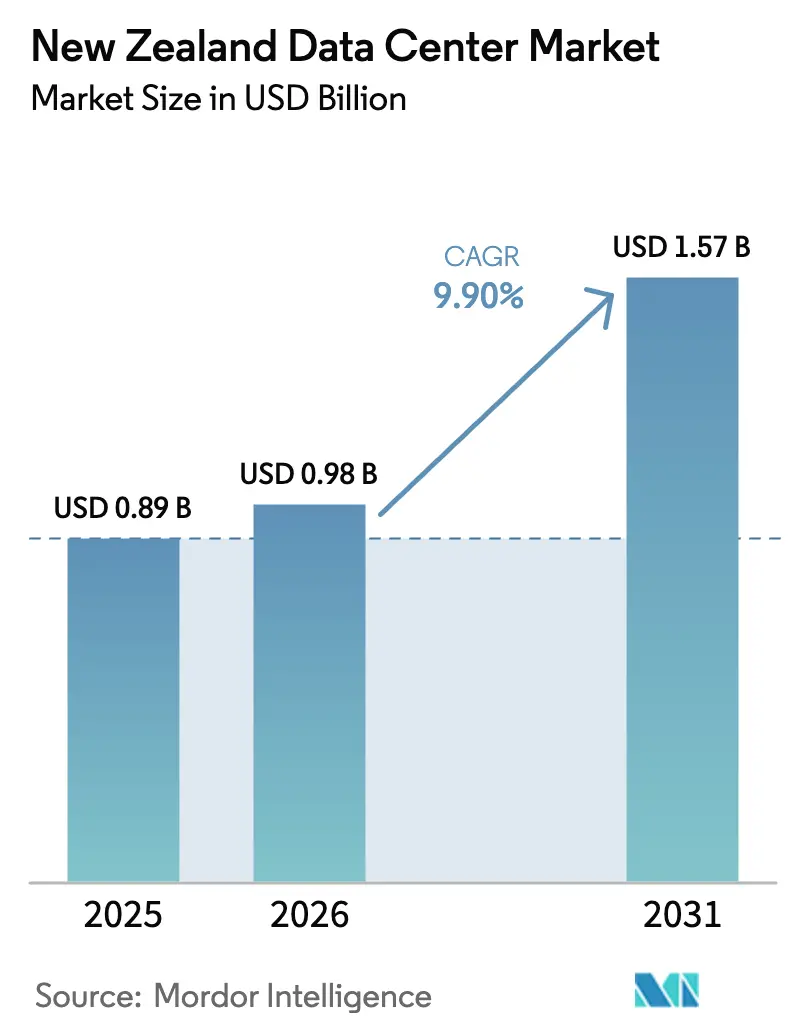
| Base Year Market Size (2025) | USD 0.89 Billion |
| Market Size (2026) | USD 0.98 Billion |
| Market Size (2031) | USD 1.57 Billion |
| Growth Rate (2026 - 2031) | 9.90% CAGR |
| Market Concentration | Medium |
Major Players *Disclaimer: Major Players sorted in no particular order Image © Mordor Intelligence. Reuse requires attribution under CC BY 4.0. | |
New Zealand Data Center Market Analysis by Mordor Intelligence
The New Zealand Data Center Market size is expected to grow from USD 0.89 billion in 2025 to USD 0.98 billion in 2026 and is forecast to reach USD 1.57 billion by 2031 at 9.9% CAGR over 2026-2031. In terms of IT Load Capacity, the market is expected to grow from 4.32 thousand megawatt in 2025 to 5.91 thousand megawatt by 2030, at a CAGR of 6.47% during the forecast period (2025-2030). The market segment shares and estimates are calculated and reported in terms of MW. Intensifying hyperscale cloud commitments, strict data sovereignty policies, and surging artificial intelligence compute requirements underpin this expansion trajectory. Operators expect IT load capacity to advance from 432 MW in 2025 to 591 MW by 2030, a slower 6.47% CAGR that signals improving power efficiency as next-generation infrastructure is deployed. Auckland currently commands the bulk of facilities and network connectivity, yet South Island locations offer renewable energy abundance and lower ambient temperatures that appeal to cost-sensitive hyperscalers. The market is also shifting from colocation-centric models toward self-built hyperscale estates as cloud providers race to guarantee data residency and latency advantages. Grid-capacity bottlenecks and limited powered land near Auckland remain the primary near-term headwinds; however, ongoing transmission upgrades and submarine cable projects are expected to ease structural constraints during the forecast horizon.
Key Report Takeaways
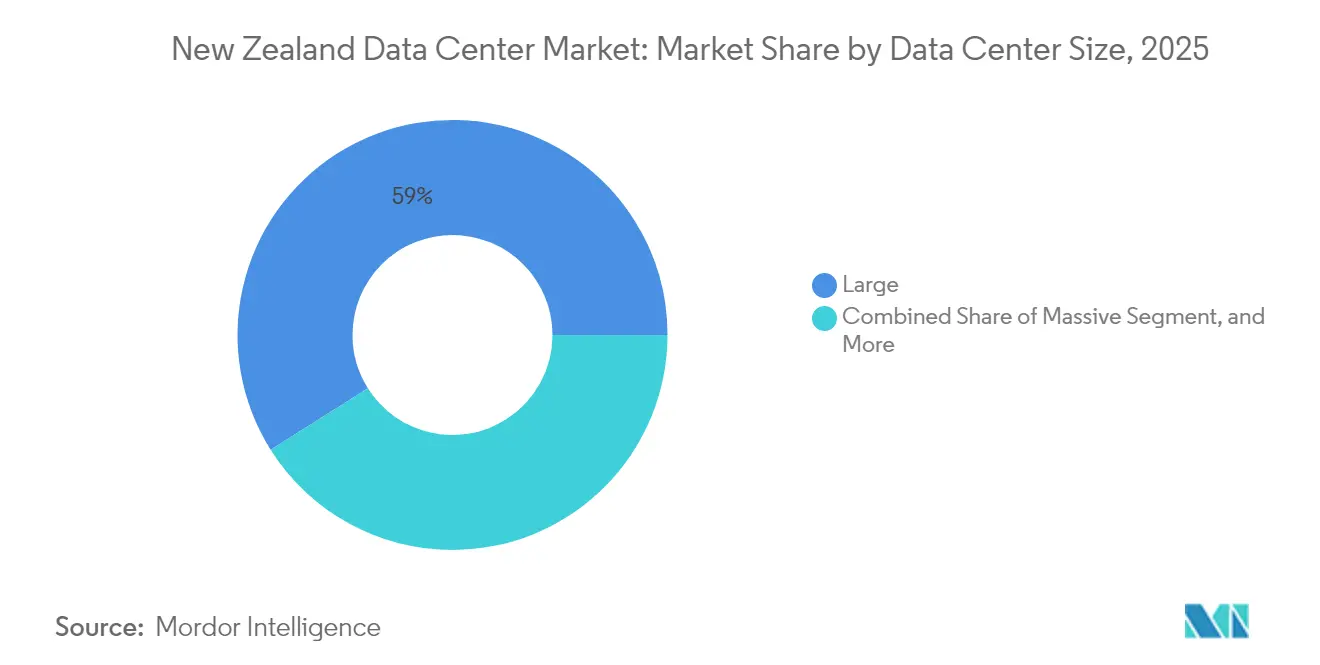
- By data center size, large facilities held 58.95% of the New Zealand data center market share in 2025, while medium-sized sites are forecast to register the fastest growth of 8.32% CAGR through 2031.
- By tier type, Tier 3 dominated with a 62.10% share in 2025; it is also projected to maintain a solid 6.98% CAGR over the same period.
- By data center type, colocation accounted for 51.90% of 2025 revenue; however, hyperscale/self-built deployments are projected to achieve a 8.96% CAGR through 2031.
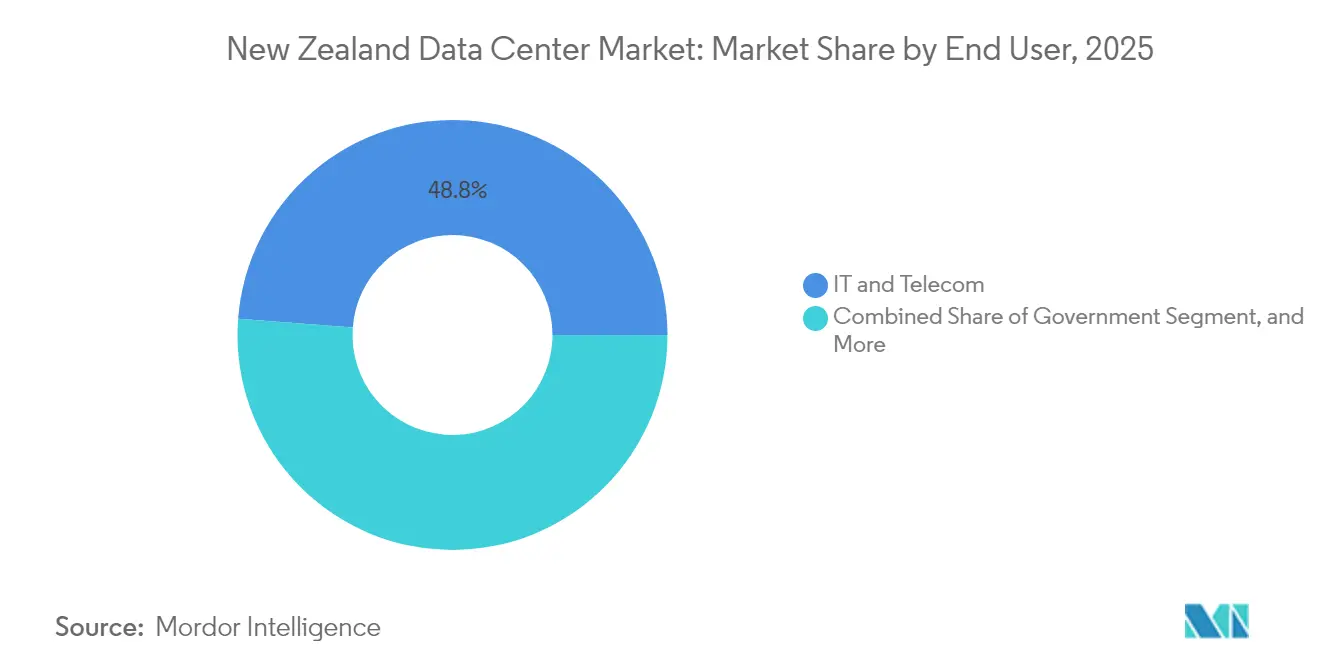
- By end user, IT and telecom delivered a 48.80% share in 2025, whereas banking, financial services, and insurance are expected to record the highest 4.12% CAGR through 2031.
- By hotspot, Auckland retained an 82.95% share in 2025, but Hamilton is set to rise at a 4.41% CAGR as operators diversify their footprints.
Note: Market size and forecast figures in this report are generated using Mordor Intelligence’s proprietary estimation framework, updated with the latest available data and insights as of 2026.
New Zealand Data Center Market Trends and Insights
Drivers Impact Analysis*
| Driver | (~) % Impact on CAGR Forecast | Geographic Relevance | Impact Timeline |
|---|---|---|---|
| Surge in hyperscale investment commitments | +3.2% | National, concentrated in Auckland with South Island expansion | Medium term (2-4 years) |
| Renewable-energy cost advantage across the grid | +2.1% | National, with South Island premium advantage | Long term (≥ 4 years) |
| Rising cloud adoption by New Zealand enterprises | +2.8% | National, with urban concentration in Auckland and Wellington | Short term (≤ 2 years) |
| Exploding AI compute demand and associated power needs | +1.5% | National, with hyperscale concentration in Auckland | Medium term (2-4 years) |
| Government data-sovereignty and residency regulations | +0.8% | National, affecting all regions equally | Long term (≥ 4 years) |
| Expansion of new submarine-cable landings enabling low latency | +0.9% | Coastal regions, primarily Auckland with Wellington secondary | Long term (≥ 4 years) |
| Source: Mordor Intelligence | |||
Surge in Hyperscale Investment Commitments
Amazon Web Services launched its "sovereign by design" New Zealand cloud region in September 2025, marking the largest publicly announced technology investment by an international company with USD 7.5 billion committed over multiple years. This follows Microsoft's December 2024 opening of New Zealand's first hyperscale cloud region, creating a competitive dynamic that accelerates infrastructure buildout beyond traditional telecommunications-driven demand. The sovereign positioning addresses data residency requirements while enabling local organizations to access artificial intelligence and machine learning capabilities without cross-border data transfers. Government officials project these investments will create over 1,000 jobs and contribute more than NZD11 billion to GDP, establishing data centers as critical economic infrastructure rather than supporting technology. The hyperscale commitment fundamentally reshapes market dynamics from colocation-centric to cloud-native infrastructure, with implications for power grid planning and regional development strategies.
Rising Cloud Adoption by New Zealand Enterprises
New Zealand's SaaS sector generated NZ$3.6 billion revenue in 2023 with 15% compound annual growth since 2016, creating substantial demand for underlying cloud infrastructure and data center capacity. The sector's export-led growth at 8.7% annually significantly outpaces overall export growth of 3.4%, indicating structural economic shift toward digital services that require resilient hosting infrastructure. Enterprise IT services revenue is projected to expand from NZ$7.12 billion in 2025 to NZ$8.52 billion by 2029, with 97% of organizations accelerating AI deployment and 36% planning to allocate over 40% of IT budgets to artificial intelligence initiatives. This enterprise digitization creates sustained demand for colocation services, managed hosting, and hybrid cloud architectures. The government's Cloud First policy and AI Activator program, targeting NZ$76 billion GDP contribution by 2038, institutionalizes cloud adoption across public sector agencies, providing predictable demand anchor for data center operators.
Renewable-Energy Cost Advantage Across the Grid
New Zealand's electricity generation mix of 85-87% renewable sources creates unique competitive advantages for energy-intensive data center operations, particularly as global hyperscale operators prioritize sustainability commitments. [1]Mercury, “Supporting customers decarbonisation goals,” mercury.co.nz Mercury's power purchase agreement with Amazon for approximately 50% of the Turitea South wind farm's output demonstrates active corporate procurement channels for renewable electricity, enabling data centers to secure long-term price certainty while meeting environmental objectives. The 221 MW Turitea Wind Farm, commissioned in May 2023, generated approximately 1,600 GWh over its first two years, contributing 2.5% of national renewable generation and illustrating the scale of clean energy infrastructure supporting digital transformation. Contact Energy's renewable electricity supply agreement with Lake Parime's new data center facility further evidences systematic integration of clean energy with digital infrastructure development. This renewable advantage positions New Zealand favorably against regional competitors while supporting corporate sustainability mandates driving location decisions.
Exploding AI Compute Demand and Associated Power Needs
The government's AI strategy, released in July 2025, projects artificial intelligence could contribute NZ$76 billion to GDP by 2038, with 97% of New Zealand organizations accelerating AI deployment creating unprecedented demand for specialized compute infrastructure. [2]New Zealand Government, “Government AI Strategy to boost productivity,” beehive.govt.nz Power demand for data centers is forecast to surge from 81 MW to 303 MW by 2030, potentially consuming up to 7% of New Zealand's total electricity in high-growth scenarios, necessitating grid capacity expansions and specialized cooling systems for GPU-intensive workloads. The government's light-touch regulatory approach, emphasizing existing privacy and consumer protection frameworks rather than prescriptive AI regulation, creates enabling environment for enterprise adoption while maintaining compliance requirements that favor local data processing capabilities. Microsoft's January 2025 release of automated compliance tools for New Zealand's public sector signals hyperscale providers are investing in regulatory alignment features that could accelerate government AI adoption. This convergence of policy support, enterprise demand, and infrastructure investment creates sustained growth trajectory for AI-capable data center capacity.
Restraints Impact Analysis*
| Restraint | (~) % Impact on CAGR Forecast | Geographic Relevance | Impact Timeline |
|---|---|---|---|
| Grid-capacity constraints and high wholesale power prices | -1.8% | National, with acute pressure in Auckland region | Short term (≤ 2 years) |
| Scarcity of suitable powered land near Auckland | -1.2% | Auckland metropolitan area primarily | Medium term (2-4 years) |
| Acute talent shortage in electrical and mechanical engineering | -0.9% | National, with concentration in urban centers | Long term (≥ 4 years) |
| Public scepticism over AI, privacy and data-center developments | -0.6% | National, with variation by community | Medium term (2-4 years) |
| Source: Mordor Intelligence | |||
Grid-Capacity Constraints and High Wholesale Power Prices
Transpower's proposed NZ$1.4 billion investment in Cook Strait HVDC link upgrades, scheduled for 2030-2031 construction, acknowledges critical transmission bottlenecks that constrain data center expansion in preferred Auckland locations. [3]Transpower, “Cook Strait electricity-link investment,” transpower.co.nz The existing undersea cables, installed in 1991 and approaching end-of-life in the early 2030s, can transfer only 15% of New Zealand's total electricity use, limiting North Island access to South Island renewable generation. Wholesale electricity price volatility creates operational risk for data centers with predictable power demand profiles, particularly during peak consumption periods when grid constraints force expensive generation dispatch. Chorus confirmed fiber pricing increases effective January 2025, with Home Fiber Starter rising 8.6% to NZ$38 monthly, indicating broader infrastructure cost inflation affecting data center operating expenses. The transmission upgrade timeline creates medium-term capacity constraints that may force data center operators to consider distributed architectures or alternative locations despite Auckland's connectivity advantages.
Scarcity of Suitable Powered Land Near Auckland
Auckland's concentration of 83.64% market share reflects connectivity and proximity advantages, yet land scarcity forces operators to explore alternative locations with infrastructure trade-offs. Only 4 data center facilities operate nationwide, all located in Auckland with combined capacity of just 29 MW, illustrating severe supply constraints relative to projected demand growth to 303 MW by 2030. The South Island emergence as a "green" data center hub, exemplified by Datagrid's planned 43-hectare facility near Invercargill, demonstrates geographic diversification driven by land availability and renewable energy proximity rather than traditional connectivity factors. AWS experienced stormwater design delays for its Auckland region launch, highlighting regulatory and infrastructure complexity in preferred locations that extends development timelines and increases capital requirements. The New Zealand Trade and Enterprise forecast of NZ$898 million annual colocation revenue by 2030 assumes successful site development, yet land constraints may force operators to accept higher latency or reduced redundancy in secondary markets.
*Our forecasts treat driver/restraint impacts as directional, not additive. The impact forecasts reflect baseline growth, mix effects, and variable interactions.
Segment Analysis
By Data Center Size: Large Facilities Drive Market Consolidation
Large sites controlled 58.95% of the New Zealand data center market share in 2025 as enterprises and hyperscalers pursued economies of scale. Medium-size facilities, however, will register the strongest 8.32% CAGR, supported by edge-compute and regional diversification requirements. The New Zealand data center market size attributable to large and medium segments is forecast to rise faster than the small-facility cohort, which faces margin pressure from cloud migration. Hyperscale providers such as AWS and Microsoft are standardizing three-zone sovereign footprints, reinforcing demand for multi-building campuses colocated on robust power feeds.
Continued consolidation favors operators capable of delivering sub-1.3 power-usage-effectiveness metrics and AI-ready thermal designs. Mega-facility proposals remain scarce owing to grid limitations, yet South Island wind-cooled campuses could unlock future mega-builds focused on GPU training workloads. Smaller urban sites will shift toward network edge caching, especially once 5G adoption drives latency-sensitive use cases across Auckland and Hamilton.


By Tier Type: Tier 3 Balances Availability and Cost Efficiency
Tier 3 platforms attracted 62.10% revenue in 2025 and will sustain a 6.98% CAGR as customers pursue high availability without Tier 4 cost premiums. The New Zealand data center market size allocated to Tier 3 aligns with the country’s stable grid and moderate seismic risk, which lowers the perceived necessity for double-fault tolerance. Tier 1 and Tier 2 buildings cater to test and development environments, whereas Tier 4 venues address mission-critical financial workloads requiring zero downtime.
Asset accretion remains active: T4 Group purchased Kyndryl’s Auckland facility in 2024, underscoring investor appetite for established Tier 3 sites. Financial-services digitization and impending biometric-privacy rules will drive selective Tier 4 expansions, although grid constraints keep absolute numbers modest across the forecast period.
By Data Center Type: Hyperscale Investment Reshapes Market Structure
Colocation retained 51.90% share in 2025 but faces structural headwinds as hyperscale/self-built estates expand at a 8.96% CAGR. The New Zealand data center market size attributable to self-built cloud regions will approach parity with colocation by the decade’s end, reshaping supplier dynamics. Retail colocation still serves small-and-medium enterprises seeking local hosting, while wholesale contracts provide interim capacity for cloud providers awaiting new-build completion.
Purpose-built hyperscale facilities integrate renewable-energy PPAs, advanced heat-rejection technologies and sovereign-compliant architectures. Spark’s August 2025 decision to divest a minority data-center stake reflects telecom operators’ pivot from asset ownership toward connectivity and managed-services revenue. Enterprise edge nodes will round out the ecosystem, supporting low-latency IoT and content-delivery workloads beyond Auckland.
By End User: Financial Services Drive Compliance-Focused Growth
IT and telecom agencies captured 48.80% share in 2025, yet their growth trajectory has plateaued relative to other segments. Banking, financial services and insurance show a 4.12% CAGR, propelled by real-time risk analytics, open-banking mandates and rising AI adoption. Government workloads benefit from mandatory domestic hosting under the Customer and Product Data Act 2025, reinforcing baseline demand for sovereign-compliant capacity.
Manufacturing, media and e-commerce verticals leverage edge processing and content-delivery networks to optimize latency. The New Zealand data center industry, therefore, experiences progressively diversified tenant mixes, mitigating reliance on a single sector and improving occupancy stability over investment cycles.
By Hotspot: Auckland Dominance Faces Regional Diversification
Auckland owns 82.95% of operational capacity, yet grid and land constraints compel operators to pursue Hamilton, Wellington and South Island builds. The New Zealand data center market size attributable to Auckland will keep expanding, but its overall market share gradually erodes as new regions commission capacity. Hamilton’s proximity to the national transmission backbone and Spark’s NZD 15 million edge facility lay the groundwork for a secondary hub. Wellington’s public-sector orientation and redundancy connectivity to South Island hydro assets underpin steady demand.
South Island projects, such as Datagrid’s 43-hectare Invercargill campus, combine renewable power and free-air cooling benefits that resonate with hyperscalers’ sustainability mandates. Subsea-cable initiatives-including the Tasman Ring Network and Hawaiki Nui-will further normalize latency profiles, narrowing Auckland’s historical networking advantage.
Geography Analysis
Auckland’s 82.95% capacity share translates into unmatched carrier density, multiple cable landing stations and the widest enterprise customer base. Yet only 29 MW of installed capacity remains insufficient against demand forecasts exceeding 326 MW by 2031, prompting expedited expansion plans. Stormwater-engineering hurdles and zoning restrictions elongate delivery timelines, increasing the cost of incremental megawatt deployment. Grid reinforcement projects, including the NZD 1.4 billion Cook Strait link upgrade, will eventually ease northbound renewable-power flows, but short-term bottlenecks persist.
Wellington yields predictable demand from central-government digital initiatives under the Cloud First and AI Activator programs. Its location enables balanced latency to South Island renewable-generation centers and North Island consumer markets, while offering lower land prices than Auckland. Hamilton’s ascendance, evidenced by a 4.41% CAGR, leverages ample land parcels, access to the National Grid and proximity to dairy-industry processing sites that increasingly deploy IoT analytics. South Island cities capitalize on abundant hydro and wind resources. Datagrid’s Invercargill campus targets hyperscale tenants requiring 100% renewable supply and low average temperatures, which could deliver superior power-usage effectiveness. Subsea-cable expansions scheduled for 2027 will deliver redundant routes into Christchurch and Dunedin, mitigating latency penalties historically associated with southern deployments. Once grid interconnector upgrades complete in 2031, power-rich South Island locations are likely to attract larger AI training clusters, further diversifying the national footprint.
Competitive Landscape
Only four live data center facilities currently operate nationwide, resulting in a high concentration and elevated barriers to entry. Regional heavyweight CDC Data Centres—backed by Australia’s Future Fund—leverages a total regional capacity of 2.5 GW to secure anchor tenants, although its New Zealand footprint remains modest. Hyperscale entrants have begun redrawing the map: AWS’s sovereign region and Microsoft’s hyperscale launch circumvent third-party colocation and embed proprietary cloud stacks directly in the market.
Consolidation continues as domestic investors acquire mature assets; T4 Group’s March 2024 purchase of a Kyndryl facility reflects the trend toward owning proven Tier 3 platforms. Sustainability differentiation is now a baseline requirement: Mercury’s long-term wind-energy PPA with AWS and Contact Energy’s renewable contract with Lake Parime underscore the imperative for zero-carbon credentials. Regulatory compliance under the Privacy Act and Overseas Investment Amendment Act 2025 adds procedural complexity, favouring incumbents with established governance frameworks.
Operators are also investing in AI-optimised designs featuring liquid immersion cooling and higher rack densities. The CDC’s planned Wellington build and Datagrid’s South Island campus both target rack averages of≥40 kW to capture GPU training workloads anticipated under the government’s NZD 76 billion AI roadmap. Strategic collaboration among utilities, telecom carriers, and data center specialists is likely to accelerate over the forecast horizon as each player seeks alignment on power, fiber, and zoning priorities.
New Zealand Data Center Industry Leaders
Amazon Web Services Inc.
DCI Data Centers Pty Limited
Microsoft Corporation
CDC Data Centres Pty Ltd
Google LLC
- *Disclaimer: Major Players sorted in no particular order


Recent Industry Developments
- September 2025: AWS launched its sovereign New Zealand cloud region with three availability zones and a long-term renewable-energy PPA with Mercury NZ.
- August 2025: Spark New Zealand agreed to sell a minority stake in its data-center portfolio to lower leverage and focus on services.
- July 2025: The government released its first AI Strategy projecting NZD 76 billion economic contribution by 2038 and adopting a light-touch regulatory stance.
- June 2025: The Overseas Investment Amendment Act 2025 introduced enhanced national-interest tests for foreign acquisitions of strategically important assets.


New Zealand Data Center Market Report Scope
Auckland, Christchurch, Hamilton, Wellington are covered as segments by Hotspot. Large, Massive, Medium, Mega, Small are covered as segments by Data Center Size. Tier 1 and 2, Tier 3, Tier 4 are covered as segments by Tier Type. Non-Utilized, Utilized are covered as segments by Absorption.| Large |
| Massive |
| Medium |
| Mega |
| Small |
| Tier 1 and 2 |
| Tier 3 |
| Tier 4 |
| Hyperscale/Self-built | ||
| Enterprise/Edge | ||
| Colocation | Non-Utilized | |
| Utilized | Retail Colocation | |
| Wholesale Colocation | ||
| BFSI |
| IT and ITES |
| E-Commerce |
| Government |
| Manufacturing |
| Media and Entertainment |
| Telecom |
| Other End Users |
| Wellington |
| Auckland |
| Rest of New Zealand |
| By Data Center Size | Large | ||
| Massive | |||
| Medium | |||
| Mega | |||
| Small | |||
| By Tier Type | Tier 1 and 2 | ||
| Tier 3 | |||
| Tier 4 | |||
| By Data Center Type | Hyperscale/Self-built | ||
| Enterprise/Edge | |||
| Colocation | Non-Utilized | ||
| Utilized | Retail Colocation | ||
| Wholesale Colocation | |||
| By End User | BFSI | ||
| IT and ITES | |||
| E-Commerce | |||
| Government | |||
| Manufacturing | |||
| Media and Entertainment | |||
| Telecom | |||
| Other End Users | |||
| By Hotspot | Wellington | ||
| Auckland | |||
| Rest of New Zealand | |||


Market Definition
- IT LOAD CAPACITY - The IT load capacity or installed capacity, refers to the amount of energy consumed by servers and network equipments placed in a rack installed. It is measured in megawatt (MW).
- ABSORPTION RATE - It denotes the extend to which the data center capacity has been leased out. For instance, a 100 MW DC has leased out 75 MW, then absorption rate would be 75%. It is also referred as utilization rate and leased-out capacity.
- RAISED FLOOR SPACE - It is an elevated space build over the floor. This gap between the original floor and the elevated floor is used to accommodate wiring, cooling, and other data center equipment. This arrangement assist in having proper wiring and cooling infrastructure. It is measured in square feet (ft^2).
- DATA CENTER SIZE - Data Center Size is segmented based on the raised floor space allocated to the data center facilities. Mega DC - # of Racks must be more than 9000 or RFS (raised floor space) must be more than 225001 Sq. ft; Massive DC - # of Racks must be in between 9000 and 3001 or RFS must be in between 225000 Sq. ft and 75001 Sq. ft; Large DC - # of Racks must be in between 3000 and 801 or RFS must be in between 75000 Sq. ft and 20001 Sq. ft; Medium DC # of Racks must be in between 800 and 201 or RFS must be in between 20000 Sq. ft and 5001 Sq. ft; Small DC - # of Racks must be less than 200 or RFS must be less than 5000 Sq. ft.
- TIER TYPE - According to Uptime Institute the data centers are classified into four tiers based on the proficiencies of redundant equipment of the data center infrastructure. In this segment the data center are segmented as Tier 1,Tier 2, Tier 3 and Tier 4.
- COLOCATION TYPE - The segment is segregated into 3 categories namely Retail, Wholesale and Hyperscale Colocation service. The categorization is done based on the amount of IT load leased out to potential customers. Retail colocation service has leased capacity less than 250 kW; Wholesale colocation services has leased capacity between 251 kW and 4 MW and Hyperscale colocation services has leased capacity more than 4 MW.
- END CONSUMERS - The Data Center Market operates on a B2B basis. BFSI, Government, Cloud Operators, Media and Entertainment, E-Commerce, Telecom and Manufacturing are the major end-consumers in the market studied. The scope only includes colocation service operators catering to the increasing digitalization of the end-user industries.
| Keyword | Definition |
|---|---|
| Rack Unit | Generally referred as U or RU, it is the unit of measurement for the server unit housed in the racks in the data center. 1U is equal to 1.75 inches. |
| Rack Density | It defines the amount of power consumed by the equipment and server housed in a rack. It is measured in kilowatt (kW). This factor plays a critical role in data center design and, cooling and power planning. |
| IT Load Capacity | The IT load capacity or installed capacity, refers to the amount of energy consumed by servers and network equipment placed in a rack installed. It is measured in megawatt (MW). |
| Absorption Rate | It denotes how much of the data center capacity has been leased out. For instance, if a 100 MW DC has leased out 75 MW, then the absorption rate would be 75%. It is also referred to as utilization rate and leased-out capacity. |
| Raised Floor Space | It is an elevated space built over the floor. This gap between the original floor and the elevated floor is used to accommodate wiring, cooling, and other data center equipment. This arrangement assists in having proper wiring and cooling infrastructure. It is measured in square feet/meter. |
| Computer Room Air Conditioner (CRAC) | It is a device used to monitor and maintain the temperature, air circulation, and humidity inside the server room in the data center. |
| Aisle | It is the open space between the rows of racks. This open space is critical for maintaining the optimal temperature (20-25 °C) in the server room. There are primarily two aisles inside the server room, a hot aisle and a cold aisle. |
| Cold Aisle | It is the aisle wherein the front of the rack faces the aisle. Here, chilled air is directed into the aisle so that it can enter the front of the racks and maintain the temperature. |
| Hot Aisle | It is the aisle where the back of the racks faces the aisle. Here, the heat dissipated from the equipment’s in the rack is directed to the outlet vent of the CRAC. |
| Critical Load | It includes the servers and other computer equipment whose uptime is critical for data center operation. |
| Power Usage Effectiveness (PUE) | It is a metric which defines the efficiency of a data center. It is calculated by: (𝑇𝑜𝑡𝑎𝑙 𝐷𝑎𝑡𝑎 𝐶𝑒𝑛𝑡𝑒𝑟 𝐸𝑛𝑒𝑟𝑔𝑦 𝐶𝑜𝑛𝑠𝑢𝑚𝑝𝑡𝑖𝑜𝑛)/(𝑇𝑜𝑡𝑎𝑙 𝐼𝑇 𝐸𝑞𝑢𝑖𝑝𝑚𝑒𝑛𝑡 𝐸𝑛𝑒𝑟𝑔𝑦 𝐶𝑜𝑛𝑠𝑢𝑚𝑝𝑡𝑖𝑜𝑛). Further, a data center with a PUE of 1.2-1.5 is considered highly efficient, whereas, a data center with a PUE >2 is considered highly inefficient. |
| Redundancy | It is defined as a system design wherein additional component (UPS, generators, CRAC) is added so that in case of power outage, equipment failure, the IT equipment should not be affected. |
| Uninterruptible Power Supply (UPS) | It is a device that is connected in series with the utility power supply, storing energy in batteries such that the supply from UPS is continuous to IT equipment even during utility power is snapped. The UPS primarily supports the IT equipment only. |
| Generators | Just like UPS, generators are placed in the data center to ensure an uninterrupted power supply, avoiding downtime. Data center facilities have diesel generators and commonly, 48-hour diesel is stored in the facility to prevent disruption. |
| N | It denotes the tools and equipment required for a data center to function at full load. Only "N" indicates that there is no backup to the equipment in the event of any failure. |
| N+1 | Referred to as 'Need plus one', it denotes the additional equipment setup available to avoid downtime in case of failure. A data center is considered N+1 when there is one additional unit for every 4 components. For instance, if a data center has 4 UPS systems, then for to achieve N+1, an additional UPS system would be required. |
| 2N | It refers to fully redundant design wherein two independent power distribution system is deployed. Therefore, in the event of a complete failure of one distribution system, the other system will still supply power to the data center. |
| In-Row Cooling | It is the cooling design system installed between racks in a row where it draws warm air from the hot aisle and supplies cool air to the cold aisle, thereby maintaining the temperature. |
| Tier 1 | Tier classification determines the preparedness of a data center facility to sustain data center operation. A data center is classified as Tier 1 data center when it has a non-redundant (N) power component (UPS, generators), cooling components, and power distribution system (from utility power grids). The Tier 1 data center has an uptime of 99.67% and an annual downtime of <28.8 hours. |
| Tier 2 | A data center is classified as Tier 2 data center when it has a redundant power and cooling components (N+1) and a single non-redundant distribution system. Redundant components include extra generators, UPS, chillers, heat rejection equipment, and fuel tanks. The Tier 2 data center has an uptime of 99.74% and an annual downtime of <22 hours. |
| Tier 3 | A data center having redundant power and cooling components and multiple power distribution systems is referred to as a Tier 3 data center. The facility is resistant to planned (facility maintenance) and unplanned (power outage, cooling failure) disruption. The Tier 3 data center has an uptime of 99.98% and an annual downtime of <1.6 hours. |
| Tier 4 | It is the most tolerant type of data center. A Tier 4 data center has multiple, independent redundant power and cooling components and multiple power distribution paths. All IT equipment are dual powered, making them fault tolerant in case of any disruption, thereby ensuring interrupted operation. The Tier 4 data center has an uptime of 99.74% and an annual downtime of <26.3 minutes. |
| Small Data Center | Data center that has floor space area of ≤ 5,000 Sq. ft or the number of racks that can be installed is ≤ 200 is classified as a small data center. |
| Medium Data Center | Data center which has floor space area between 5,001-20,000 Sq. ft, or the number of racks that can be installed is between 201-800, is classified as a medium data center. |
| Large Data Center | Data center which has floor space area between 20,001-75,000 Sq. ft, or the number of racks that can be installed is between 801-3,000, is classified as a large data center. |
| Massive Data Center | Data center which has floor space area between 75,001-225,000 Sq. ft, or the number of racks that can be installed is between 3001-9,000, is classified as a massive data center. |
| Mega Data Center | Data center that has a floor space area of ≥ 225,001 Sq. ft or the number of racks that can be installed is ≥ 9001 is classified as a mega data center. |
| Retail Colocation | It refers to those customers who have a capacity requirement of 250 kW or less. These services are majorly opted by small and medium enterprises (SMEs). |
| Wholesale Colocation | It refers to those customers who have a capacity requirement between 250 kW to 4 MW. These services are majorly opted by medium to large enterprises. |
| Hyperscale Colocation | It refers to those customers who have a capacity requirement greater than 4 MW. The hyperscale demand primarily originates from large-scale cloud players, IT companies, BFSI, and OTT players (like Netflix, Hulu, and HBO+). |
| Mobile Data Speed | It is the mobile internet speed a user experiences via their smartphones. This speed is primarily dependent on the carrier technology being used in the smartphone. The carrier technologies available in the market are 2G, 3G, 4G, and 5G, where 2G provides the slowest speed while 5G is the fastest. |
| Fiber Connectivity Network | It is a network of optical fiber cables deployed across the country, connecting rural and urban regions with high-speed internet connection. It is measured in kilometer (km). |
| Data Traffic per Smartphone | It is a measure of average data consumption by a smartphone user in a month. It is measured in gigabyte (GB). |
| Broadband Data Speed | It is the internet speed that is supplied over the fixed cable connection. Commonly, copper cable and optic fiber cable are used in both residential and commercial use. Here, optic cable fiber provides faster internet speed than copper cable. |
| Submarine Cable | A submarine cable is a fiber optic cable laid down at two or more landing points. Through this cable, communication and internet connectivity between countries across the globe is established. These cables can transmit 100-200 terabits per second (Tbps) from one point to another. |
| Carbon Footprint | It is the measure of carbon dioxide generated during the regular operation of a data center. Since, coal, and oil & gas are the primary source of power generation, consumption of this power contributes to carbon emissions. Data center operators are incorporating renewable energy sources to curb the carbon footprint emerging in their facilities. |


Research Methodology
Mordor Intelligence follows a four-step methodology in all our reports.
- Step-1: Identify Key Variables: In order to build a robust forecasting methodology, the variables and factors identified in Step-1 are tested against available historical market numbers. Through an iterative process, the variables required for market forecast are set and the model is built on the basis of these variables.
- Step-2: Build a Market Model: Market-size estimations for the forecast years are in nominal terms. Inflation is not a part of the pricing, and the average selling price (ASP) is kept constant throughout the forecast period for each country.
- Step-3: Validate and Finalize: In this important step, all market numbers, variables and analyst calls are validated through an extensive network of primary research experts from the market studied. The respondents are selected across levels and functions to generate a holistic picture of the market studied.
- Step-4: Research Outputs: Syndicated Reports, Custom Consulting Assignments, Databases & Subscription Platforms


