Urban/Street Furniture Market Size and Share
Market Overview
| Study Period | 2020 - 2031 |
|---|---|
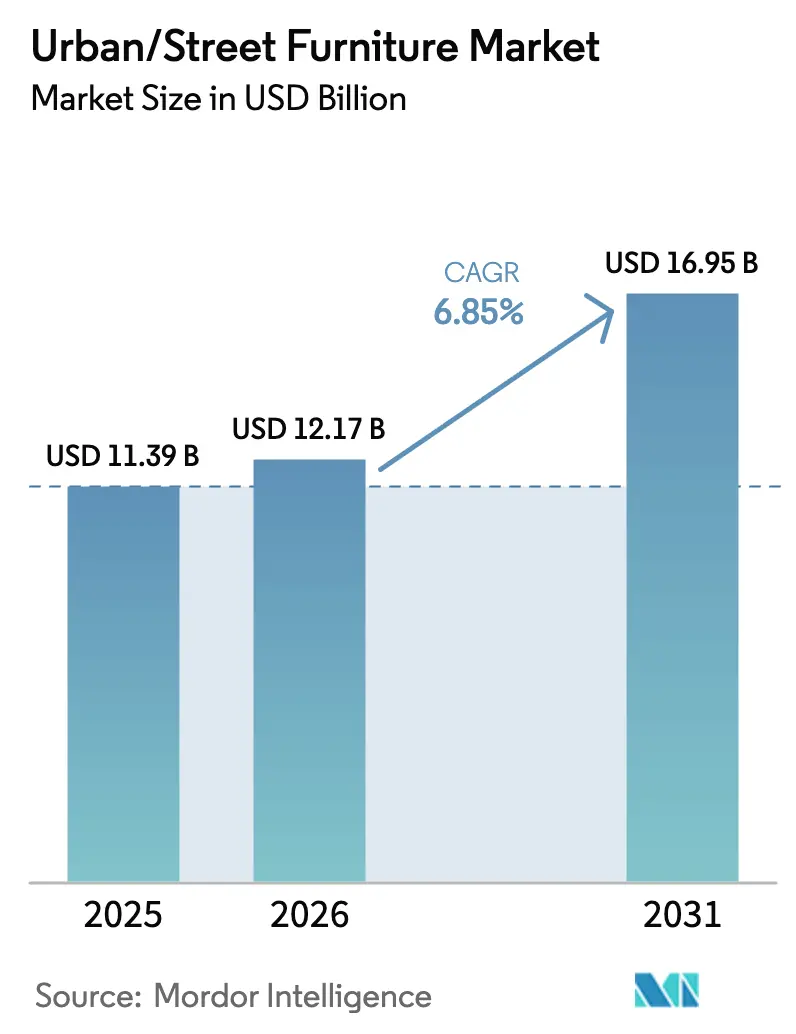
| Market Size (2026) | USD 12.17 Billion |
| Market Size (2031) | USD 16.95 Billion |
| Growth Rate (2026 - 2031) | 6.85% CAGR |
| Fastest Growing Market | North America |
| Largest Market | Asia Pacific |
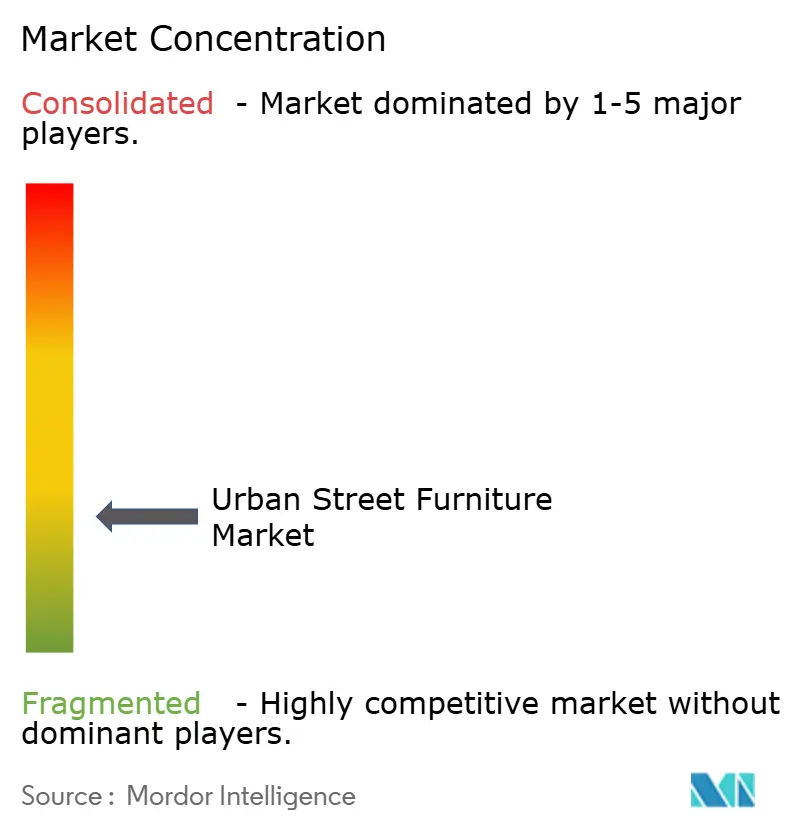
| Market Concentration | Low |
Major Players *Disclaimer: Major Players sorted in no particular order Image © Mordor Intelligence. Reuse requires attribution under CC BY 4.0. | |
Urban/Street Furniture Market Analysis by Mordor Intelligence
The urban/street furniture market size is expected to grow from USD 11.39 billion in 2025 to USD 12.17 billion in 2026 and is forecast to reach USD 16.95 billion by 2031 at 6.85% CAGR over 2026-2031. The expansion reflects a confluence of rapid urbanization, government-funded smart-city mandates, and sustainability policies that elevate public-realm fixtures from basic amenities to digitally connected infrastructure [1]United Nations Department of Economic and Social Affairs, “World Urbanization Prospects 2018: Highlights,” UN, un.org. . Demand is reinforced by municipal programs that embed IoT sensors, support outdoor advertising revenue, and enable climate-resilient designs that withstand heavier usage cycles. Competitive intensity remains moderate because procurement cycles are long and project scopes differ widely across regions, giving both global groups and local specialists space to win contracts. Europe currently dominates owing to mature procurement standards, yet Asia-Pacific posts the fastest growth as large-scale infrastructure spending unlocks standardized tenders for connected shelters, benches, and kiosks. Municipalities are also rewarding suppliers that disclose verifiable recycled content, driving a pivot toward circular-economy materials across the urban/street furniture market.
Key Report Takeaways
- By product category, benches and tables led with 38.67% of urban/street furniture market share in 2025; transit shelters and kiosks are forecast to expand at an 8.02% CAGR through 2031.
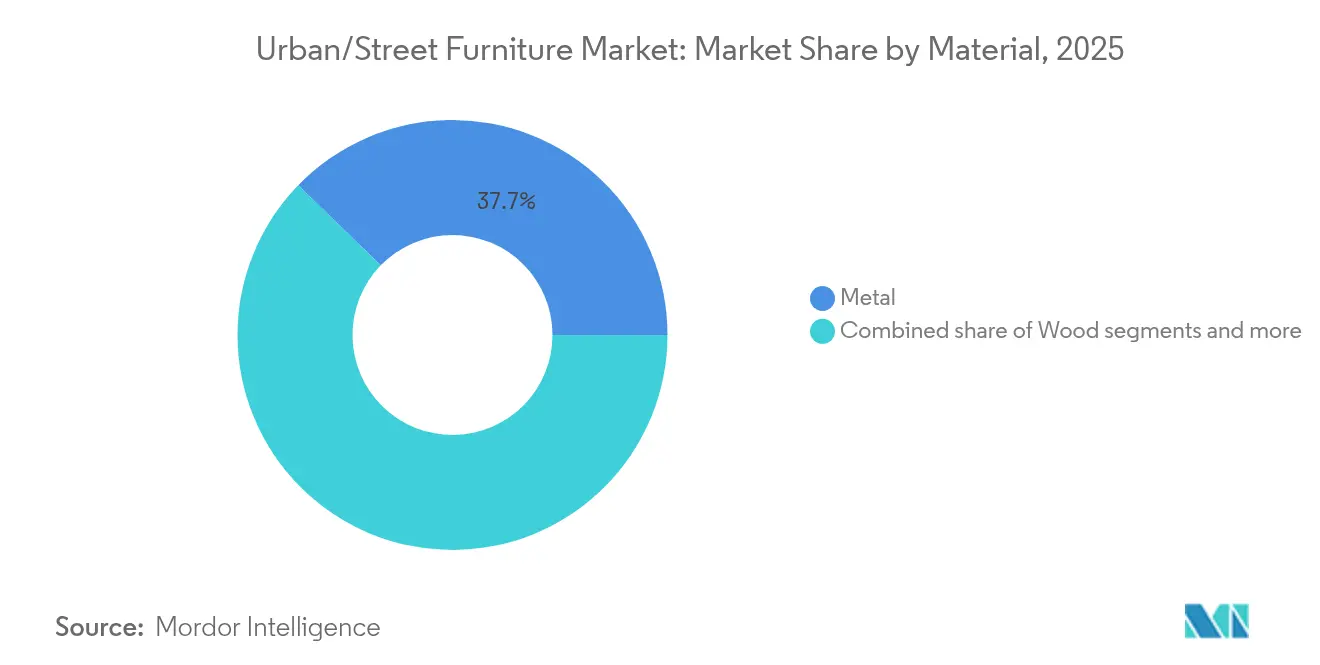
- By material, metal accounted for a 37.74% share of the urban/street furniture market size in 2025, while recycled and upcycled materials are projected to advance at an 7.68% CAGR between 2026-2031.
- By installation site, roadways and sidewalks held 32.02% of the urban/street furniture market share in 2025, whereas parks and recreational areas are expected to grow at a 7.55% CAGR to 2031.
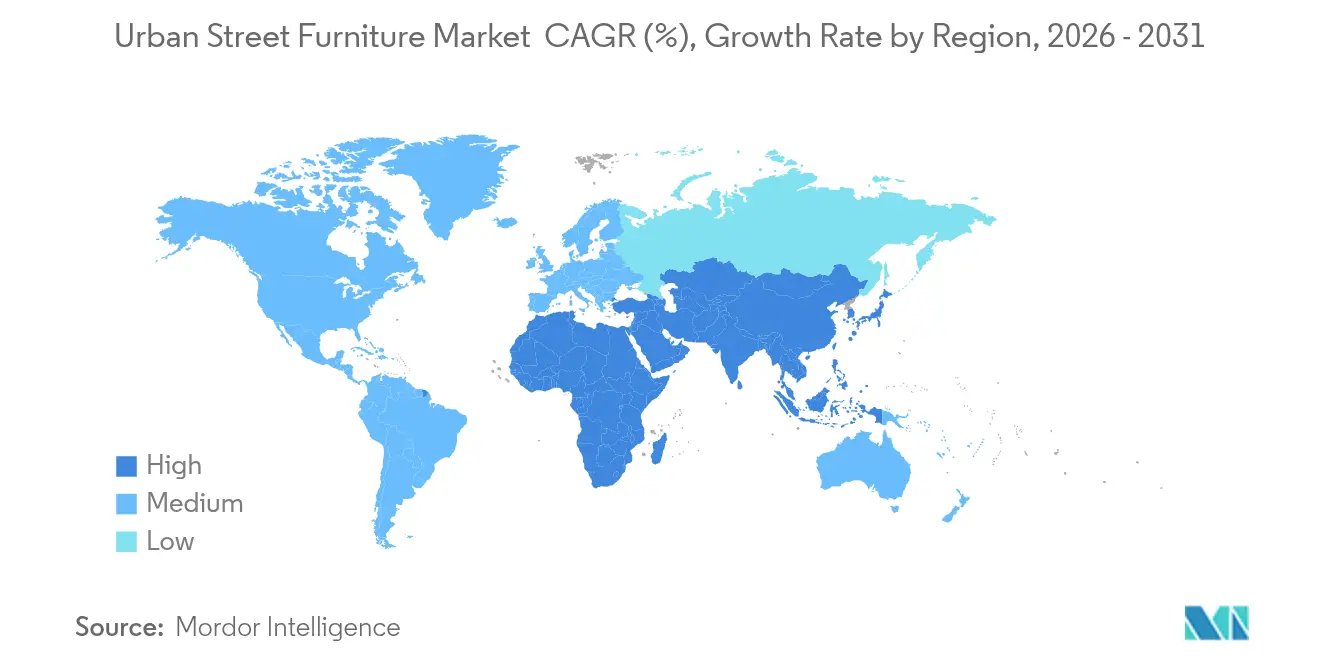
- By geography, Europe commanded 39.88% revenue share in 2025; Asia-Pacific is set to register the highest 8.14% CAGR over the same horizon.
Note: Market size and forecast figures in this report are generated using Mordor Intelligence’s proprietary estimation framework, updated with the latest available data and insights as of 2026.
Global Urban/Street Furniture Market Trends and Insights
Drivers Impact Analysis*
| Driver | (~) % Impact on CAGR Forecast | Geographic Relevance | Impact Timeline |
|---|---|---|---|
| Urban population growth & densification | 1.8% | Global, with highest impact in Asia-Pacific and Africa | Long term (≥ 4 years) |
| Government-led smart-city programs | 1.2% | Asia-Pacific core, spill-over to Europe and North America | Medium term (2-4 years) |
| Public-transport infrastructure expansion | 1.5% | Europe and Asia-Pacific, selective North American metros | Medium term (2-4 years) |
| Outdoor-advertising revenue models (IoT furniture) | 1.1% | North America & Europe, expanding to APAC urban centers | Short term (≤ 2 years) |
| ESG-focused modular & recyclable designs | 0.9% | Europe and North America, policy-driven adoption | Medium term (2-4 years) |
| Solar-powered micro-mobility charging benches | 0.6% | Global, with early adoption in Nordic countries and California | Long term (≥ 4 years) |
| Source: Mordor Intelligence | |||
Urban Population Growth & Densification
Cities accommodating swelling populations are retrofitting streetscapes with multifunctional fixtures that economize on ground space while serving more users. Connected benches equipped with occupancy sensors enable real-time monitoring, allowing planners to redeploy units to under-served blocks and to schedule maintenance before breakage occurs. Demand skews toward vandal-resistant metals and recycled composites that stand up to intensified wear, thereby containing lifetime costs for overstretched municipal budgets. Projects combining seating, shade structures, and device charging respond to the need for rest points in dense pedestrian corridors. Data collected from IoT modules feeds mobility dashboards and informs equitable amenity distribution, shifting asset management from reactive to predictive. Consequently, densification is a structural tailwind for the urban/street furniture market.
Government-Led Smart-City Programs
National smart-city blueprints are recasting street furniture as frontline nodes in wider urban data networks. China’s 2024 “new-type urban infrastructure” guideline requires IoT sensors, connectivity, and environmental monitoring across 500+ cities, standardizing bid specifications and unlocking scale economics for compliant suppliers [2]China State Council, “New-Type Urban Infrastructure Development Guidelines,” State Council, gov.cn. . South Korea’s strategic smart-city fund earmarked KRW 5.6 billion (USD 4.2 million) for climate-controlled shelters that feed transit updates to passengers. Such mandates reward vendors that ship pre-integrated hardware-software stacks, accelerating orders for solar-powered smart seats, air-quality kiosks, and 5G-ready poles. Compliance with cybersecurity and data-privacy rules, notably GDPR in Europe, adds a premium for established firms with certified platforms, magnifying competitive differentiation within the urban/street furniture market.
Public-Transport Infrastructure Expansion
Light-rail corridors, bus-rapid-transit lanes, and multimodal hubs require purpose-built shelters that merge accessibility, passenger information, and revenue-sharing digital displays. Los Angeles Metro’s East San Fernando Valley project illustrates how full Building Information Modeling guides furniture siting, load calculations, and future retrofits. Contracts often bundle advertising rights, letting operators like Clear Channel Outdoor recoup capital outlays via targeted campaigns, shortening payback periods for municipal partners. Upgraded shelters now feature induction-loop hearing systems, integrated CCTV, and e-paper timetables, setting new baseline specs. The expansion wave lifts demand for kiosks, bike-share docks, and real-time wayfinding modules, driving volume growth that outpaces benches and bins across the urban/street furniture market.
Outdoor-Advertising Revenue Models (IoT Furniture)
Digital networks embedded in benches, bins, and shelters convert passive fixtures into media assets that stream context-aware content. JCDecaux’s renewed London and Rome concessions show how analytics-enabled screens increase ad yield per location while funding public amenities. Sensor arrays count pedestrian traffic, enabling dynamic pricing and evidence-based placement strategies. Privacy-by-design approaches, such as cryptographically anonymized device detection from Soofa, align with tightening regulations and broaden municipal acceptance. Revenue-sharing contracts diversify city income streams and finance ongoing connectivity fees, ensuring continuous refresh cycles that benefit the urban/street furniture market.
Restraints Impact Analysis*
| Restraint | (~) % Impact on CAGR Forecast | Geographic Relevance | Impact Timeline |
|---|---|---|---|
| High upfront CAPEX & municipal budget limits | 0.8% | Global, with highest impact in developing economies | Short term (≤ 2 years) |
| Vandalism & maintenance costs | 0.7% | Urban centers globally, particularly high-density areas | Medium term (2-4 years) |
| Multi-stakeholder design-approval delays | -0.6% | Global, with higher prevalence in cities with complex governance structures | Medium term (2–4 years) |
| Privacy concerns over sensor-equipped units | -0.9% | Developed markets with stringent data protection regulations (e.g., EU, North America) | Long term (≥ 4 years) |
| Source: Mordor Intelligence | |||
High Upfront CAPEX & Municipal Budget Limits
Cash-constrained cities struggle to finance connected furniture that commands premiums of 15-25% over legacy models. Public-private partnerships mitigate sticker shock yet require intricate revenue-sharing formulas and long-term performance guarantees reviewed by multilateral lenders [3]World Bank, “Municipal Public-Private Partnerships Library,” PPP Knowledge Lab, ppp.worldbank.org. . Misaligned risk allocations, exemplified by Chicago’s parking-meter lease, underscore the pitfalls of off-balance-sheet deals that lock municipalities into decades-long commitments. When budgets tighten, decision-makers defer non-critical aesthetic upgrades, dampening short-term order flow in the urban/street furniture market.
Vandalism & Maintenance Costs
Anti-vandalism technologies and maintenance cost management represent critical challenges for smart street furniture deployment, particularly in high-traffic urban environments. ATP Lighting's development of IK10+ impact-resistant polymeric materials demonstrates the technical solutions available for vandal-proof construction, though these materials typically command 15-20% cost premiums over standard alternatives. The integration of structural health monitoring systems using IoT sensors can provide early warning of damage or tampering, enabling proactive maintenance scheduling and reducing total cost of ownership. However, the complexity of maintaining connected devices in outdoor environments creates ongoing operational challenges that many municipalities lack the technical expertise to manage effectively.
*Our forecasts treat driver/restraint impacts as directional, not additive. The impact forecasts reflect baseline growth, mix effects, and variable interactions.
Segment Analysis
By Product Type: Transit Integration Drives Digital Evolution
Transit shelters and kiosks generated the fastest 8.02% CAGR outlook, even as benches and tables retained the largest 38.67% portion of urban street furniture market share in 2025. Kiosks equipped with real-time passenger displays and advertising panels capitalize on ridership growth and municipal revenue targets. Clear Channel Outdoor, whose furniture arm accounts for 3% of Americas revenue, illustrates how outdoor-media incumbents bundle shelter upgrades with digital ad networks.
Emerging mobility models spur demand for bicycle racks and hybrid micro-mobility hubs that pair docking rails with charger ports and e-scooter corrals. Bin manufacturers such as Bigbelly add fullness sensors that cut collection drives and shrink emissions. Commoditized bollards and litter bins find margin defense through anti-corrosion alloys and design patents that align with architectural themes. Local artisans also win heritage projects by supplying cast-iron replicas that preserve historic streetscapes, ensuring diversity across the urban street furniture market.


By Material: Sustainability Mandates Reshape Supply Chains
The recycled and upcycled materials segment exhibits the highest growth potential at 7.68% CAGR for 2026-2031, while metal maintains dominance with a 37.74% market share in 2025. This divergence reflects the tension between established supply chains and emerging sustainability mandates that prioritize circular economy principles. The Victorian Government's Buy Recycled Directory and similar procurement policies across Europe are creating guaranteed demand for furniture manufactured from recycled content. Companies like Replas and Benito are demonstrating commercial viability of recycled plastic lumber and composite materials that offer superior weather resistance compared to traditional timber alternatives.
Wood and concrete segments face pressure from maintenance costs and sustainability concerns, though engineered timber products and low-carbon concrete formulations are maintaining market relevance. Plastic and composite materials benefit from design flexibility and color retention properties that reduce lifecycle costs, particularly in coastal environments where salt corrosion affects metal components. The EU's Circular Economy Action Plan and Ecodesign for Sustainable Products Regulation are establishing mandatory recycled content requirements that will reshape material selection criteria across European procurement processes . Manufacturers investing in closed-loop recycling capabilities and material traceability systems are positioning themselves for regulatory compliance and premium market positioning.
By Installation Site: Parks Drive Community-Centric Investment
Parks and recreational areas represent the fastest-growing installation segment at 7.55% CAGR for 2026-2031, reflecting municipal priorities for community engagement and outdoor programming. Despite roadways and sidewalks maintaining the largest share at 32.02% in 2025, the growth differential indicates shifting budget allocation toward amenity-rich public spaces that enhance quality of life and property values. Street Furniture Australia's ChillOUT Hub installations demonstrate how parks furniture can integrate shade, seating, and charging capabilities to create destination amenities that extend usage hours and improve accessibility. The integration of solar-powered charging stations and Wi-Fi connectivity transforms traditional park benches into community technology hubs that serve diverse demographic groups.
Public transit nodes require sophisticated furniture systems that balance passenger flow management, accessibility compliance, and revenue generation through advertising integration. Commercial districts and campuses demand furniture solutions that reflect brand identity while providing functional benefits such as device charging and environmental comfort. The convergence of micro-mobility infrastructure with traditional street furniture creates new hybrid categories that serve multiple transportation modes simultaneously. oOh!media's partnership with Bikeep for smart parking solutions demonstrates how traditional outdoor advertising companies are expanding into integrated mobility services. Installation site selection increasingly depends on data analytics that predict usage patterns and optimize placement for maximum public benefit and commercial return.
Geography Analysis
Europe retained 39.88% revenue share in 2025, underpinned by stringent accessibility codes and data-privacy statutes that favor incumbents with certified solutions. Regional growth moderates to 5.55% CAGR because streetscape stock is already extensive; most spend now flows to retrofits that replace legacy units with recycled-content models and GDPR-compliant sensors. Northern nations further accelerate adoption of solar-powered benches that exploit long summer daylight.
Asia-Pacific leads with an 8.14% CAGR outlook as megacity development, especially in China, deploys urban furniture at scale under standardized smart-city procurement frameworks. South Korea’s climate-controlled shelters and Japan’s disaster-resilient kiosks set high technical benchmarks. Australia’s councils bundle advertising concessions with sustainability clauses, boosting orders for locally sourced recycled composites, while ASEAN cities pursue cost-efficient modular ranges to stretch infrastructure budgets.
North America tracks a 6.05% CAGR, lifted by federal infrastructure grants and robust outdoor-advertising ecosystems that subsidize shelter upgrades. Los Angeles Metro’s BIM-driven corridor project typifies sophisticated specification requirements that elevate barriers to entry. Canada’s Smart Cities Challenge funds data-rich furniture pilots, and Mexico’s urban renewal programs open opportunities for durable yet affordable metal-and-wood hybrids, broadening supplier diversity in the urban/street furniture market.

Competitive Landscape
The urban/street furniture market is highly fragmented, indicating significant opportunities for regional specialists and technology-focused newcomers. The top players hold a relatively small portion of the overall market, with JCDecaux SA leading through its integrated approach that combines advertising with smart furniture solutions. This fragmentation arises from diverse regional needs, unique installation environments, and varying municipal procurement processes that often prioritize customized offerings over standardized products. Clear Channel Outdoor Holdings Inc. leverages its strong outdoor advertising relationships to support smart furniture deployments through revenue-sharing models. These factors create both challenges and openings for companies aiming to expand their presence across different regions.
Competitive advantage in this market is increasingly shaped by technological integration, sustainability practices, and the ability to manage complex public procurement processes. Companies like Metalco Srl stand out by combining modular design capabilities with expertise in traditional materials to target architecturally driven projects. Meanwhile, newer entrants are focused on embedding IoT technology and developing data analytics platforms to enhance urban infrastructure. Success in the sector depends on a company's ability to adapt products to different regulatory and cultural contexts while meeting smart city goals. This demand for customization reinforces the market’s low concentration and opens doors for niche innovation.
Compliance with international standards is now a critical requirement, especially for vendors targeting developed markets. Manufacturers must meet accessibility regulations like ISO 21542, environmental criteria such as ISO 14001, and data privacy laws including GDPR. As a result, partnerships between legacy furniture manufacturers and technology firms are becoming more common, aimed at delivering end-to-end solutions for smart urban environments. These alliances allow for the blending of aesthetic durability with advanced digital functions like connectivity, data collection, and remote monitoring. The ability to offer integrated, compliant, and city-specific solutions is becoming the defining trait of successful players in the evolving urban/street furniture landscape.
Urban/Street Furniture Industry Leaders
JCDecaux SA
Clear Channel Outdoor Holdings Inc.
Metalco Srl
Landscape Forms Inc
Street Furniture Australia Pty Ltd
- *Disclaimer: Major Players sorted in no particular order

Recent Industry Developments
- December 2024: Landscape Forms earmarked USD 70 million for a Michigan plant expansion adding 30,000 sq ft of manufacturing space.
- November 2024: Clear Channel Outdoor Holdings Inc. secured a 15-year partnership extension with the Metropolitan Transportation Authority covering 3,500 shelters across New York City.
- October 2024: oOh!media won the Parramatta City Council street-furniture tender, incorporating digital upgrades across the suburban Sydney network.
- July 2024: Furnitubes International released Veeva Sol benches using solar panels and IoT modules for European councils.


Global Urban/Street Furniture Market Report Scope
Urban/street furniture is equipment installed on the sides of streets and roads for several purposes. Examples of urban/street furniture are benches, traffic barriers, bollards, post boxes, phone boxes, streetlamps, traffic lights, traffic signs, bus stops, tram stops, taxi stands, public lavatories, fountains, watering troughs, memorials, public sculptures, and waste receptacles. The urban/street furniture market is segmented into types, distribution channels, end users, and geography. The market is segmented by type into wood, plastic, and metal. By distribution channel, the market is segmented into online and offline. By end user, the market is segmented into commercial and residential. The market is segmented by geography into North America, Europe, Asia-Pacific, South America, and Middle East & Africa. The report offers market size and forecasts for the urban/street furniture market in value (USD) for all the above segments.
| Benches & Tables |
| Litter Bins |
| Bollards & Barriers |
| Transit Shelters & Kiosks |
| Bicycle Racks & Micro-mobility Hubs |
| Others (Planters, Signage, Tree Grates, Loungers, Ashtrays etc.) |
| Metal |
| Wood |
| Concrete |
| Plastic & Composite |
| Others (Recycled/Up-cycled Materials, Glass, Stone) |
| Parks & Recreational Areas |
| Roadways & Sidewalks |
| Public Transit Nodes |
| Commercial Districts & Campuses |
| North America | United States |
| Canada | |
| Mexico | |
| South America | Brazil |
| Peru | |
| Chile | |
| Argentina | |
| Rest of South America | |
| Europe | United Kingdom |
| Germany | |
| France | |
| Spain | |
| Italy | |
| BENELUX (Belgium, Netherlands, Luxembourg) | |
| NORDICS (Denmark, Finland, Iceland, Norway, Sweden) | |
| Rest of Europe | |
| Asia-Pacific | China |
| India | |
| Japan | |
| South Korea | |
| Australia | |
| South-East Asia | |
| Rest of Asia-Pacific | |
| Middle East & Africa | United Arab Emirates |
| Saudi Arabia | |
| South Africa | |
| Nigeria | |
| Rest of Middle East & Africa |
| By Product Type | Benches & Tables | |
| Litter Bins | ||
| Bollards & Barriers | ||
| Transit Shelters & Kiosks | ||
| Bicycle Racks & Micro-mobility Hubs | ||
| Others (Planters, Signage, Tree Grates, Loungers, Ashtrays etc.) | ||
| By Material | Metal | |
| Wood | ||
| Concrete | ||
| Plastic & Composite | ||
| Others (Recycled/Up-cycled Materials, Glass, Stone) | ||
| By Installation Site | Parks & Recreational Areas | |
| Roadways & Sidewalks | ||
| Public Transit Nodes | ||
| Commercial Districts & Campuses | ||
| By Geography | North America | United States |
| Canada | ||
| Mexico | ||
| South America | Brazil | |
| Peru | ||
| Chile | ||
| Argentina | ||
| Rest of South America | ||
| Europe | United Kingdom | |
| Germany | ||
| France | ||
| Spain | ||
| Italy | ||
| BENELUX (Belgium, Netherlands, Luxembourg) | ||
| NORDICS (Denmark, Finland, Iceland, Norway, Sweden) | ||
| Rest of Europe | ||
| Asia-Pacific | China | |
| India | ||
| Japan | ||
| South Korea | ||
| Australia | ||
| South-East Asia | ||
| Rest of Asia-Pacific | ||
| Middle East & Africa | United Arab Emirates | |
| Saudi Arabia | ||
| South Africa | ||
| Nigeria | ||
| Rest of Middle East & Africa | ||


Key Questions Answered in the Report
What is the projected value of the urban street furniture market in 2031?
The market is forecast to reach USD 16.95 billion by 2031, reflecting a 6.85% CAGR over 2026-2031.
Which region is expected to record the fastest growth through 2031?
Asia-Pacific is projected to post the highest 8.14% CAGR, driven by large-scale smart-city investments.
Which product category is growing the quickest?
Transit shelters and kiosks lead growth with an anticipated 8.02% CAGR through 2031.
What material segment is gaining momentum due to sustainability policies?
Recycled and upcycled materials are expected to expand at an 7.68% CAGR as circular-economy mandates take effect.
How are cities funding high-tech furniture upgrades?
Many municipalities rely on advertising-funded models or public-private partnerships that share revenue and offset capital costs.
Page last updated on:


