
Living And Dining Room Furniture Market Size and Share
Market Overview
| Study Period | 2020 - 2031 |
|---|---|
| Market Size (2026) | USD 256.10 Billion |
| Market Size (2031) | USD 314.43 Billion |
| Growth Rate (2026 - 2031) | 4.19 % |
| Fastest Growing Market | Asia Pacific |
| Largest Market | North America |
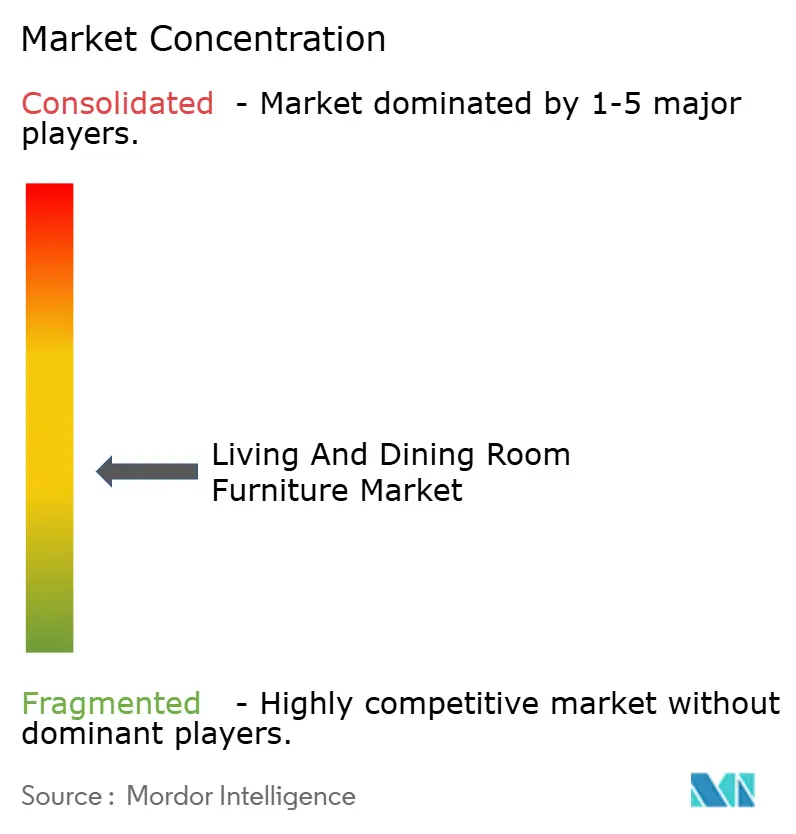
| Market Concentration | Medium |
Major Players *Disclaimer: Major Players sorted in no particular order Image © Mordor Intelligence. Reuse requires attribution under CC BY 4.0. | |

Living And Dining Room Furniture Market Analysis by Mordor Intelligence
The living and dining room furniture market size stands at USD 256.10 billion in 2026 and is forecast to reach USD 314.43 billion by 2031, registering a 4.19% CAGR. Beneath steady headline growth, the landscape is reshaping as Asia-Pacific demand accelerates on stimulus-led home upgrades, trade policy shifts alter sourcing footprints, and specialty-retail economics adjust to price transparency and higher delivered-unit costs. North America remains the largest region, while Asia-Pacific grows the fastest as China’s national trade-in program stimulates replacement cycles and India’s expanding middle class sustains premium upgrades. Tight lumber supply and freight-accessorials weigh on margins, which channels product development into value-engineered materials and modular designs that move efficiently through logistics networks. Digital tooling, including augmented reality and mass-customization platforms, improves conversion and lowers return risk for bulky goods, which supports online and omnichannel strategies within the living and dining room furniture market.
Key Report Takeaways
- By product type, sofas and sectionals led with 30.92% revenue share in 2025 in the living and dining room furniture market, while coffee and side tables are forecast to expand at a 5.80% CAGR through 2031.
- By material, wood held a 38.73% share in 2025 in the living and dining room furniture market, while plastic and acrylic are projected to grow at a 5.37% CAGR.
- By distribution channel, B2C/retail accounted for 78.94% in 2025, while B2B project channels are expected to grow at a 4.56% CAGR.
- By end user in the living and dining room furniture market, residential reached 73.81% in 2025, while commercial is set to register a 4.90% CAGR.
- By geography, North America held 32.64% in 2025, while Asia-Pacific is the fastest-growing region at a 4.72% CAGR through 2031.
Note: Market size and forecast figures in this report are generated using Mordor Intelligence’s proprietary estimation framework, updated with the latest available data and insights as of January 2026.
Market Trends and Insights
Drivers Impact Analysis of Living And Dining Room Furniture Market*
| Driver | (~) % Impact on CAGR Forecast | Geographic Relevance | Impact Timeline |
|---|---|---|---|
| Rapid growth of global residential construction & urban housing | +0.8% | Global, strongest in Asia-Pacific and select North American metros | Medium term (2-4 years) |
| Expansion of e-commerce & omnichannel retail platforms | +1.2% | Global, led by the United States, scaling in Asia-Pacific | Short term (≤ 2 years) |
| Demand for multifunctional, space-saving furniture | +0.7% | Global urban centers, strongest in Asia-Pacific and North America | Medium term (2-4 years) |
| Rising disposable incomes in emerging economies | +1.0% | Asia-Pacific core, with spillover across Southeast Asia | Long term (≥ 4 years) |
| AR/VR room-visualization tools boosting conversion | +0.3% | North America and Europe first, expanding in the Asia-Pacific | Short term (≤ 2 years) |
| Digital quick-turn custom manufacturing | +0.2% | North America and Europe, nascent in Asia-Pacific manufacturing hubs | Medium to long term (≥ 3 years) |
| Source: Mordor Intelligence | |||
Housing Completions Driving Immediate Furnishing Cycles
The completion metric matters more than starts because households typically furnish within three to six months of move-in, creating an immediate sales window that housing-permit data cannot capture. Regional growth is concentrated in the Midwest at 9.1% and the Northeast at +8.5% year-to-date, where existing-home turnover and new-build activity converge to lift furniture-store traffic[1]Source: NAHB, “Residential Construction Softens Amid Ongoing Housing Market Headwinds,” eyeonhousing.org. As multifamily development cycles continue into 2026, compact urban units favor modular, multifunctional living and dining assortments that align with tight footprints. The underlying pattern reinforces near-term order predictability for the living and dining room furniture market as completions rather than speculative starts guide the sales cadence in 2026.
E-commerce Penetration Reshaping Furniture Distribution Economics
Global furniture e-commerce revenue approaches USD 455.40 billion by 2025, with the United States online furnishing market alone at USD 87 billion and annual growth approximating 12%, substantially outpacing brick-and-mortar expansion[2]Source: Zolak, “Furniture Ecommerce,” zolak.tech. What remains under-reported is the bifurcation within online channels: 49% of United States furniture purchases now occur digitally, yet Germany lags at 11 to 15%, revealing that penetration curves are market-specific and hinge on logistics infrastructure for bulky goods. Omnichannel retailers retain 89% of customers versus single-channel competitors, underscoring that seamless integration, not pure online presence, drives loyalty. The strategic implication is stark: companies investing in AI-powered personalization (84% of e-commerce enterprises now integrate AI) and streamlined checkout (average cart abandonment sits at 69.57%) capture disproportionate share, while laggards hemorrhage margin to price-comparison platforms. TD Bank survey data show 52% of furniture retailers observing heightened consumer interest in online shopping, yet 64% still anticipate in-store demand for living and dining furnishings in H1 2025, suggesting the channel shift is accelerating but not yet complete[3]Source: Cylindo, “The State of the Furniture Industry,” blog.cylindo.com.
Compact Living Spaces Elevating Multifunctional-Furniture Demand
A greater share of new urban homes across Asia-Pacific is optimized for smaller footprints, which elevates demand for convertible sofa-beds, extendable dining tables, lift-top coffee tables, and stackable seating that reduces storage needs. The push toward dual-purpose designs aligns with remote and hybrid work, where a single room can serve as a lounge, dining, and workspace at different times of day. Modular sectionals and nesting tables offer flexible layouts that adjust as households grow or shift rooms, reinforcing replacement cycles in compact homes. Manufacturers are standardizing space-saving mechanisms and hardware to streamline quality control and manage costs in mass-market price points. The continuous migration to urban centers, especially in the Asia-Pacific region, keeps product innovation focused on small-space living in the living and dining room furniture market.
AR Visualization Cutting Returns While Lifting Conversion
Retailers are embedding augmented reality and 3D visualization into product pages and showrooms to help customers validate fit, scale, and color in real rooms before purchase. These tools reduce size-related returns and increase customer confidence, especially for large sectionals, dining tables, and storage units that are costly to move and replace. Return rates are a chronic drag on furniture e-commerce profitability, dropping from 25 to 35% industry-wide to 8 to 12% with AR implementation, directly expanding net margins[4]Source: Dagger Interactive, “Why Home Decor Retailers Need AR Visualization Tools 2026,” daggerinteractive.co.uk. Brands also report longer on-page engagement and more considered configuration choices when AR helps place scaled models into rooms. As the technology becomes standard in top-tier retail platforms, conversion rates improve alongside lower last-mile damage and return risk, which supports more resilient online economics. Visualization-led selling now acts as a core differentiator in the living and dining room furniture market by reducing uncertainty and elevating first-time satisfaction.
Restraints Impact Analysis of Living And Dining Room Furniture Market*
| Restraint | (~) % Impact on CAGR Forecast | Geographic Relevance | Impact Timeline |
|---|---|---|---|
| Volatile raw-material prices (wood, metals, textiles) | -0.6% | Global, most acute in North America and parts of Latin America | Short to medium term (≤ 3 years) |
| Supply-chain & freight disruptions for bulky goods | -0.4% | Global, with a higher impact on long cross-border routes | Short term (≤ 2 years) |
| Severe online price competition & margin pressure | -0.3% | Global, concentrated in North America and Europe | Medium term (2-4 years) |
| Stricter formaldehyde/VOC emission rules | -0.5% | North America, Europe, China | Long term (≥ 4 years) |
| Source: Mordor Intelligence | |||
Supply-Chain and Freight Disruptions Eroding Delivered-Unit Economics
Less-than-truckload contract rates averaged USD 46.40 per hundredweight in 2025, up 14.3% year-over-year, while full-truckload spot rates sit at USD 2.05 per mile, reflecting persistent capacity tightness for bulky furniture shipments. Furniture-specific shipping costs range from USD 350 to USD 3,000 per item, depending on service level - curbside freight runs USD 350 to USD 1,400, whereas white-glove delivery with room placement commands USD 1,200 to USD 3,000, directly impacting gross margin on sectionals and dining sets. Accessorial fees compound the challenge: residential delivery surcharges average USD 216 per drop, liftgate service costs USD 12.45 per hundredweight with a USD 184 minimum, detention fees run USD 73 per 28-foot trailer every 15 minutes, and peak-season surcharges lift rates 15 to 25%.
Stricter Formaldehyde and VOC Emission Rules Raising Compliance Costs
The United States Environmental Protection Agency has established formaldehyde emission limits for composite wood products under TSCA Title VI. These limits are set for hardwood plywood, medium-density fiberboard, thin MDF, and particleboard. All entities in the supply chain, including panel producers, fabricators, importers, distributors, and retailers, are required to obtain third-party certification from certifiers recognized by the Environmental Protection Agency. From March 22, 2024, laminated product producers using non-NAF or non-PF resins were required to comply with hardwood-plywood producer requirements, including quarterly third-party-supervised testing using ASTM E1333-14 methods, quality-control testing at least once per shift for particleboard and MDF, maintenance of a written quality-control manual, and retention of compliance records for three years. Wood furniture manufacturing operations classified as major sources of Hazardous Air Pollutants incurred annual compliance costs, alongside additional annualized capital and operation and maintenance expenditures.
*Our forecasts treat driver/restraint impacts as directional, not additive. The impact forecasts reflect baseline growth, mix effects, and variable interactions.
Living And Dining Room Furniture Market Segment Analysis
By Product Type:
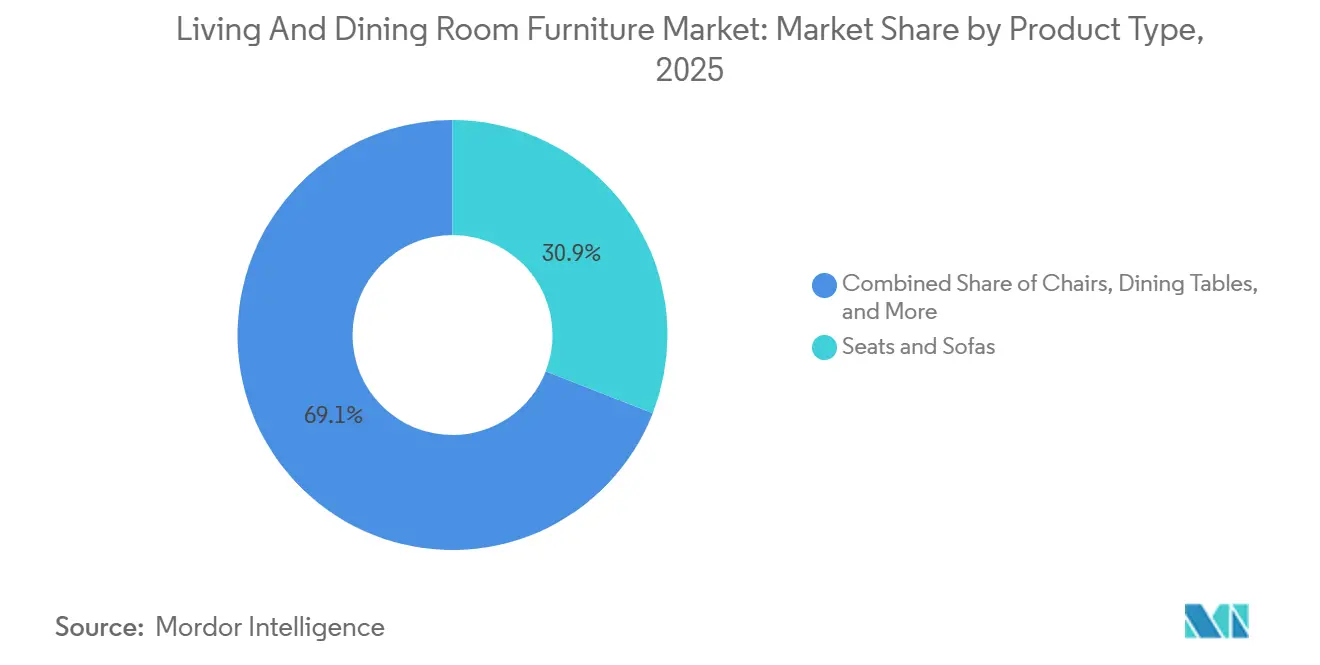
Sofas Lead Share, Coffee Tables Sprint on Multi-Function AppealSofas and sectionals command 30.92% of 2025 revenue, reflecting their central role in living spaces and their higher ticket values, while coffee and side tables are forecast to post a 5.80% CAGR through 2031. Multi-functional coffee and side tables that lift, nest, or conceal storage meet the needs of compact living, which keeps the segment’s velocity ahead of other categories in the living and dining room furniture market. Round and rectangular formats evolve toward slimmer profiles and space-smart mechanics, often engineered to support casual dining or laptop work. Modular sofas are trending due to their ability to adapt layouts in smaller rooms, and convertible sleepers address guest hosting in constrained spaces. Performance upholstery and stain-resistant fabrics support households with children and pets, which widens the addressable base for premium seating.
Within the living and dining room furniture market, dining tables and dining chairs continue to provide mid-cycle replacement opportunities as families update finishes and formats to match evolving interiors. Storage-added benches and chair styles with easy-clean surfaces extend the use case for dining rooms that double as workspaces. Media-storage needs shift toward slimmer consoles or wall systems as display mounting expands, which compresses demand for bulky media cabinets in living rooms. Accent seating, ottomans, and poufs fill gap needs in small apartments, adding flexible perches and footrests while avoiding clutter. As merchandising resets prioritize space efficiency, coffee and side tables are well positioned to sustain their leadership in forecast growth within the living and dining room furniture market.


By Material:
Wood Dominates, Plastic Accelerates on Cost and Tariff HedgeWood accounts for 38.73% of 2025 revenue, anchored by consumer preference for natural finishes and the structural versatility required across seating, tables, and storage. Plastic and acrylic are projected to expand at a 5.37% CAGR as manufacturers lean on polypropylene’s strength-to-weight and cost advantages to offset higher landed costs for select hardwoods. Mixed-material designs are gaining traction as metal bases pair with wood or glass tops, giving contemporary aesthetics at accessible price points while improving durability and maintenance. Branded assortments continue to specify certified or responsibly sourced wood where possible, though certification and availability considerations can influence final pricing. The living and dining room furniture market tilts toward engineered materials in entry and mid-tier price bands, while premium programs emphasize wood grains, veneer artistry, and tactile finishes.
As input volatility persists, procurement teams are expanding second-source options for cores, veneers, and finishes that maintain visual quality without destabilizing cost structures. Glass adds visual lightness in compact rooms, and tempered options answer durability concerns in family settings. Metal frames help stabilize structural performance for chairs and benches subject to heavy use in dining rooms. Plastic and acrylic formats scale quickly for stacking and small-space seating, which supports commercial and residential needs with consistent surface quality. Balanced material strategies help brands defend margins and availability in the living and dining room furniture market under variable trade and commodity conditions.
By Distribution Channel:
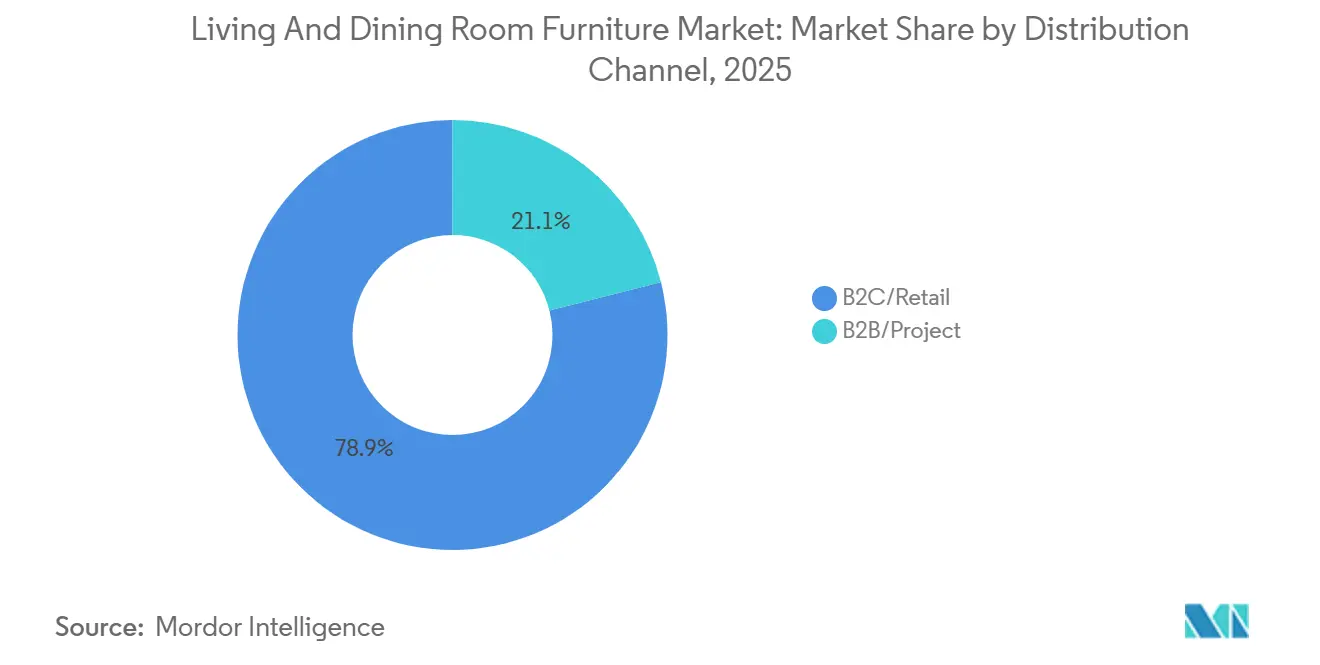
B2C/Retail Holds Mass, B2B Project Gains on InfrastructureB2C holds 78.94% of 2025 distribution, reflecting the enduring role of store-based evaluation for upholstery and dining finishes alongside sustained online discovery and checkout. Within B2C, omnichannel strategies remain central as leading players add showrooms to complement digital visualization and to reduce returns for large-ticket goods. B2B project channels are projected to grow at a 4.56% CAGR through 2031 as hospitality programs, office refresh cycles, and residential development pipelines generate multi-unit orders. Commercial-grade specifications for joinery, upholstery, and fire safety create distinct demand profiles relative to residential, which supports specialized contract assortments and warranties. As project pipelines deepen in select regions, B2B offers steadier volume and scheduling, which offsets periods of softer household discretionary spending.
In the living and dining room furniture market, retailers are responding to higher delivery costs by tiering fulfillment options from curbside to white-glove to protect conversion while aligning service levels to price points. Assortment curation for small-format showrooms focuses on high-velocity collections and configurable displays that AR and 3D tools can support. B2C operators cross-list contract-ready pieces for prosumers and small businesses that need commercial durability with home aesthetics. Contracts and hospitality programs add predictability in production scheduling and material procurement, which improves factory utilization. This blended channel approach helps smooth demand in the living and dining room furniture market across cycles.
By End User:
Residential Dominates Volume, Commercial Hospitality Charges AheadResidential households account for 73.81% of 2025 revenue, reflecting the central roles of sofas, sectionals, dining tables, and storage in home furnishing cycles. Organized retail and branded platforms continue to expand selection and service to match multi-functional living needs, which sustains broad-based residential demand in 2026. Compact homes and urban apartments favor modular and multi-use designs that elevate lifetime value through reconfigurability and replacement parts availability. Performance fabric options and balanced seat depths widen appeal across family and multi-generational households. These elements reinforce the residential anchor of the living and dining room furniture market as habits around hybrid work and in-home socializing persist.
Commercial end users, including hospitality and offices, are projected to outpace residential growth at a 4.90% CAGR as room refreshes, brand standards, and workspace reconfigurations drive periodic upgrades. Procurement often prioritizes reinforced frames, easy-clean surfaces, and compliance with fire safety and accessibility standards, which drives a premium over residential-only builds. Operators evaluate the total cost of ownership through longer warranties and serviceable components, which lengthen replacement cycles but maintain order sizes. As tourism recovery and corporate space optimization continue in select markets, commercial demand for dining seating, lounge pieces, and lobby tables extends the addressable base for suppliers. This momentum supports category breadth in the living and dining room furniture market across price tiers and finish options.
Geography Analysis
North America Living and Dining Room Furniture Market
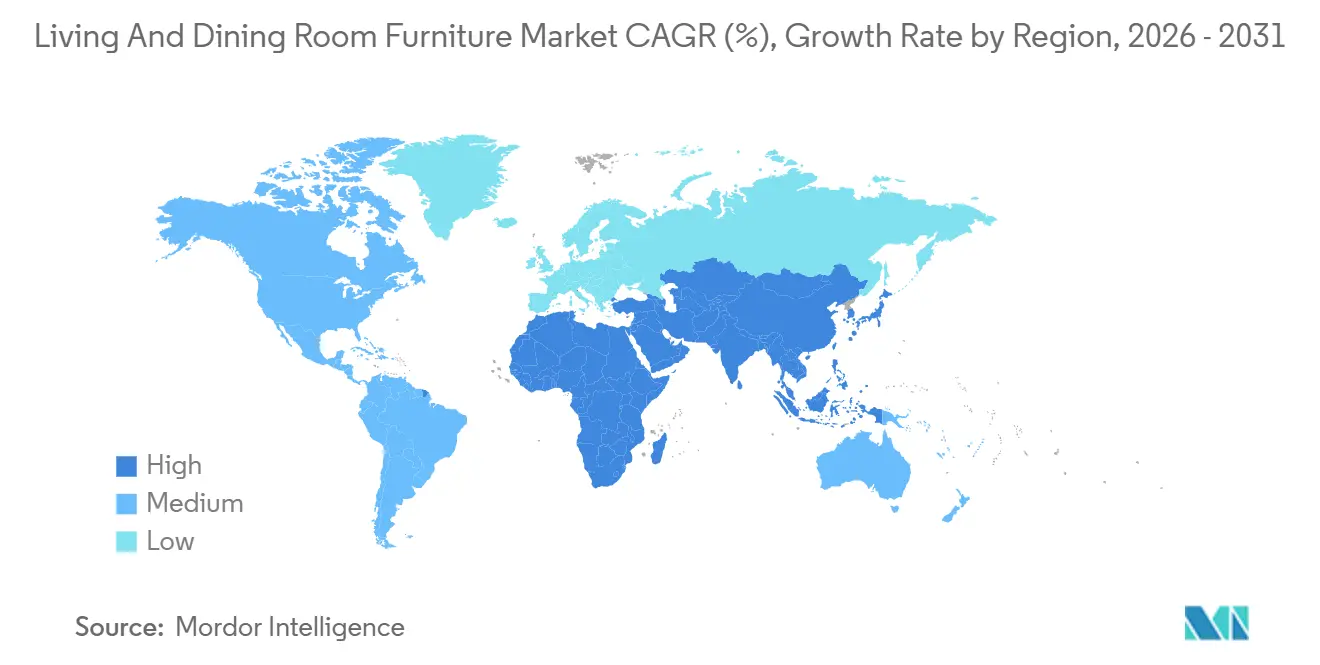
North America retains 32.64% of the 2025 base, underpinned by a large replacement market and active household formation that channels spending into living and dining assortments. United States single-family housing completions reached 1.009 million units on a seasonally adjusted annual rate in October 2025, up 2.0% year-over-year, reinforcing near-term furnishing cycles that align with move-in timelines. Retailers continue to balance store presentation with online visualization to reduce returns and maintain pricing power in upholstery and dining. As lumber and freight costs fluctuate, product engineering and sourcing diversification remain central to maintaining margin in the living and dining room furniture market. Canada and Mexico contribute through immigration-led household formation and nearshoring-enabled manufacturing, which supports regional supply resilience.
APAC Living and Dining Room Furniture Market
Asia-Pacific is the fastest-growing region at a 4.72% CAGR through 2031, driven by stimulus-backed upgrades and compact-living formats that favor multifunctional products. China’s nationwide trade-in policy and related incentive programs in 2025 boosted furniture sales, setting a supportive tone for organized retail and branded assortments. India’s expanding middle-income cohorts and improving access to consumer financing sustain demand for premium seating and dining, which benefits the living and dining room furniture market in urban centers. Southeast Asian production clusters and retail channels continue to support both export and domestic consumption, with small-space living shaping assortments across price tiers. This regional mix favors modular designs, engineered materials, and omnichannel selling models that reduce buyer friction.
EMEA Living and Dining Room Furniture Market
Europe maintains a large demand base with steady growth, supported by a high installed stock of homes and frequent interior refresh cycles that include living and dining updates. Organized retail banners and strong design heritage continue to define category trends that travel globally, especially in dining and seating silhouettes. Retailers leverage online visualization and curated in-store displays to serve tactile and digital shoppers, which keeps the channel mix balanced. Sustainability priorities, including emissions compliance for finishes and adhesives, shape material choices and supplier selection for living and dining programs. Across the broader Middle East and Africa, GCC investment pipelines support hospitality and residential projects, reinforcing B2B demand for dining seating and lounge assortments in the living and dining room furniture market.

Regulatory Landscape
In the United States, living and dining room furniture sellers and importers operate under a tightening product-safety and compliance regime overseen by the U.S. Consumer Product Safety Commission (CPSC). 16 CFR Part 1261 codifies the mandatory safety standard for clothing storage units under the STURDY Act (15 U.S.C. 2056f), including stability testing and labeling requirements for units manufactured after September 1, 2023. This extends to adjacent living-room storage products and adds pressure on the broader compliance posture for furniture assortments. Another process shift arrives July 8, 2026, when the CPSC requires mandatory electronic filing of Certificates of Compliance for all imported regulated products, raising the need for digitized documentation and tighter coordination between overseas factories, importers, and brokers.
Materials and sustainability requirements also shape how furniture is specified upstream. US formaldehyde limits for composite wood under TSCA Title VI continue to raise testing and recordkeeping requirements across the supply chain, including fabricators and importers, with laminated product producers facing additional compliance obligations from March 22, 2024 under specified conditions. In the European Union, Regulation (EU) 2024/1781 (Ecodesign for Sustainable Products Regulation) establishes the framework for mandatory ecodesign requirements and identifies furniture as a priority product group under the 2025-2030 working plan. Commission Decision (EU) 2026/66 (adopted December 23, 2025) extends existing EU Ecolabel criteria for furniture through December 31, 2029, providing continuity for voluntary sustainability labeling as the broader ecodesign framework progresses.
Value Chain Analysis
The living and dining room furniture value chain runs from upstream raw materials and components (lumber, engineered panels, metals, foam, textiles, adhesives, finishes, and hardware) into midstream manufacturing (upholstery build, casegoods fabrication, finishing, packaging, and quality testing), and then downstream distribution through B2C retail/online and B2B project channels. Compliance and material-selection decisions increasingly start upstream, since composite-wood and VOC/formaldehyde requirements push manufacturers and panel suppliers to manage resin choices, testing protocols, and documentation that travels with goods into import and retail. Freight economics remain a defining mid-to-downstream constraint for bulky goods, reinforcing flat-pack, modularity, and packaging engineering that reduces damage risk and last-mile handling complexity.
Sourcing and production footprints continue to diversify to manage lead times and trade exposure. Vietnam has overtaken China as the primary supplier of upholstered furniture to the United States since 2023, and manufacturers and distributors are adjusting networks as disruption risks rise, including Bassett Furniture exiting a West Coast wholesale distribution center in 2024. On the downstream side, omnichannel retailers and D2C brands use 3D/AR content pipelines, configurable SKUs, and delivery orchestration (curbside through white-glove), which makes data quality and planning discipline more important as the chain spans multiple origins, ports, and final-mile providers.
Competitive Landscape
The market remains moderately concentrated at the top, with global leaders competing against regional specialists and direct-to-consumer brands that scale through digital-first operations and curated showrooms. The period from 2024 to 2026 features consolidation moves and channel pivots as brands sharpen their omnichannel and sourcing strategies. Ashley Furniture expanded its portfolio with the acquisition of Resident Home in March 2024, adding sleep-adjacent brands and related categories that complement living and dining room assortments. Wayfair advanced its store strategy while launching internal AI tools to improve inspiration and guided selling, reinforcing the omnichannel path-to-purchase for bulky furnishings. Williams-Sonoma reported healthy comparable performance with resilient operating margins and a B2B business at scale, supported by supply-chain diversification and captive manufacturing for key programs.
La-Z-Boy executed retail consolidation by acquiring a 15-store network in the Southeast United States in 2025 to accelerate its Century Vision retail goals and bolster controlled distribution. The company also announced investments in distribution optimization to reduce travel distances and raise service levels for large-format seating and living room deliveries. IKEA extended its United States footprint and refreshed archival aesthetics through the NYTILLVERKAD collection, aligning design storytelling with accessible price points across core living room ranges. These strategic plays highlight how store expansion, experiential merchandising, and design refreshes protect share while online visualization and delivery orchestration reduce friction in the living and dining room furniture market. In parallel, material flexibility and emissions compliance remain key differentiators as brands balance sustainability and cost targets.
Manufacturing upgrades and localization efforts aim to mitigate trade exposure and lift responsiveness for large seating and dining items. Ashley invested in United States capacity expansion and automation to support e-commerce growth and shorten lead times for living and dining programs. The company also expanded internationally, including market entries that position the brand to serve growing middle-income cohorts with branded assortments. As logistics and input costs fluctuate, integrated players with captive design and manufacturing maintain relative advantages in speed, quality control, and compliance management. This capability set is increasingly important in the living and dining room furniture market as retailers demand reliable timelines and consistent finishes across broad assortments.
Living And Dining Room Furniture Industry Leaders
Ashley Furniture Industries Inc.
IKEA
Williams-Sonoma Inc.
Wayfair Inc.
La-Z-Boy Inc.
- *Disclaimer: Major Players sorted in no particular order
Living And Dining Room Furniture Market Companies Covered in this Report
- Inter IKEA Group
- Ashley Furniture Industries
- Williams-Sonoma Inc.
- La-Z-Boy Inc.
- Wayfair Inc.
- Man Wah Holdings
- Nitori Holdings
- KUKA Home
- Oppein Home Group
- Herman Miller Inc.
- Kimball International
- Durham Furniture Inc.
- B&B Italia (Haworth Lifestyle)
- Natuzzi S.p.A.
- Ethan Allen Interiors
- Bernhardt Furniture
- Sauder Woodworking
- Flexsteel Industries
- RH (Restoration Hardware)
- Steelcase Inc.

Market Opportunities and Future Outlook
Compliance-led sustainability and low-emission material shifts create room for suppliers that can document performance, durability, and emissions attributes at scale. In Europe, the Ecodesign for Sustainable Products Regulation (EU) 2024/1781 places furniture in a priority product group for the 2025-2030 working plan, elevating the value of measurable attributes such as repairability and recycled content alongside structured documentation. Materials suppliers are already acting: Unilin Panels reported Cradle to Cradle Certified Full Scope Bronze v4.0 across its full raw and melamine-faced MDF range (January 2026), and Sonae Arauco highlighted progress on SUSBOARD, a Horizon Europe project (EUR 6.9 million budget) focused on bio-based, formaldehyde-free adhesives (January 2026). For living and dining programs, these moves support roadmaps that rely heavily on MDF/particleboard cores and laminated surfaces, and they also strengthen B2B positioning where environmental scoring and documentation carry weight.
Digital selling, AI-enabled content operations, and smart-manufacturing adoption offer practical opportunities tied to conversion, returns, and throughput, rather than styling alone. Early 2026 industry survey signals show AI already in use across the furniture sector (43% implemented in parts of the business during 2025, with additional shares in pilots/experimentation), matching needs around demand sensing, configurable merchandising, and return reduction for bulky items. In parallel, carbon transparency and next-generation wood-based panels are becoming differentiated inputs for branded assortments and project specifications, supported by supplier initiatives such as Pfleiderer reporting low-carbon wood-based panel benchmarks in Germany (July 2026). These factors expand the addressable space for suppliers that combine compliant materials, traceable product data, and faster design-to-delivery cycles for modular seating and dining systems.
Recent Industry Developments in Living And Dining Room Furniture Market
- July 2026: IKEA announced the upcoming August 2026 launch of the KOMPISHÄNG collection focused on portable furniture for urban living. The move reinforces the companys emphasis on small-space functionality, a design direction aligned with compact-home formats that influence living and dining room assortments.
- November 2025: La-Z-Boy advanced its Century Vision strategy with continued physical retail expansion in the United States, including new store developments such as in San Antonio. The added controlled distribution supports higher-touch selling and service levels for large seating and dining categories where delivery and returns economics are critical.
- March 2024: Ashley Furniture expanded its portfolio by acquiring Resident Home, adding sleep-adjacent brands and capabilities that complement living-room programs. The acquisition broadened cross-category merchandising and strengthened the companys position across adjacent home-furnishings purchase missions.


Living And Dining Room Furniture Market Report Scope and Research Methodology
Market Definition and Coverage
This market covers household furniture mainly used in living rooms and dining rooms, measured in value terms. It includes commonly purchased seating, tables, and storage pieces sold through offline and online channels across major regions.
Scope exclusions: We exclude bedroom, kitchen, bathroom, outdoor, office, and hospitality furniture, along with soft furnishings and decor items that are not furniture.
Segments Covered in This Report
- By Product Type
- Seats & Sofas
- Chairs
- Coffee & Side Tables
- TV Stands & Cabinets
- Dining Tables
- Dining Chairs & Benches
- Ottomans & Poufs
- Others
- By Material
- Wood
- Metal
- Plastic & Acrylic
- Glass & Stone
- Other Materials
- By Distribution Channel
- B2C / Retail
- Home Centers
- Specialty Furniture Stores
- Online
- Other Distribution Channels
- B2B / Project
- B2C / Retail
- By End User
- Household / Residential
- Commercial (Hospitality, Offices, Others)
- By Geography
- North America
- Canada
- United States
- Mexico
- South America
- Brazil
- Peru
- Chile
- Argentina
- Rest of South America
- Europe
- United Kingdom
- Germany
- France
- Spain
- Italy
- BENELUX (Belgium, Netherlands, Luxembourg)
- NORDICS (Denmark, Finland, Iceland, Norway, Sweden)
- Rest of Europe
- Asia-Pacific
- India
- China
- Japan
- Australia
- South Korea
- South-East Asia (Singapore, Malaysia, Thailand, Indonesia, Vietnam, Philippines)
- Rest of Asia-Pacific
- Middle East and Africa
- United Arab Emirates
- Saudi Arabia
- South Africa
- Nigeria
- Rest of Middle East and Africa
- North America
Data Sources, Market Sizing, and Validation
Desk Research
Desk research is used to set the market boundary, build the demand drivers, and anchor country-level starting points before forecasting begins. We rely on public, non-paywalled sources such as national statistics offices and household expenditure tables, customs and trade databases for furniture and wood product codes, and central bank inflation and currency series to normalize values over time.
To keep the model aligned with how the industry sells and ships product, we also review manufacturer and retailer filings, investor presentations, and earnings call notes that discuss category mix, price actions, and channel shifts. Additional checks come from sources such as UN Comtrade-style trade statistics, FAO forestry and wood product indicators, and patent databases for materials and modular design signals. The examples above are illustrative and not exhaustive, and we used additional public sources during data collection, validation, and research clarification.
Primary Interviews and Surveys
Primary work is used to pressure test pricing, mix, and channel assumptions that are not fully visible in public datasets. We spoke with manufacturers, distributors, retailers, and trade bodies in APAC, EMEA, and the Americas, focusing on replacement cycles, promotion intensity, and online share so regional patterns could be reflected in the final model.
Distribution of primary research fieldwork respondents
| Company type | Respondent position | Region |
|---|---|---|
| Top tier: 34% | CXOs: 14% | APAC: 46% |
| Mid tier: 49% | Functional/Unit leaders: 36% | EMEA: 32% |
| Smaller Players: 17% | Managers: 50% | Americas: 22% |
Market-Sizing & Forecasting
Sizing starts from a top-down demand pool built using furniture consumption indicators, household formation, and housing activity, then translated into category spend for living and dining room use cases. Once the core demand pool is built, we cross-check with selective bottom-up approximations, such as sampled average selling price bands by key product groups, multiplied by estimated unit movement from channel checks, and adjusted only when the gap can be explained.
Key inputs in the model include household disposable income trends, residential construction and home sales activity, online furniture penetration by region, price inflation for wood and furniture inputs, and promotion intensity that impacts realized selling prices. Forecasts use scenario analysis supported by expert consensus on macro conditions and category price progression, and the final path is selected when implied volumes and price ranges stay realistic. Where bottom-up visibility is weak in smaller countries, we fill gaps using calibrated per-household spend relationships tied to comparable markets, then confirm the direction using interview feedback.
Data Validation & Update Cycle
Outputs are validated through repeated cross-checks against independent signals, including trade flows, reported category revenues, and regional housing and income trends, followed by variance reviews at country and regional levels. If a market jump goes beyond what the inputs explain, we reopen the assumptions and, when needed, re-contact respondents to confirm whether price, mix, or channel shifts were the real driver.
Before publication, the work goes through multi-step analyst review so calculation logic, currency handling, and year alignment are consistent across regions. Reports are refreshed annually, and interim updates are made when material events occur that can change demand, pricing, or trade patterns. Right before delivery, a final pass is completed so clients receive the latest updated view.
Mordor Intelligence's Global Living and Dining Room Furniture Market Size Versus Other Published Estimates
Published market sizes for living and dining room furniture often do not match because the included products and counting rules are not the same. Differences usually come from whether seating is fully included, how storage units are treated, how online sales are captured, and which year is used as the price and currency base.
Housing turnover signals, import-export movement for relevant furniture categories, and channel mix checks are the evidence used to connect Mordor Intelligence's USD 256.10 B (2026) estimate to a full living and dining room furniture basket that includes seating, tables, and storage, rather than a narrower set limited to tables and cabinets. In other publications, the spread is commonly explained by tighter type lists, shorter time windows, and price progression methods that are not re-checked against these demand and trade indicators.
Benchmark comparison
| Source | Market Size | Gaps in Research Methodology |
|---|---|---|
| Mordor Intelligence | USD 256.10 B (2026) | |
| Global Consultancy A | USD 183.09 B (2025) | Uses a narrower product scope centered on tables and cabinets/storage, which can leave out several seating-led living room purchases. The year and price basis also differ, so currency timing and inflation handling can shift the reported value. |
| Industry Publisher B | USD 116.65 B (2024) | Applies a tighter definition by type, largely around tables and storage, and can undercount seating and other living room furniture pieces. A different base-year setup can also change how ASP progression and online mix uplift are reflected. |
Looking at the three figures together, the biggest driver of the gap is product scope, followed by year alignment and how prices are carried forward. By keeping the demand pool traceable to clear signals, then re-checking it with channel feedback, the resulting number stays repeatable across regions without over-relying on one data series.


Key Questions Answered in the Report
What is the current size and growth outlook for the living and dining room furniture market?
The living and dining room furniture market size is USD 256.10 billion in 2026 and is expected to reach USD 314.43 billion by 2031 at a 4.19% CAGR.
Which region leads, and which region is expanding fastest in living and dining room furniture?
North America holds the largest share, while Asia-Pacific is the fastest-growing region through 2031 on the back of stimulus-driven upgrades and compact-living formats.
Which product types and materials are most significant within living spaces?
Sofas and sectionals lead by share, while coffee and side tables are the fastest-growing; wood dominates by material share, and plastic and acrylic are growing faster due to cost and design flexibility.
How are e-commerce and omnichannel models changing buying behavior for living and dining furniture?
Retailers are adding showrooms to support visualization and tactile evaluation while enhancing online tools, which improves conversion and lowers returns for bulky goods.
What regulations are affecting materials and finishes in living and dining room products?
Stricter emissions rules for aerosol coatings and related finishes increase testing and compliance needs, which favor integrated manufacturers with robust quality systems.
How do logistics costs influence pricing and margins in this category?
Higher base rates and accessorials, plus the cost spread between curbside and white-glove delivery, put pressure on gross margins and steer assortments toward efficient packaging and fulfillment models.
Page last updated on:





