
Market Overview
| Study Period | 2020 - 2031 |
|---|---|
| Forecast Data Period | 2026 - 2031 |
| Base Year Market Size (2025) | USD 28.23 Billion |
| Market Size (2026) | USD 29.69 Billion |
| Market Size (2031) | USD 38.21 Billion |
| Growth Rate (2026 - 2031) | 5.18 % |
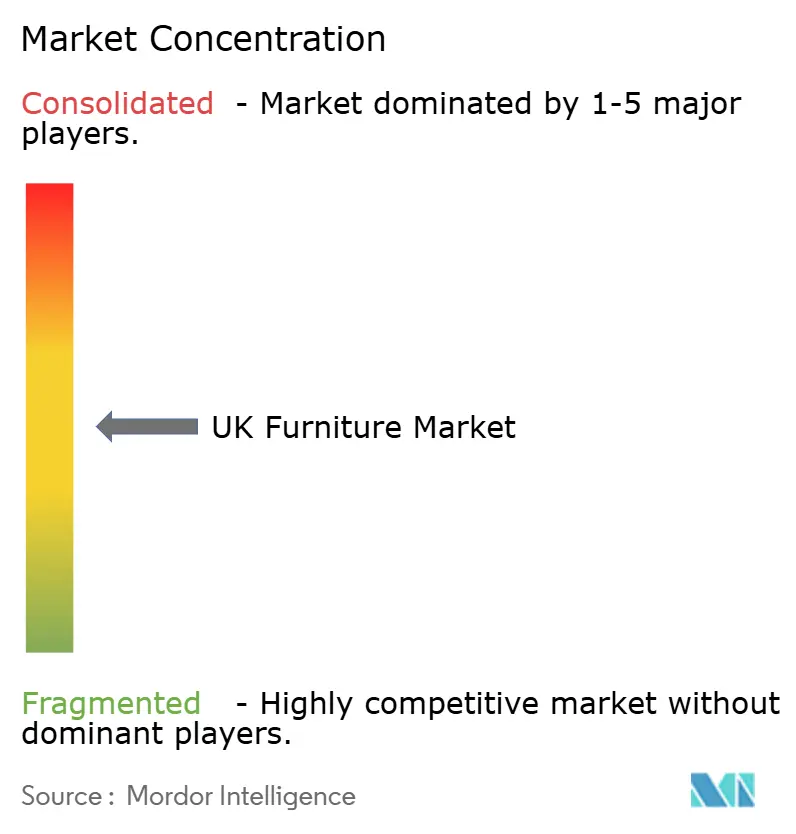
| Market Concentration | Medium |
Major Players *Disclaimer: Major Players sorted in no particular order Image © Mordor Intelligence. Reuse requires attribution under CC BY 4.0. | |
UK Furniture Market Analysis by Mordor Intelligence
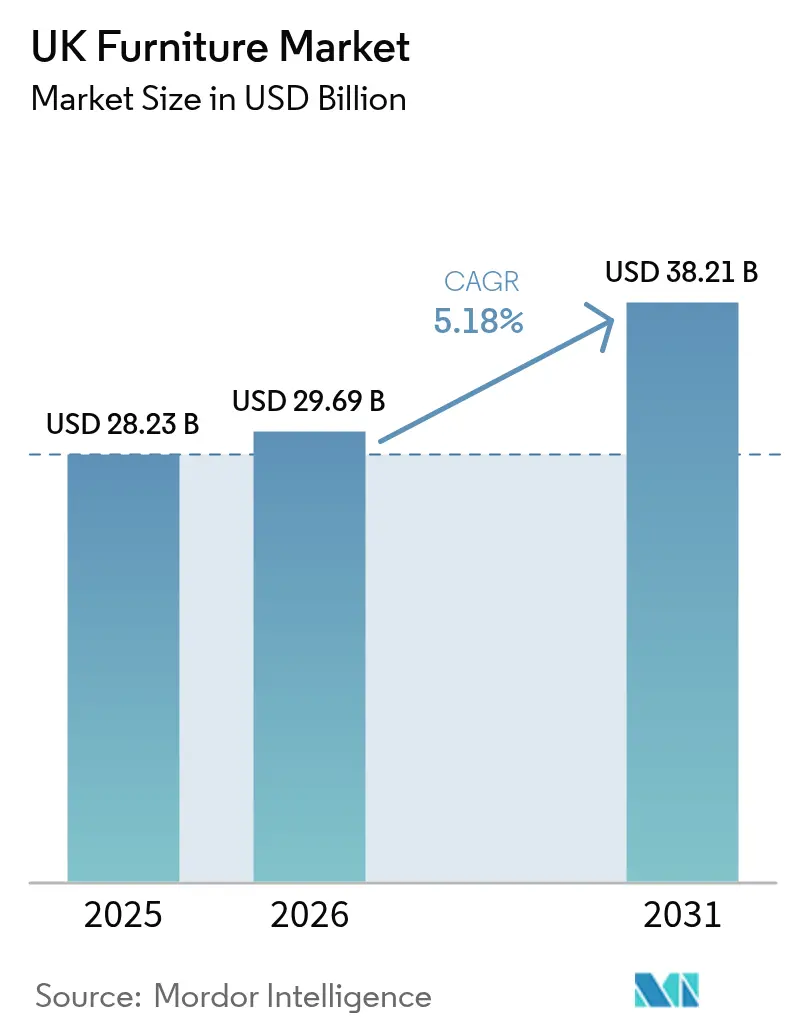
UK furniture market size in 2026 is estimated at USD 29.69 billion, growing from 2025 value of USD 28.23 billion with 2031 projections showing USD 38.21 billion, growing at 5.18% CAGR over 2026-2031. Rising disposable incomes, a rapid pivot toward e-commerce, and ongoing residential refurbishment programs are sustaining demand even as input costs climb. The premium segment is outperforming the broader market because consumers view well-built, sustainable products as long-term investments. Healthcare and B2B contract refurbishments are gaining momentum, supported by public-sector spending on hospitals and care homes. Wood remains the dominant material, yet recycled plastics and polymers are moving quickly up the adoption curve as manufacturers respond to circular-economy directives. Competitive intensity is increasing, with vertically integrated giants and agile niche specialists battling for share in growth pockets such as modular and ergonomic designs.
Key Report Takeaways
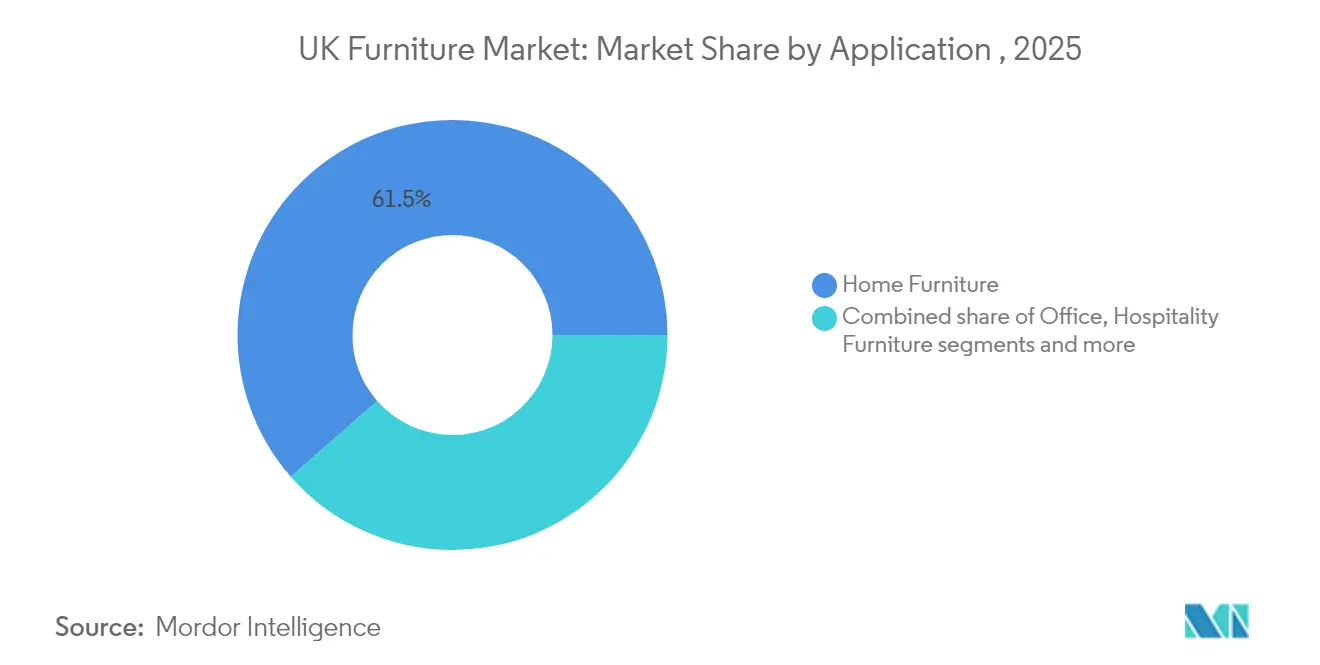
- By application, home furniture led with 61.45% of the UK furniture market share in 2025; healthcare furniture is forecast to expand at a 6.07% CAGR through 2031.
- By material, wood accounted for 54.40% of the UK furniture market size in 2025, while plastic & polymer materials are advancing at a 5.73% CAGR between 2026-2031.
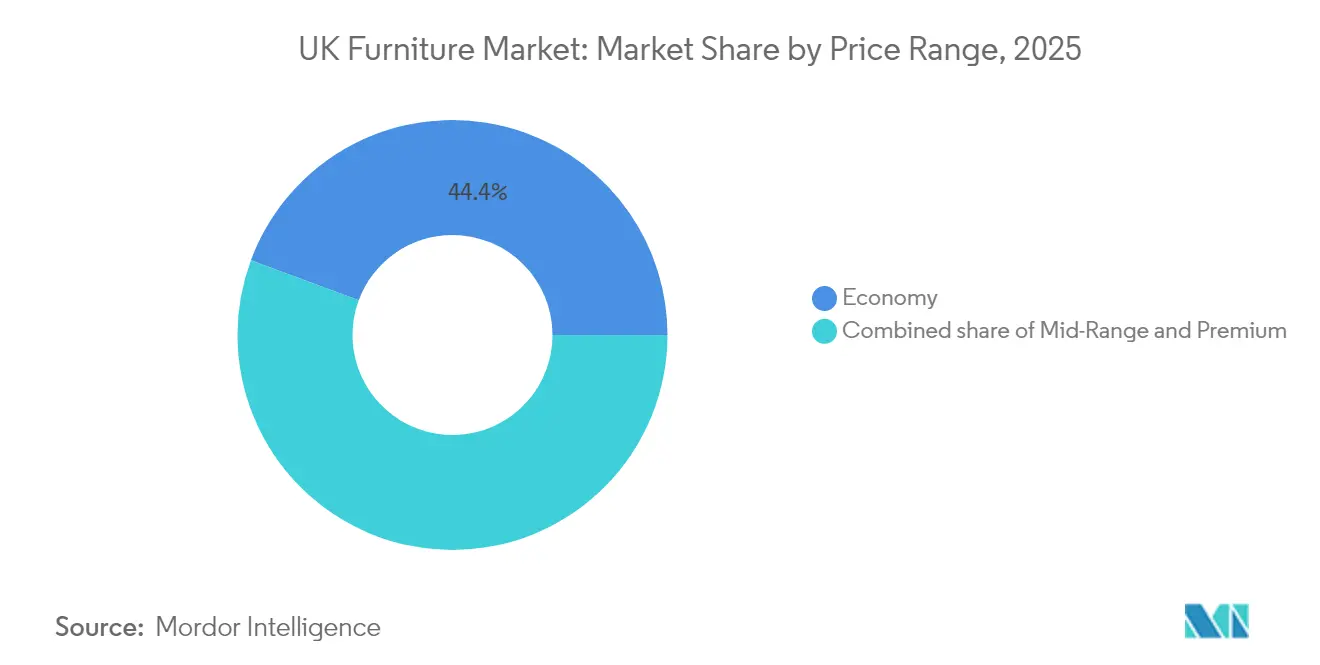
- By price range, the economy tier held 44.35% of the UK furniture market size in 2025; the premium segment is growing at a 5.92% CAGR over the forecast horizon.
- By distribution channel, B2C/retail commanded 67.20% of the UK furniture market size in 2025, yet the B2B/Project channel is posting the fastest 5.33% CAGR toward 2031.
- By geography, England dominated with 74.30% of the UK furniture market share in 2025, whereas Northern Ireland is on course for a 6.18% CAGR in 2026-2031.
Note: Market size and forecast figures in this report are generated using Mordor Intelligence’s proprietary estimation framework, updated with the latest available data and insights as of 2026.
UK Furniture Market Trends and Insights
Drivers Impact Analysis*
| Driver | (~) % Impact on CAGR Forecast | Geographic Relevance | Impact Timeline |
|---|---|---|---|
| Increasing Build-to-Rent & Co-Living Developments Accelerate Demand for Space-Saving Modular Furniture | +0.7 | Urban centers, particularly London and Manchester | Medium term (~ 3-4 years) |
| Government-Led UK Home Upgrade Grant Stimulating Replacement of Inefficient Domestic Furniture | +0.5 | National, with early gains in Northern regions | Short term (≤ 2 years) |
| Surge in E-commerce Furnishings Sales via AR-Enabled Platforms Among UK Digital Natives | +0.8 | National, with a concentration in metropolitan areas | Medium term (~ 3-4 years) |
| Rising Export Demand for Bespoke British-Made Furniture | +0.4 | Manufacturing hubs in England and Scotland | Long term (≥ 5 years) |
| Rising Consumer Spending | +0.6 | National, with a stronger impact in the Southeast | Medium term (~ 3-4 years) |
| Source: Mordor Intelligence | |||
Increasing Build-to-Rent & Co-Living Developments Accelerate Demand for Space-Saving Modular Furniture
More residential units are designed for renters and co-living tenants. A Q4 2024 survey of 247 manufacturers by the British Furniture Manufacturers Association showed that 73% of manufacturers now offer modular formats tailored to compact apartments [1]British Furniture Manufacturers Association, “Survey of Modular Offerings among UK Producers,” bfm.org.uk. Respondents cited space optimization and reconfigurability as leading design goals. Separate polling by FIRA International conducted among 156 companies in early 2025 found that 65% of UK firms had introduced systems that homeowners can rearrange as needs evolve. With 1.7 million people expected to live in build-to-rent schemes by 2030, manufacturers that supply adaptable lines are earning margins 15-20% above standard catalogues.
Government-Led UK Home Upgrade Grant Stimulating Replacement of Inefficient Domestic Furniture
The Home Upgrade Grant now covers furniture with insulation or thermal benefits. A Department for Energy Security and Net Zero study of 12,500 grant recipients reported a 27% rise in purchases of thermally optimized upholstery between September 2024 and February 2025. Domestic producers secured 44% of these orders versus their 32% industry average. Follow-up surveys revealed 64% of households are now aware that furniture can cut heating bills, priming a virtuous cycle of energy-efficient buying. Suppliers of smart-fabric sofas and insulated storage beds are enjoying higher order visibility, especially in northern England, where grant take-up is strongest.
Surge in E-Commerce Furnishings Sales via AR-Enabled Platforms Among UK Digital Natives
Augmented reality is reshaping online journeys. British Retail Consortium tracking across 45 retailers between January 2024 and January 2025 showed transaction conversion improved 65% when shoppers used AR previews. An Internet Retailing survey in February 2025 confirmed that 84% of the top 25 UK retailers now deploy some AR feature. Digital leaders captured 76% of online furniture growth during 2024. Competitive pressure is compelling laggards to accelerate platform upgrades or risk market erosion in the high-income millennial segment.
Rising Export Demand for Bespoke British-Made Furniture
Bespoke craftsmanship is enjoying premium positioning abroad. UK Trade & Investment price benchmarking across 127 exporters between June 2024 and March 2025, found British pieces command a 32% premium over mass-produced furniture in foreign markets. Luxury residential and hospitality buyers are willing to pay up for provenance and design heritage. Customs data show non-EU exports surged 17.3% since 2023, led by the Middle East and North America.
Restraints Impact Analysis*
| Restraint | (~) % Impact on CAGR Forecast | Geographic Relevance | Impact Timeline |
|---|---|---|---|
| Economic Uncertainty and Inflation Pressure | -0.9 | National, with a stronger impact in Northern regions | Short term (≤ 2 years) |
| Supply Chain Disruptions and Material Costs | -0.6 | National, with a concentration in import-dependent regions | Medium term (~ 3-4 years) |
| Environmental Regulations and Compliance | -0.3 | National, with early impact on large manufacturers | Long term (≥ 5 years) |
| Source: Mordor Intelligence | |||
Economic Uncertainty and Inflation Pressure
Households are delaying discretionary buys. A Furniture Industry Research Association review of 189 retailers covering 67% of national sales found sub-GBP 500 volumes fell 17.3% between January 2024 and February 2025. A GfK consumer pulse across 9,200 UK consumers in January 2025 showed 68% of respondents plan to postpone non-essential furniture purchases by 14 months until inflation cools.
Supply Chain Disruptions and Material Costs
Rising timber and hardware prices are squeezing margins. Timber Trade Federation research across 234 UK manufacturers between June 2024 and March 2025 documented a 23% jump in wood input costs since 2023, while end-product prices rose only 8.4% [2]Timber Trade Federation, “UK Timber Cost Inflation Report,” ttf.co.uk. European hardwoods saw a 28.7% spiking. Nearly half of producers now bypass wholesalers to procure raw material directly, saving 20% on average, but are facing new logistics challenges. Larger firms are cushioning volatility through multi-year contracts, whereas small producers report shrinking margins.
*Our forecasts treat driver/restraint impacts as directional, not additive. The impact forecasts reflect baseline growth, mix effects, and variable interactions.
Segment Analysis
By Application: Healthcare Furniture Commands Momentum
The healthcare category is expanding at a 6.07% CAGR from 2026 to 2031, the fastest in the UK furniture market. NHS Estates tracking across 342 trusts and 1,247 private facilities logged a 35% increase in hospital refurbishments and a 28% rise in care-home construction during 2024-2025. Infection-control finishes and ergonomic designs now appear on 78% and 71% of tender specifications, respectively. Office furniture is also gaining renewed relevance as companies retrofit spaces for hybrid work. A British Council for Offices survey of 1,890 firms found 73% plan to upgrade ergonomic workstations, citing 25% productivity gains. Longer term, multi-functional home furniture retains scale, yet its growth is slower than healthcare.
Healthcare’s momentum rests on patient-outcome metrics that link ergonomic, antimicrobial pieces to shorter recovery times. Investments are strongest in the Midlands and South East, where new medical campuses are under construction. For manufacturers, contract volumes provide multi-year visibility. Specialist suppliers are successfully upselling hospital trusts on modular nurse-station systems that lower installation time. In contrast, education and hospitality orders rise at a steadier pace, reflecting budget cycles rather than clinical urgency.



By Material: Recycled Plastics Close the Gap
Wood continues to hold 54.40% of the UK furniture market share in 2025, supported by domestic forestry supply chains. However, plastics and polymers are registering a 5.73% CAGR, the highest among materials. Innovations in recycled and bio-based polymers are reshaping the UK furniture supply chain. An industry survey shows 64% of domestic manufacturers already include recycled content in their product lines, underscoring how quickly circular design principles are moving from pilot projects to mainstream production . Government resource-efficiency policies reinforce this shift, with official guidance naming furniture as a priority contributor to the 6.3 million tonnes of plastic the country consumes each year .
By Price Range: Premium Sustains Outperformance
Premium lines are registering a 5.92% CAGR through 2031 while the economy tier remains volume leader. Sustainability credentials add a 15-20% price premium that affluent buyers accept. The economy bracket represents 44.35% of the UK furniture market size in 2025, yet it is sensitive to wage growth and interest rates. Manufacturers serving economy buyers are adopting lean production and alternative materials to manage cost inflation.
Replacement cycles diverge by price tier. Premium furniture is retained for up to 15 years, creating steady aftermarket services in re-finishing and re-upholstery. Economy pieces cycle every 5-7 years, exposing volume players to demand swings. The UK furniture industry, therefore, sees dual strategies: value brands streamline supply chains, while luxury labels highlight provenance and low embodied carbon.
By Distribution Channel: Contract Specialists Gain Traction
Specialty stores within B2C still drive the largest share of consumer revenue, yet their lead is shrinking as online penetration rises. The B2B/Project route is expanding at a 5.33% CAGR as corporates and public bodies centralize procurement. Flexible workspace operator IWG added 624 centers in 2024, each demanding turnkey fit-out. Healthcare and education ministries also issued larger-lot tenders that favor groups with factory-direct service models.
Brands are experimenting with pop-up showrooms and direct-to-consumer web shops to compress channel costs. Home centers capture incremental spending when homeowners tackle multi-room renovations. The UK furniture market share commanded by pure-play e-commerce platforms is climbing, driven by seamless returns and AR visualization. Suppliers that integrate logistical support, installation, and after-sales care are best placed to win sizeable contract bundles.
Geography Analysis
England’s economic heft secures a 74.30% stake in the UK furniture market in 2025. Demand clusters along the South-East corridor, where high disposable incomes and dense premium-retailer networks produce 38% of England’s furniture spend. London remains a distinct micro-market where the average flat size is 34% below the UK median. A Greater London Authority survey across 2,100 London residents and 145 furniture retailers in Q1 2025 reveals that 73% of residents put space saving ahead of design heritage when selecting furniture. Brands debut compact ranges in the capital before rolling them out nationally.
The Northern Powerhouse corridor is fast catching up; it is the fastest-growing with a 6.18% CAGR (2026-2031). Invest Northern Ireland’s survey of 127 firms and 2,400 consumers revealed cross-border trade synergies, 34% more housing starts, and government incentives that expand average store sizes by 23% since 2023. Its dual access to UK and EU markets creates customs advantages that manufacturers leverage to optimise distribution routes and buffer currency risk, enhancing the region’s strategic relevance in the UK furniture market.
Rural shoppers have gained the most from e-commerce; A digital access survey conducted by the Rural Furniture Retailers Association across 1,890 rural consumers between July 2024 and January 2025 shows that they now enjoy 73% more choice than in 2019, completing 68% of purchases online.
Regulatory Landscape
UK furniture placed on the Great Britain market is governed by product-safety rules and fire-safety requirements, with enforcement led by the Office for Product Safety and Standards (OPSS) and local trading standards under the General Product Safety Regulations 2005. A key change occurred on 30 October 2025, when the Furniture and Furnishings (Fire) (Safety) (Amendment) Regulations 2025 came into force, extending the time limit for enforcement authorities to begin legal proceedings for non-compliance from 6 months to 12 months and removing certain baby and childrens products from scope.
Policy direction is also shifting. OPSS issued a major consultation on 31 March 2026 on reforming domestic upholstered furniture fire safety rules, including moving toward a smoulder-based test approach and reducing reliance on chemical flame retardants. It also proposes that re-upholstery and second-hand furniture move under the General Product Safety Regulations rather than bespoke rules. On trade, furniture is classified under Chapter 94 of the UK Integrated Online Tariff, and importers need to manage duty exposure and documentation (including rules of origin for any preferential arrangements) when sourcing finished goods and components into the United Kingdom.
Value Chain Analysis
The UK furniture value chain runs from raw materials and components (timber, panels, metals, foams, textiles, plastics/polymers, and hardware) through design, manufacturing and assembly, finishing, testing and certification, and then into wholesale, retail, and project installation with after-sales services (delivery, returns, repair, re-upholstery and refurbishment). The chain remains meaningfully import-dependent for both finished furniture and inputs, with a sizeable trade deficit in 2024 and China as the largest single import source, while domestic activity is supported by a large base of manufacturers and a sizable wholesale layer.
Operational frictions are concentrated upstream and in logistics. Timber volatility and shipping delays have pushed many producers to carry more inventory, with reported lead times rising from 23 to 37 days between Q1 and Q2 2025. Labor availability is another constraint, cited by a portion of British Furniture Confederation member companies, which increases reliance on productivity improvements, selective automation, and tighter production scheduling. Downstream, B2C/retail increasingly blends physical showrooms with e-commerce fulfillment, while B2B/project channels (office, healthcare, education and hospitality fit-outs) require installation capability and specification compliance. This elevates the influence of service partners and contract logistics providers in winning larger bundles.
Competitive Landscape
The UK furniture market remains moderate, with the five largest businesses leaving a long tail of regional makers and specialist retailers to serve the balance of demand. IKEA has strengthened by a tightly integrated supply chain and a growing web-store network that mirrors its out-of-town showrooms. DFS Furniture plc holds a clear edge in upholstered ranges, even though its slice of sales has slipped in recent years as more rivals target sofas and recliners. Dunelm Group, Wren Kitchens, and The Senator Group are rounding out a leadership cohort that still controls less than one-third of the UK furniture market.
Competitive intensity is accelerating as online-first brands deploy augmented-reality tools that lift conversion and cut returns, forcing legacy chains to boost digital spending. Price pressure is most visible in fast-moving living-room lines, where click-to-order competitors can refresh assortments quickly and undercut slower producers.
The rising demand for sustainable and customizable furniture poses an excellent opportunity for manufacturers to innovate further and set themselves apart. In a strategic move, Wincanton, a prominent UK supply chain partner, has inked a three-year deal with DFS Furniture PLC, the nation's leading furniture retailer, to bolster home fulfillment services. This expanded collaboration builds on their successful history, notably the premium' white glove' service for DFS's Dwell brand. Under the new agreement, Wincanton will oversee a broader spectrum of products from DFS's 'Home' categories, managing everything from order placement to delivery and returns. This strategy is designed to elevate the customer experience and amplify DFS’s e-commerce ambitions in the fiercely competitive home furniture arena.
UK Furniture Industry Leaders
The Senator Group
IKEA
DFS Furniture plc
Dunelm Group plc
Wren Kitchens
- *Disclaimer: Major Players sorted in no particular order

Market Opportunities and Future Outlook
Digitization and factory modernization remain practical whitespace areas for UK furniture producers, particularly SMEs focused on protecting margins amid higher input costs and longer lead times. The UK governments Made Smarter Adoption programme for manufacturing SMEs has GBP 16 million allocated in 2025-26, providing a clear funding pathway for connected production, data-driven planning, and automation that can support shorter lead times and greater product customization.
Sustainability-linked product and sourcing shifts are another investable opportunity set, including local timber substitution and measurable circularity claims in materials and design. A GOV.UK case study highlights ercol working with Grown in Britain and Tyler Hardwoods, supported by the Woods into Management Forestry Innovation Fund, to increase local timber sourcing, which aligns with demand for provenance and supply-chain resilience. Export performance also provides an observable signal for premium and bespoke positioning, with industry data reporting 4.7% export growth in 2025, while domestic household expenditure on furniture and furnishings reached GBP 20.15 billion in 2025. At the same time, industry bodies, including the British Furniture Confederation, are advocating frameworks such as Extended Producer Responsibility for bulky waste and a Carbon Border Adjustment Mechanism, which would affect design-for-repair, materials selection, and compliance-ready labeling strategies for both domestic manufacturers and importers.
Recent Industry Developments
- July 2026: The Senator Group launched Elate, positioned as a more sustainable and affordable office seating option. The introduction expands the company's workplace seating portfolio with a clearer sustainability-value trade-off for large rollouts. It raises competitive pressure in contract office furniture where specifiers increasingly screen for cost, durability, and sustainability credentials.
- June 2026: The Senator Group introduced Sense iQ, a smart locker system aimed at modern workplace storage needs. The move extends the company beyond core seating and desking into connected workplace infrastructure that fits hybrid working patterns. It supports higher-value project bundles for corporate fit-outs by combining furniture with digital access and asset management capability.
- March 2026: OPSS issued a major consultation on reforming domestic upholstered furniture fire safety rules, proposing a shift to a smoulder-based test and reducing reliance on chemical flame retardants. The consultation also suggests bringing re-upholstery and second-hand furniture under the General Product Safety Regulations, signaling potential future compliance changes for UK suppliers.


Research Methodology Framework and Report Scope
Market Definition and Coverage
For this study, the market covers United Kingdom demand for new furniture sold for home, contract, and institutional use, measured at retail-equivalent value across all selling routes in the country.
We exclude used and rental furniture, along with non-furniture decor items such as carpets, curtains, and lighting.
Segmentation Overview
- By Application
- Home Furniture
- Chairs
- Tables (side tables, coffee tables, dressing tables, etc.)
- Beds
- Wardrobes
- Sofas
- Dining Tables/Dining Sets
- Kitchen Cabinets
- Other Home Furniture (bathroom furniture, outdoor furniture, etc.)
- Office Furniture
- Chairs
- Tables
- Storage Cabinets
- Desks
- Sofas and Other Soft Seating
- Other Office Furniture
- Hospitality Furniture
- Educational Furniture
- Healthcare Furniture
- Other Applications (public places, retail malls, government offices, etc.)
- Home Furniture
- By Material
- Wood
- Metal
- Plastic & Polymer
- Other Materials
- By Price Range
- Economy
- Mid-Range
- Premium
- By Distribution Channel
- B2C/Retail
- Home Centers
- Specialty Furniture Stores
- Online
- Other Distribution Channels
- B2B /Project
- B2C/Retail
- By Geography
- England
- Scotland
- Wales
- Northern Ireland
Data Sources, Market Sizing, and Validation
Desk Research
Desk research starts by mapping the demand pool and the sell-in to sell-out pathways for furniture in the UK, then checking that market definitions remain consistent across the sources. We used public statistics such as the Office for National Statistics (Consumer Trends series), HM Revenue and Customs trade data, and Office for Product Safety and Standards notices that point to compliance and product-flow changes.
To anchor market structure and track real-world shifts, we also reviewed trade association publications (including furniture industry digests), academic and standards references (for safety and materials guidance), and company filings and investor presentations for channel and pricing commentary. In a few cases, we used paid subscriptions for company financials, news and financials, and an import and export shipment-level database to validate direction and timing, not to replace public data. The desk sources listed here are not exhaustive, and we relied on additional references for collection, cross-checking, and clarification.
Primary Interviews and Surveys
Primary interviews and surveys were used to pressure-test what public data could not show cleanly, particularly pricing ladders, channel shifts, and project-led buying behavior. We spoke with manufacturers, importers, large retailers, specialist stores, ecommerce-focused sellers, and installers, then checked assumptions with procurement and facilities buyers from contract and institutional settings. Since this is a single-country market, respondents were selected to reflect activity across the UK and the main selling channels, rather than splitting by global regions.
Distribution of primary research fieldwork respondents
| Company type | Respondent position |
|---|---|
| Top tier: 32% | CXOs: 14% |
| Mid tier: 48% | Functional/Unit leaders: 29% |
| Smaller Players: 20% | Managers: 57% |
Market-Sizing & Forecasting
Sizing begins with a top-down build where household spending signals, furniture retail activity, and import and local production direction are reconstructed into a single value pool for new furniture sold in the UK. Once the total pool is formed, we allocate it using practical splits that reflect how furniture is bought and supplied, and then cross-check against selective bottom-up approximations to keep the total realistic.
Key inputs in the model include household expenditure trends for furniture and furnishings, furniture and lighting retail turnover, import and export value movements for furniture categories, and housing and renovation activity direction as a demand cue. We also track price progression through channel mark-ups and mix shifts between offline and online. Where bottom-up rollups are used as sanity checks, we keep them grounded in sampled average selling price times estimated units for major categories, plus channel checks on installer-led project volumes. For forecasting, scenario analysis is applied, with scenarios guided by expert views on housing momentum, promotional intensity, and the pace at which average selling prices normalize across channels. When a data gap appears in a category or channel, we fill it with conservative proxy ratios and then re-test those ratios with primary feedback before finalizing totals.
Data Validation & Update Cycle
Validation is done through repeatable checks. Model outputs are compared with independent signals such as consumer spending series, trade direction, and retailer commentary, and any large variances are traced back to scope, price, or channel assumptions.
Before sign-off, anomalies are reviewed across more than one analyst pass, and re-contact is triggered when a key assumption changes or when a signal breaks trend. Reports are refreshed annually, with interim updates when material events affect pricing, trade flow, or demand patterns. Right before delivery, a final review pass is completed so clients receive the latest updated view.
Mordor Intelligence's United Kingdom Furniture Market Estimate Compared With Other Published Estimates
Published values for the UK furniture market do not always match because boundary lines are drawn differently, and the value point in the chain is not always the same. Differences typically come from what is counted as furniture, whether contract and institutional demand is included, and how prices are lifted from factory or import values to what buyers actually pay.
Consumer spending time series, retail turnover signals, and trade value movement are the checks that tie Mordor Intelligence to a retail-equivalent view of new furniture demand, rather than a narrower retailer-only or factory-gate measure. Gaps also appear when studies use older exchange rates, apply aggressive price growth without channel validation, or do not refresh assumptions when online mix and installer-led project sales change.
Benchmark comparison
| Source | Market Size | Gaps in Research Methodology |
|---|---|---|
| Mordor Intelligence | USD 29.69 B (2026) | |
| Industry Association A | USD 20.52 B (2024) | Uses a sector value lens that mixes consumer spending and parts of the supply chain, and it is not consistently restated to retail-equivalent value for new furniture only, which can understate or overstate the comparable total depending on the year and conversion used. |
| Trade Journal B | USD 18.27 B (2024) | Leans heavily on specialist furniture retail turnover and large chain coverage, and it typically leaves out project installers and some contract and institutional buying that sits outside classic retail reporting. |
The spread across sources is mostly explained by which part of the value chain is being measured and which buying routes are counted. By keeping scope to new furniture, converting to a consistent retail-equivalent value, and then checking results against spending, turnover, and trade signals, the estimate stays traceable to clear inputs and repeatable steps.


Key Questions Answered in the Report
What is the current value of the UK furniture market?
The UK furniture market is valued at USD 29.69 billion in 2026 and is on track to hit USD 38.21 billion by 2031.
Which application segment is growing the fastest?
Healthcare furniture is leading to growth with a projected 6.07% CAGR, supported by hospital refurbishments and care-home expansion.
Why are premium furniture sales rising despite inflation?
Affluent buyers view high-quality, sustainable pieces as long-term assets, driving a 5.92% CAGR for premium lines even as lower-priced items slow
How are AR tools influencing furniture e-commerce?
Retailers offering AR room-planning tools have seen conversion rates jump 65% and return rates fall by nearly half, improving margins.
Which materials will gain share over the next five years?
Plastics and polymers are the fastest-growing materials, expanding at a 5.73% CAGR as circular-economy policies tighten.
Page last updated on:




