Market Overview
| Study Period | 2020 - 2031 |
|---|---|
| Forecast Data Period | 2026 - 2031 |
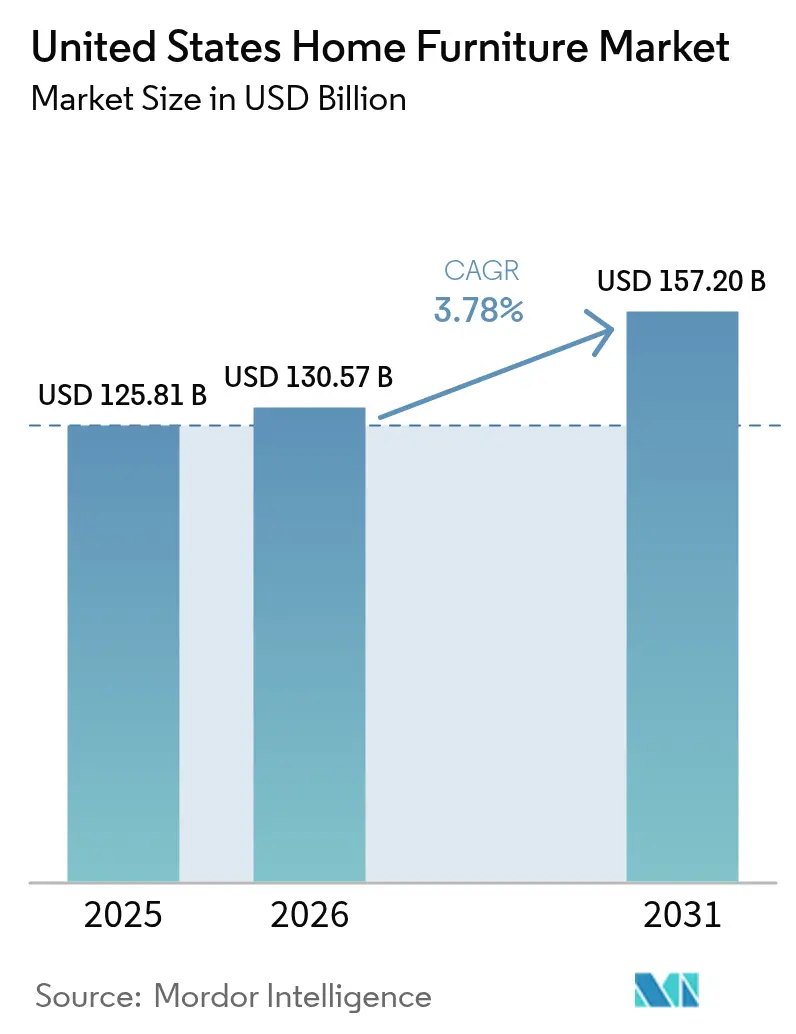
| Base Year Market Size (2025) | USD 125.81 Billion |
| Market Size (2026) | USD 130.57 Billion |
| Market Size (2031) | USD 157.2 Billion |
| Growth Rate (2026 - 2031) | 3.78% CAGR |
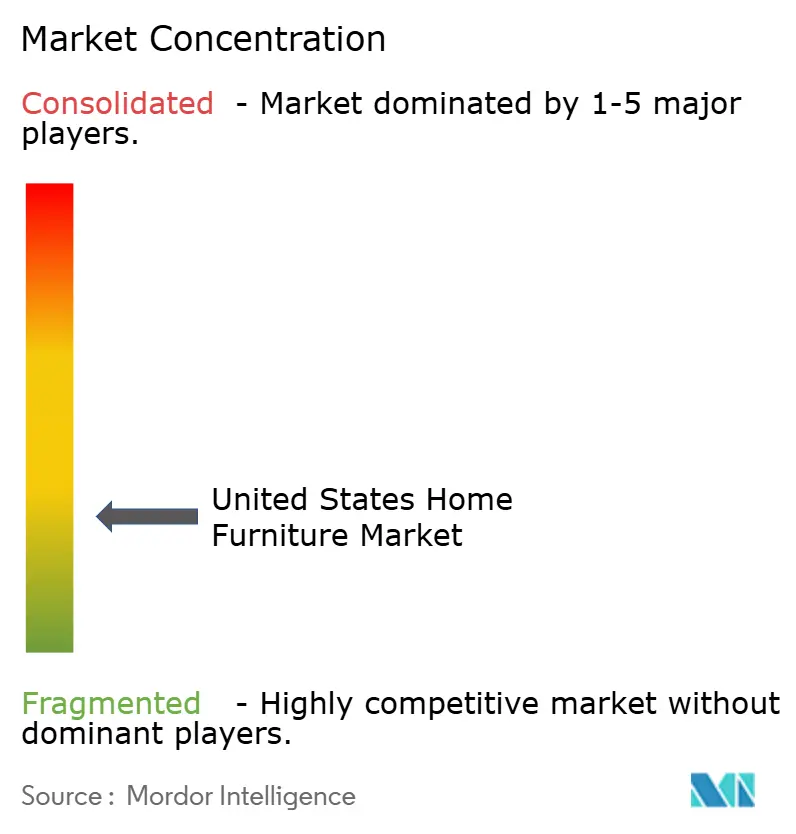
| Market Concentration | Low |
Major Players *Disclaimer: Major Players sorted in no particular order Image © Mordor Intelligence. Reuse requires attribution under CC BY 4.0. | |
United States Home Furniture Market Analysis by Mordor Intelligence
The US home furniture market size was valued at USD 125.81 billion in 2025 and estimated to grow from USD 130.57 billion in 2026 to reach USD 157.2 billion by 2031, at a CAGR of 3.78% during the forecast period (2026-2031). Growth rests on immigration-driven household formation, a remodeling boom, and rising demand for multi-functional furnishings that fit compact urban layouts. Housing turnover remains muted because mortgage rates stay elevated, encouraging owners to remodel and replace furniture instead of relocating. The US home furniture market benefits from sustained federal and state sustainability incentives that favor certified wooden products. Import competition and freight volatility continue to challenge margins even as supply-chain automation lowers production cost for leading manufacturers.
Key Report Takeaways
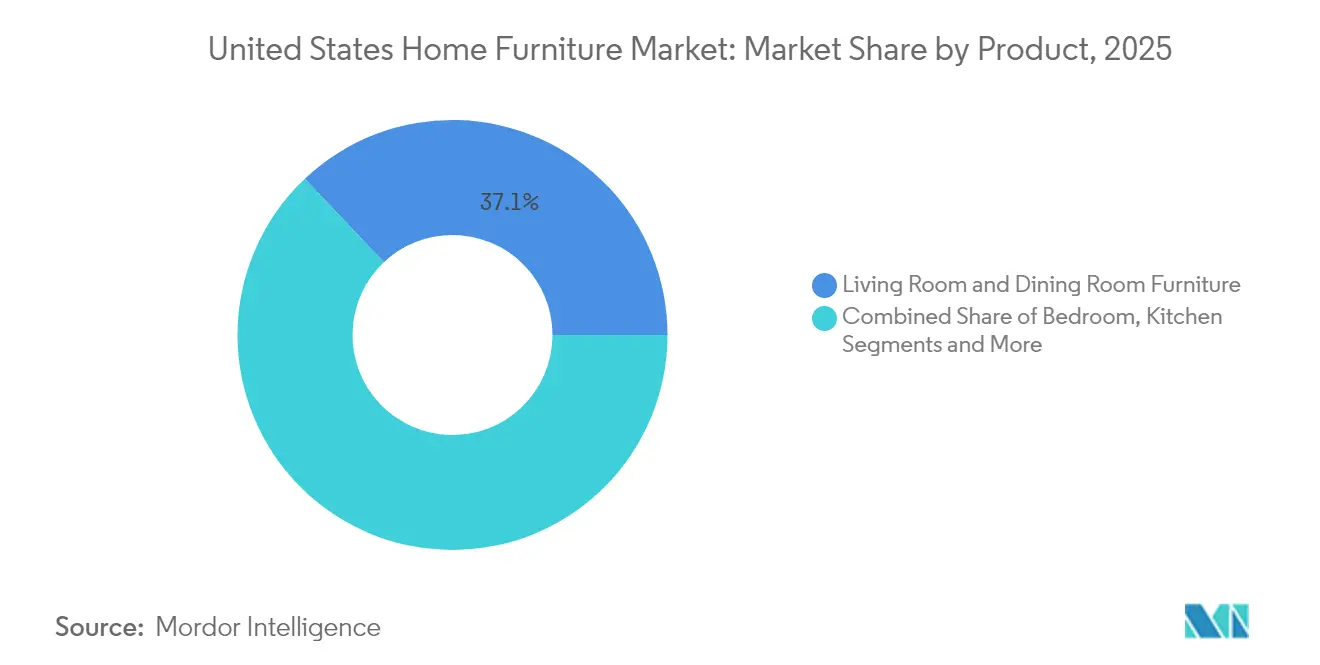
- By product category, Living Room and Dining Room Furniture led with a 37.05% share of the US home furniture market in 2025; Bedroom Furniture is projected to expand at a 4.11% CAGR through 2031.
- By material, Wood captured 62.10% of the US home furniture market size in 2025, while the Plastic & Polymer segment is set to grow at a 4.6% CAGR to 2031.
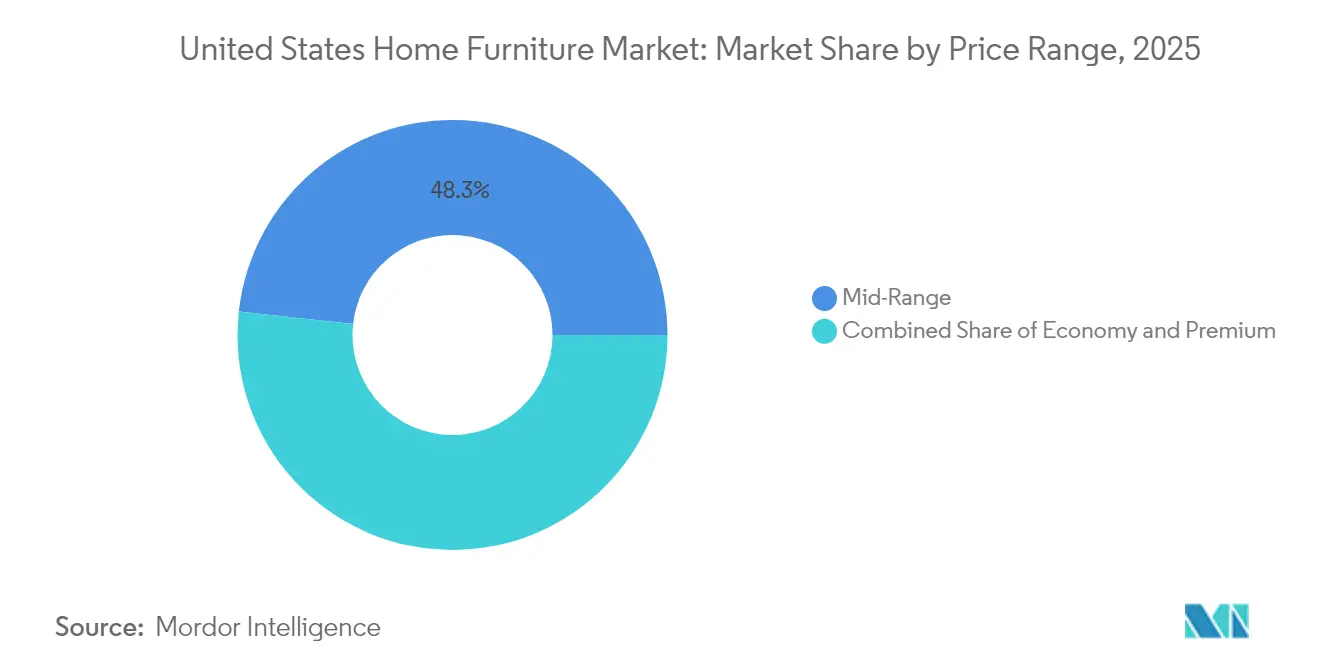
- By price range, Mid-Range offerings held 48.25% of the US home furniture market share in 2025; Premium products are forecast to post a 4.96% CAGR to 2031.
- By distribution channel, Specialty Stores accounted for 74.85% revenue share in 2025; Online retail is advancing at a 6.4% CAGR through 2031.
- By geography, the West commanded 27.05% of regional sales in 2025, while the Southwest is on track for a 5.18% CAGR to 2031.
Note: Market size and forecast figures in this report are generated using Mordor Intelligence’s proprietary estimation framework, updated with the latest available data and insights as of 2026.
United States Home Furniture Market Trends and Insights
Drivers Impact Analysis*
| Driver | (~) % Impact on CAGR Forecast | Geographic Relevance | Impact Timeline |
|---|---|---|---|
| Improved Condo Affordability Spurs Demand for Modular, Multi-Functional Furniture | +0.8% | West Coast metros, Northeast urban cores | Medium term (2-4 years) |
| Rising Home-Renovation Spending | +1.2% | National, with concentration in high-income metros | Short term (≤ 2 years) |
| Rapid Growth of D2C Online Furniture Start-Ups with Free-Return Logistics | +0.6% | National, urban-centric adoption | Medium term (2-4 years) |
| Immigration-Led Household Formation Increasing First-Time Furniture Purchases | +0.9% | Gateway cities, Sunbelt expansion markets | Long term (≥ 4 years) |
| Federal/Provincial Sustainability Rebates Accelerating Uptake of Eco-Certified Wooden Products | +0.4% | California, Northeast states with green incentives | Long term (≥ 4 years) |
| AI-powered AR/VR visualization tools boosting conversion | +0.3% | Tech-forward metros, younger demographic clusters | Medium term (2-4 years) |
| Source: Mordor Intelligence | |||
Improved Condo Affordability Spurs Demand for Modular, Multi-Functional Furniture
Condominium price corrections in several coastal markets enable first-time buyers to enter homeownership sooner. These smaller units require versatile furniture, and buyers spend 23% more on space-saving products than single-family counterparts[1]Source: National Association of Home Builders, “2024 Home Buyer Spending Patterns,” nahb.org . Millennials favor sectional sofas that separate into configurable pieces, fueling sectional demand across living-room lines. Manufacturers now bundle storage ottomans and convertible tables that shift from work to dining use within minutes. The US home furniture market gains incremental revenue as condo buyers furnish entire units in compressed purchasing windows.
Rising Home-Renovation Spending
Americans spent USD 603 billion on remodeling in 2024, and outlays are slated to reach USD 509 billion in 2025 despite tighter credit. Kitchen projects averaging USD 35,000 and bathroom remodels near USD 17,000 lead to coordinated furniture upgrades that complement new finishes. Elevated mortgage rates lock many owners into existing homes, multiplying renovation cycles across longer ownership periods. Baby Boomers account for the majority of projects and prioritize age-friendly furniture designs. Premium cabinets and dining pieces that match renovated interiors raise average selling prices in the US home furniture market.
Rapid Growth of D2C Online Furniture Start-Ups with Free-Return Logistics
Online furniture sales reached 29% of all home-improvement spend in 2024 as D2C brands removed risk through free returns and AR visualization tools. Eighty percent of shoppers say confidence rises when they can preview scale and color in augmented reality experiences. Subscription and rental models gain urban traction, offering flexibility for transient renters while generating recurring revenue for brands. Data-driven inventory planning shortens delivery times and minimizes stock-outs. The US home furniture market thus shifts toward omnichannel ecosystems that merge digital engagement with physical servicing.
Immigration-Led Household Formation Increasing First-Time Purchases
Net international migration added 6 million residents between 2021 and 2024, and recent arrivals show a 30% household-formation rate. More than 1 million new households will fully furnish homes over the next five years, favoring entry-level sets initially and premium upgrades later. Sunbelt metros capture much of this demand thanks to employment growth and affordable housing. Cultural preferences for large dining sets and multi-generational layouts expand category breadth. The US home furniture market thereby secures a durable volume pipeline independent of domestic birth trends.
Restraints Impact Analysis*
| Restraint | (~) % Impact on CAGR Forecast | Geographic Relevance | Impact Timeline |
|---|---|---|---|
| Interest-Rate-Driven Housing-Market Slowdown Dampening Big-Ticket Furniture Sales | -1.1% | National, acute in high-cost coastal markets | Short term (≤ 2 years) |
| Persistent Freight & Port Delays Lengthening Delivery Lead-Times | -0.7% | Import-dependent regions, West Coast ports | Medium term (2-4 years) |
| US Import Price Competition Under USMCA Squeezing Domestic Margins | -0.6% | Manufacturing-heavy regions, North Carolina, Southeast | Long term (≥ 4 years) |
| Rising import penetration despite Section 301 tariffs | -0.8% | National, concentrated in wood furniture segments | Medium term (2-4 years) |
| Source: Mordor Intelligence | |||
Interest-Rate-Driven Housing-Market Slowdown Dampening Big-Ticket Sales
Existing-home transactions are projected to decline by 4.3% year-on-year in early 2025, reducing furniture purchases typically associated with home moves. Mortgage rates exceeding 6% are expected to deter budget-conscious buyers, impacting demand for complete bedroom and dining sets. Consumer confidence has reached decade lows, prompting households to delay discretionary upgrades. While retailers offer promotional financing to mitigate high prices, tighter credit standards have lowered acceptance rates. The US home furniture market faces a mixed scenario, with renovation-driven orders partially offsetting the decline in transaction-related demand.
Persistent Freight & Port Delays Lengthening Delivery Lead Times
Container rates fell from 2021 peaks yet remain double pre-pandemic norms, and port congestion keeps delivery windows at 12–16 weeks for many import-heavy categories[2]Source: Home Furnishings Association, “Global Logistics Challenges Continue,” myhfa.org . Customers faced with prolonged waits pivot toward alternatives, in stock alternatives or delaying purchases, eroding conversion rates. Retailers invest in higher inventory buffers, increasing working-capital needs and warehousing costs. Domestic manufacturers scramble to source components locally or nearshore to Mexico in search of reliability. The US home furniture market shoulders incremental logistics expense that squeezes margins unless they pass through to price.
*Our forecasts treat driver/restraint impacts as directional, not additive. The impact forecasts reflect baseline growth, mix effects, and variable interactions.
Segment Analysis
By Product: Versatile Living-Space Lines Anchor Sales
Living Room and Dining Room Furniture accounted for 37.05% of the US home furniture market share in 2025, underscoring the central role of communal spaces. Open-concept designs encourage coordinated sectional seating, media consoles, and dining sets that deliver visual continuity across connected zones. Manufacturers integrate stain-resistant fabrics and modular footprints to meet lifestyle demands for flexibility and easy maintenance. Bedroom Furniture posts the fastest growth at a 4.11% CAGR as consumers upgrade mattresses, nightstands, and wardrobes that now double as remote-work backdrops. Sleep-wellness awareness fuels premium mattress pairs bundled with adjustable bases and tech-enabled headboards.
Living-room dominance persists because streaming entertainment keeps households at home more often, driving replacement cycles for sofas and recliners subjected to daily use. Dining categories regain momentum after pandemic disruptions as consumers resume in-home gatherings. Bedroom spending benefits from bundled financing that allows shoppers to complete suites rather than purchase piecemeal. Emerging niches such as convertible vanity-desk hybrids tap the work-from-home trend without sacrificing floor space. Across categories, the US home furniture market favors designs that pivot smoothly between leisure, dining, and professional needs.


By Material: Wood Retains Prestige Amid Polymer Advances
Wood secured 62.10% of 2025 revenue thanks to tactile warmth, renewable sourcing, and favorable carbon narratives verified under FSC protocols. Solid-oak dining tables and walnut bedroom frames anchor premium lines aimed at buyers seeking heirloom durability. Plastic & Polymer pieces are growing at a 4.6% CAGR as recycled composites and bio-based resins shed historical stigma around perceived flimsiness. Injection molding now produces sleek silhouettes impossible with traditional joinery, opening mid-century design reinterpretations at accessible prices. Metal lines hold steady by capitalizing on loft aesthetics and outdoor durability.
Supply-chain shocks spur interest in domestic hardwoods, reducing dependency on volatile Asian plywood flows. Consumer education campaigns by the Sustainable Furnishings Council elevate awareness of low-VOC finishes and formaldehyde limits. Polymer innovators tout closed-loop recyclability, aligning with rising Gen Z eco-values. Hybrid constructions mix wood veneers with polymer cores, cutting cost without undermining surface authenticity. Material choices hence diversify while wood continues anchoring brand narratives around craftsmanship within the US home furniture market size.
By Price Range: Premiumization Gains Momentum
Mid-Range collections captured 48.25% of sales in 2025, balancing value engineering and tasteful design for mainstream households. Inflation fatigue nudges discerning shoppers toward Premium tiers that promise longevity, and this segment is advancing at a 4.96% CAGR through 2031. Brands justify higher tags by offering customizable finishes, integrated charging ports, and lifetime hardware warranties. Economy lines lose share to private-label imports that compress margins for traditional discount chains. Deferred-interest promotions help bridge affordability gaps, keeping volume flowing across brackets.
Resale platforms spotlight higher residual values on premium goods, reinforcing buy-once thinking among eco-minded consumers. D2C labels leverage online configuration tools to deliver bespoke options at lower mark-ups than boutique showrooms. Warranty length emerges as a decisive factor, with ten-year coverage now common in premium mattresses and sofas. Regional wealth hubs along the coasts post outsized premium penetration, while value-oriented heartland markets lean mid-range. The US home furniture market size is thus segments along income lines, yet trends toward quality investment over frequent replacement.
By Distribution Channel: Omnichannel Takes Center Stage
Specialty Stores retained 74.85% revenue share in 2025 by combining tactile displays with design consultations that remain persuasive for big-ticket decisions. Many now integrate endless-aisle kiosks and virtual-reality planners to merge digital breadth with physical validation. Online channels, however, are racing ahead at a 6.4% CAGR as improved last-mile networks enable scheduled, room-of-choice delivery on bulky items. Home centers and warehouse clubs capture impulse buys on accent pieces yet struggle to match the visualization experiences offered by online leaders. Hybrid journeys dominate, with 45% of shoppers researching online before buying in-store.
Mobile checkout must be frictionless because a majority of Wayfair orders originate on phones; retailers, therefore, invest in faster page loads and one-tap payment integrations. Live-chat design advice and AI-driven recommendation engines lift online attachment rates. Showrooms deploy QR codes that transfer cart contents to customer phones for later completion, unifying channels. Inventory visibility across networked stores enables same-day pickup, satisfying immediacy expectations. The US home furniture market rewards retailers that present consistent pricing, availability, and service regardless of entry point.
Geography Analysis
The West claimed 27.05% of US home furniture market size in 2025, buoyed by California’s high incomes and stringent sustainability codes that spur demand for certified wood collections. Tech-centric wealth centers such as San Francisco and Seattle adopt AR-enabled shopping faster than other regions, setting digital benchmarks that ripple nationwide. Proximity to Pacific ports eases import flows, yet recent congestion motivates investment in Southern California distribution hubs that shorten final-mile distance. Open-plan urban condos drive strong sales of modular living-room systems designed for flexibility within compact footprints. West-coast style leadership often cascades to interior states within two product cycles, reinforcing the region’s trend-setting role.
The Southwest registers the fastest CAGR at 5.18% through 2031 as migrants and corporate relocations fuel continuous household formation. Texas metros like Dallas and Austin post double-digit population gains that translate directly into furniture demand across mid-range and premium brackets. Year-round mild weather expands outdoor-living categories, boosting demand for weather-resistant seating and dining sets. Hispanic cultural influences favor large family-gathering furniture, enlarging dining room order sizes. Business-friendly tax regimes attract manufacturers seeking central U.S. distribution nodes, further anchoring furniture supply chains within the region.
The Northeast, Southeast, and Midwest exhibit varied dynamics shaped by demographic shifts, manufacturing heritage, and climate. The Northeast maintains premium segment strength despite slower population growth because renovation frequency remains high in aging housing stock. The Southeast leverages logistical advantages and an existing upholstery cluster in North Carolina, supporting faster restock cycles for national chains. The Midwest grapples with out-migration yet retains strong specialty-store networks in Chicago and Minneapolis that serve regional customers seeking quality craftsmanship. These regions keep the US home furniture market diversified and resilient against localized shocks.
Competitive Landscape
Three sizable deals have redefined scale economics: HNI’s USD 2.2 billion Steelcase purchase, Tempur Sealy’s USD 5 billion Mattress Firm takeover, and IKEA’s USD 2.2 billion omnichannel expansion program. Consolidators aim to secure procurement leverage, unified logistics, and cross-category assortment breadth. Ashley Furniture has invested USD 2 billion since 2017 on U.S. automation, deploying nearly 500 robots that raise throughput and mitigate labor shortages[4]Source: Ashley Furniture Industries, “Automation Investments Overview,” ashleyfurniture.com . Despite scale moves, only 3% of brands offer native AR, leaving differentiation headroom for digital pioneers. Direct-to-consumer entrants exploit social-media reach and customizable product flows to chip away at legacy store loyalty.
Import price pressure endures as Chinese producers circumvent tariffs by shifting final assembly to Vietnam and Indonesia. Domestic firms counter with rapid-ship programs promising delivery in under two weeks, enabled by strategically located inventory pools. Sustainability credentials become must-have bid qualifiers in hospitality and government tenders, prompting widespread adoption of BIFMA LEVEL and GREENGUARD certifications. Subscription furniture start-ups remain niche yet spark interest among younger renters who value flexibility over ownership, prompting incumbents to pilot leasing models. Competitive intensity therefore spans cost, speed, sustainability, and experience, with few players excelling in all four.
Niche specialists carve defensible ground through localized craftsmanship, reclaimed-wood narratives, or heritage upholstery techniques. At the same time, artificial-intelligence tools for demand forecasting and hyper-personalized marketing gain traction among midsize chains aiming to close the data gap with e-commerce giants. IKEA’s new Plan & Order points illustrate how physical footprints can shrink while design services expand, lowering fixed costs per sale. Wayfair’s labeling program, “Wayfair Verified,” signals a push toward consistent quality metrics that could raise consumer expectations across the board. Overall, the US home furniture market rewards agile firms that scale sustainably and digitize customer interactions without abandoning tactile brand attributes.
United States Home Furniture Industry Leaders
Ikea
Williams-Sonoma, Inc.
Wayfair Inc.
Ashley Furniture Industries
La-Z-Boy Inc.
- *Disclaimer: Major Players sorted in no particular order

Recent Industry Developments
- August 2025: HNI Corporation agreed to acquire Steelcase for USD 2.2 billion, creating the largest U.S. office-to-residential furniture supplier combination.
- June 2025: IKEA confirmed two Phoenix-area locations slated for 2026 to deepen Southwest reach.
- May 2025: IKEA U.S. announced eight new-format stores for 2025 as part of a USD 2.2 billion omnichannel investment.
- May 2025: Tempur Sealy closed its USD 5 billion Mattress Firm deal and rebranded as Somnigroup International to underscore its integrated retail strategy.


United States Home Furniture Market Report Scope
Home furniture refers to the category of products, which occupy the physical ambiance of a house and market consists of sales of household furniture products such as dining tables, sofas, beds, chairs, bassinets, bookcases, chairs, TV stands and other household furniture products made from materials including wood, metal, plastics, leather, and other materials. The United States Home Furniture Market is Segmented by Product (Kitchen Furniture, Living and Bedroom Furniture, Bathroom Furniture, Outdoor Furniture, and Other Furniture) and Distribution Channel (Home Centers, Flagship Stores, Specialty Stores, Online Stores, and Other Distribution Channels). The report offers market size and forecasts for the United States Home Furniture Market in value (USD billion) for all the above segments.
By Product
| Living Room and Dining Room Furniture |
| Bedroom Furniture |
| Kitchen Furniture |
| Home Office Furniture |
| Bathroom Furniture |
| Outdoor Furniture |
| Other Furniture |
By Material
| Wood |
| Metal |
| Plastic & Polymer |
| Others |
By Price Range
| Economy |
| Mid-Range |
| Premium |
By Distribution Channel
| Home Centers |
| Specialty Furniture Stores (including exclusive brand outlets) |
| Online |
| Other Distribution Channels (includes hypermarkets, supermarkets, teleshopping, warehouse clubs, departmental stores, etc.) |
By Geography
| Northeast |
| Southeast |
| Midwest |
| Southwest |
| West |
| By Product | Living Room and Dining Room Furniture |
| Bedroom Furniture | |
| Kitchen Furniture | |
| Home Office Furniture | |
| Bathroom Furniture | |
| Outdoor Furniture | |
| Other Furniture | |
| By Material | Wood |
| Metal | |
| Plastic & Polymer | |
| Others | |
| By Price Range | Economy |
| Mid-Range | |
| Premium | |
| By Distribution Channel | Home Centers |
| Specialty Furniture Stores (including exclusive brand outlets) | |
| Online | |
| Other Distribution Channels (includes hypermarkets, supermarkets, teleshopping, warehouse clubs, departmental stores, etc.) | |
| By Geography | Northeast |
| Southeast | |
| Midwest | |
| Southwest | |
| West |


Key Questions Answered in the Report
What is the projected value of the US home furniture market in 2031?
The sector is expected to reach USD 157.2 billion by 2031, reflecting a 3.78% CAGR over the forecast period.
What is the market size of the US home furniture market in 2026?
The market is estimated at USD 130.57 billion in 2026.
Which product category currently leads sales?
Living Room and Dining Room Furniture holds the top spot with 37.05% revenue share in 2025.
Which region is growing the fastest?
The Southwest is set to post a 5.18% CAGR through 2031 thanks to strong migration and household formation.
How quickly are online channels expanding?
Online furniture sales are advancing at a 6.4% CAGR, the highest among distribution channels.
What material dominates manufacturing?
Wood remains the leading material, accounting for 62.10% of 2025 sales because of consumer preference for natural aesthetics and certified sourcing.
Page last updated on:


